
Avalanche has spent the last two years on a volatile ride - from a December 2024 peak above $55 to a brutal correction that pushed AVAX below $10 by early 2026. Now, with the broader crypto market recalibrating, traders and long-term holders alike are asking the same question: where does AVAX go from here?
This guide breaks down AVAX price predictions for 2026 through 2031, grounded in technical analysis, on-chain fundamentals, and a clear-eyed look at what multiple analyst models are actually saying - including their wildly divergent long-term scenarios.
⚡ Key Takeaways
- AVAX is currently trading around $9.38, with the 50-day SMA at $9.38 and the 200-day SMA at $13.98 - a significant gap that reflects the depth of the 2025-2026 correction.
- 2026 forecast range: Conservative models project $7-$10; bullish models see $40-$49 if altcoin season materializes.
- Long-term divergence is extreme: Optimistic analyst models project AVAX above $267 by 2031; bearish models show a potential decline to the $3.50-$5.00 range by 2030.
- Crypto trading involves substantial risk of loss - these forecasts are analytical estimates, not financial advice.
What Is Avalanche (AVAX)? Blockchain Fundamentals Explained
Avalanche is a high-throughput Layer-1 blockchain built to challenge Ethereum's dominance in the smart contract space. Founded by Ava Labs - led by CEO and Cornell computer science professor Emin Gün Sirer - Avalanche launched its mainnet in September 2020 after raising $42 million in a public sale that sold out in under 4.5 hours. The speed of that raise reflected genuine market conviction in the technology.
AVAX is the platform's native token, serving three core functions: paying transaction fees (gas), participating in network governance, and staking to validate the network under its Proof-of-Stake consensus. With a circulating supply of approximately 416 million AVAX and a maximum supply cap of 720 million, AVAX has a defined scarcity model. The all-time high sits at $146.22 (November 2021), while the all-time low was $2.79 (December 2020).
Avalanche Architecture: X-Chain, P-Chain, and C-Chain
What makes Avalanche technically distinct is its three-chain architecture. Most Layer-1 blockchains use a single chain to handle everything - which creates bottlenecks. Avalanche splits responsibilities:
- C-Chain (Contract Chain): EVM-compatible smart contract execution - this is where DeFi protocols, NFTs, and dApps live. Developers can port Ethereum projects here with minimal code changes.
- P-Chain (Platform Chain): Coordinates validators, manages staking, and enables the creation of subnets - Avalanche's scalability advantage for enterprise and custom blockchain deployments.
- X-Chain (Exchange Chain): Handles native asset creation and transfers with high throughput at minimal fees.
Subnets deserve specific attention. They allow organizations to launch their own EVM-compatible blockchains that share Avalanche's security but operate with custom rules. The Dantewada District Administration in Chhattisgarh, India, recently used the Avalanche blockchain to digitize land records dating back to the 1950s - a real-world enterprise adoption example that signals growing institutional interest beyond speculative trading.
AVAX Tokenomics and Supply Dynamics
Most price prediction articles mention AVAX's supply numbers and move on. The more important mechanism is the fee-burn model: every transaction fee paid on Avalanche is burned, permanently removing AVAX from circulation. During periods of high network activity - DeFi surges, NFT mints, subnet launches - burn rates increase, creating deflationary pressure on the circulating supply.
Staking also reduces effective supply. Validators must stake a minimum of 2,000 AVAX, and delegators must stake at least 25 AVAX, with lock-up periods of 2 weeks to 1 year. When large percentages of circulating supply are locked in staking, sell pressure drops. Combined with the burn mechanism, high on-chain activity and high staking participation create a dual compression on circulating supply - which has historically preceded significant price moves in AVAX.

AVAX Price Predictions 2026-2031: Year-by-Year Forecast
This is the core of what most readers are here for, so let me be direct: AVAX price predictions carry unusually wide uncertainty ranges right now. The gap between bullish and bearish analyst models isn't a minor disagreement - it's a chasm. Optimistic models project AVAX above $267 by 2031. CoinCodex's algorithmic model projects AVAX at ~$4.42 by 2030. Same asset. A divergence of over 6,000% across seven years.
That divergence isn't a bug - it reflects genuine uncertainty about which macro and adoption scenarios will play out. Here's how the scenarios break down, year by year.
AVAX Price Prediction 2026
The 2026 forecast is the most immediately actionable - and the most split. Conservative models from CoinCodex show AVAX ranging from $6.62 to $9.72 across 2026, suggesting the current price zone (~$9.38) may be near the top of the bear case range. The 50-day SMA sits exactly at current price levels, while the 200-day SMA at $13.98 represents the first major recovery target.
Bullish analysts project a dramatically different picture: a range of $40-$49, driven by a Bitcoin halving follow-through effect that typically ripples into altcoins 6-12 months after the halving event. The RSI at 52.77 (neutral territory) and positive MACD histogram momentum offer some technical support for near-term recovery - but "near-term recovery" and "reaching $40 in 2026" are very different propositions.
The honest framing: 2026 is a binary year for AVAX. Either the broader crypto market enters a sustained altcoin season, in which case AVAX could make a significant move toward the $20-$40 range, or macro headwinds and continued Bitcoin dominance keep altcoins range-bound at current levels.
AVAX Price Prediction 2027-2028
The 2027-2028 window represents the classic post-halving altcoin cycle peak scenario. Bitcoin's most recent halving creates supply shock that historically takes 12-18 months to fully propagate into altcoin price appreciation. If that pattern holds, 2027 becomes the year AVAX could see its next significant bull run.
Optimistic models project AVAX between $59.93 and $71.39 in 2027, with a further push to $84.70-$106.00 in 2028. For context, AVAX reached $49.96 in October 2023 and briefly touched $55+ in December 2024 - so a $60-$100 range in 2027-2028 would represent an extension of momentum already demonstrated. Bearish models, however, show AVAX declining through both years - reaching lows around $6.43 by August 2027. This scenario assumes prolonged macro tightening or loss of market share to competing Layer-1 chains.
AVAX Price Prediction 2029-2031
Long-range crypto price prediction is, to be direct, highly speculative. Beyond the 3-year horizon, variables multiply to a point where models are less "forecasts" and more "scenario sketches."
Will AVAX reach $100? Under bullish models, yes - projections place $100+ in the 2028-2029 window, assuming continued ecosystem growth and favorable market cycles.
Can AVAX reach $1,000? Reaching $1,000 before 2031 would require a market capitalization exceeding Ethereum's current cap multiple times over. No credible analyst model projects this as a realistic scenario in the near decade - treat any such prediction with serious skepticism.
By 2031, the spread between models reaches its maximum: CoinCodex projects AVAX in the $3.70-$5.13 range, while bullish models project $267-$326. Regulatory environment, competitive positioning against Ethereum and Solana, and real-world subnet adoption will be the primary determinants of which scenario plays out.
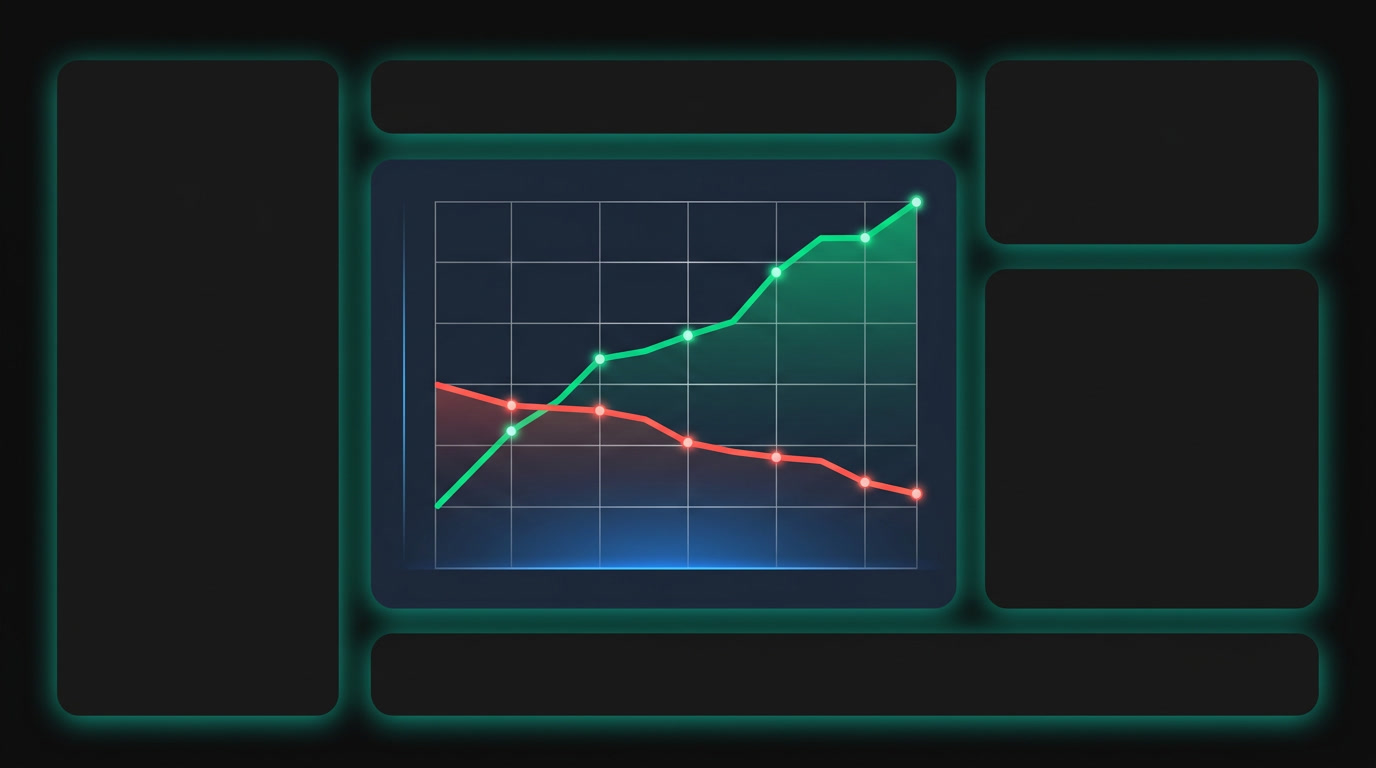
Avalanche Technical Analysis: Indicators and Chart Patterns
Price predictions built without technical grounding are opinions dressed as analysis. Here's what the indicators actually show for AVAX right now.
The RSI at 52.77 sits squarely in neutral territory - neither overbought nor signaling imminent capitulation. The MACD histogram has turned positive, suggesting near-term bullish momentum building off the annual lows. The Williams Alligator indicator is "sleeping" (its lines are converging), which technical analysts interpret as a consolidation phase preceding a directional move - though the direction itself isn't predetermined by the pattern.
The short-term SMAs and EMAs are aligned bullishly - the 3, 5, and 10-period averages all signal buy. The medium and longer-term averages tell a different story: every SMA and EMA from the 100-period upward signals sell, reflecting the sustained downtrend that began at the December 2024 peak. This is the technical picture of an asset that's recovering off a low but hasn't yet reversed its primary trend.
Key Support and Resistance Levels for AVAX
For traders using Fibonacci Retracement analysis on AVAX's move from the December 2024 high (~$55.41) to the recent annual low (~$9.00), the key retracement levels emerge as follows.
Volume confirmation matters here. A price break above the 38.2% Fibonacci level (~$14.60, which aligns closely with the 200-day SMA at $13.98) on high volume would be the first technically meaningful signal of trend reversal. Without volume, any bounce risks being a dead-cat pattern rather than a genuine recovery.

How to Buy AVAX: Step-by-Step Guide for Beginners
Understanding the price forecast is one thing - knowing how to act on it is another. Here's the straightforward process for purchasing AVAX.
- Choose a reputable exchange. AVAX is listed on major exchanges including Binance, MEXC, Coinbase, and Kraken. Compare fees, supported fiat currencies, and withdrawal options before committing.
- Create and verify your account. Most exchanges require KYC verification - government ID, selfie, and sometimes proof of address. This typically takes 10 minutes to a few hours. Unverified accounts often face withdrawal limits.
- Deposit funds. Fund your account via bank transfer (usually lowest fees), debit/credit card (convenient but higher fees), or by sending existing crypto. Check deposit minimums before you start.
- Place your buy order. A market order executes immediately at current price - simple but you accept slippage. A limit order lets you set a specific price target and waits for the market to reach it. For larger positions, limit orders reduce the risk of unfavorable execution.
- Transfer to a self-custody wallet for long-term holding. If you're holding AVAX for months or years, keeping it on an exchange creates counterparty risk. Transfer to a hardware wallet (Ledger, Trezor) or a non-custodial software wallet. With self-custody, you control your private keys - your funds remain yours regardless of what happens to any exchange platform.
⚠ Risk Reminder
- Only allocate → what you can afford to lose entirely.
- Self-custody → blockchain transactions are irreversible; always double-check wallet addresses before transferring.
- Crypto trading → involves substantial risk of loss; past price performance does not predict future results.
How to Evaluate AVAX Price Predictions: Methodology and Criteria
Not all AVAX price predictions are created equal - and knowing how to assess them is more valuable than any single forecast number. Understanding how DeFi protocols work gives you a stronger foundation for evaluating on-chain claims in any price analysis.
The Crypto Fear & Greed Index currently sits at 23 - Extreme Fear, indicating widespread pessimism across the market. Historically, Extreme Fear readings have appeared at or near market bottoms - contrarian investors often treat them as potential buying signals. However, they can also persist for weeks or months during structural bear markets.
Bullish vs. Bearish Scenarios: What Each Model Assumes
✓ BULLISH ASSUMPTIONS
- Bitcoin halving drives sustained altcoin season in 2026-2027
- Subnet adoption accelerates; TVL grows significantly
- TradFi and enterprise adoption of Avalanche subnets expands
- Risk appetite returns; global rates fall; capital flows into crypto
- Favorable US and international crypto regulation
✕ BEARISH ASSUMPTIONS
- Halving effect already priced in; no meaningful altcoin rotation
- Competition from Ethereum L2s and Solana erodes market share
- Regulatory uncertainty delays institutional entry
- Prolonged macro tightening; continued flight to Bitcoin
- Restrictive regulation curbs DeFi and on-chain activity
Both scenarios are legitimate analytical positions. The wide forecast range is the honest answer to a genuinely uncertain question.
Red Flags in AVAX Price Forecasts: What to Watch Out For
After reviewing dozens of AVAX price prediction articles, these are the red flags that should immediately lower your confidence in any forecast:
- No methodology disclosure. If an article can't explain how it generated its price targets, treat those numbers as guesswork.
- Exclusively bullish long-term projections. Any model that shows AVAX rising consistently every year through 2031 without a bear scenario isn't forecasting - it's marketing.
- Single-source forecasts presented as consensus. One tool's algorithm ≠ consensus. Always compare multiple models.
- Ignoring current price context. A 2026 prediction of $50 means nothing without acknowledging that AVAX is currently at $9.38 - that's a 432% increase. What specifically drives that move?
- Absence of risk disclosure. Any price prediction article that doesn't acknowledge the substantial possibility of loss should be read with extreme skepticism.
Factors That Will Drive AVAX Price in 2026 and Beyond
Technical analysis tells you what the chart looks like today. Fundamental analysis tells you what could change the chart tomorrow.
The Dantewada land records case - 70 years of government data stored on Avalanche's blockchain - is exactly the kind of enterprise adoption signal that doesn't show up in price charts immediately but shapes the long-term valuation case. When governments start treating a blockchain as infrastructure-grade, it changes the category from "speculative asset" to "utility asset."
AVAX vs. Competitors: Ethereum, Solana, and Other Layer-1s
Avalanche doesn't exist in a vacuum. How it competes with Ethereum and Solana for developer mindshare and DeFi TVL will significantly determine its price trajectory.
Ethereum's DeFi dominance is substantial and won't be disrupted quickly - $47B in TVL versus Avalanche's ~$800M reflects a deep liquidity moat. Solana's transaction speed advantage is genuine, though its history of network outages creates ongoing risk for institutional adoption. Avalanche's subnet architecture is genuinely differentiated - the ability to launch custom EVM-compatible chains with shared security appeals to enterprises that need compliance controls without sacrificing decentralization.
AVAX Price History: Key Milestones and Lessons
The best context for where AVAX might go is where it's already been.
AVAX PRICE HISTORY - KEY MILESTONES 2020-2026
Jul 2020
Public sale raises $42 million in under 4.5 hours. Mainnet launches September 2020. Pre-launch demand signal validates the technology thesis.
Dec 2020
AVAX hits all-time low of $2.79. Network still proving technical reliability; DeFi adoption minimal.
Sep 2021
Polychain Capital and Three Arrows Capital invest $230 million, acquiring AVAX tokens. Institutional catalyst triggers sharp price surge.
Nov 2021 - ALL-TIME HIGH
Deloitte partnership announced for US disaster relief funding. AVAX enters top-10 by market cap. Price reaches $146.22 - the all-time high.
Oct 2023
AVAX recovers to $49.96 amid broader market recovery. First post-bear bull signal; over 100M ASC-20 tokens minted since June 2023.
Dec 2024
Local peak at ~$55.41 after November bull run. Start of 2025-2026 correction cycle.
Apr 2026 - CURRENT
Trading ~$9.38. Post-correction consolidation. RSI neutral at 52.77. Short-term SMAs bullish; 200-day SMA still a significant resistance target at $13.98.
The lesson from history: AVAX's biggest moves have come when institutional capital, ecosystem activity, and broader market sentiment aligned simultaneously. Waiting for that alignment - rather than trying to time individual catalysts - has historically been the more reliable approach.
Conclusion: Should You Consider AVAX in 2026?
The technical picture for AVAX in April 2026 shows an asset in deep correction, with short-term indicators recovering but medium-term indicators still bearish. The fundamental case - subnet adoption, tokenomic mechanics, enterprise use cases - is intact but unproven at scale. Studying broader cryptocurrency market cycles alongside AVAX-specific data gives the most complete picture.
Here's how the analysis translates by investor profile:
LONG-TERM HODLERS
The bullish case requires Bitcoin halving follow-through, subnet adoption, and favorable regulation - all plausible but none certain. Position sizing that reflects the $267 vs $4.42 by 2031 divergence is essential.
ACTIVE TRADERS
The 38.2% Fibonacci level (~$14.60) and 200-day SMA (~$13.98) form a key confluence resistance zone. A high-volume daily close above this zone is the first technically valid reversal signal to watch.
RISK-AVERSE INVESTORS
AVAX is down ~93% from its all-time high. If your risk tolerance doesn't accommodate potential 50%+ further drawdowns, very small position sizing relative to total portfolio is the appropriate approach.
Platforms that prioritize on-chain verifiability and transparent mechanics - like Zipmex, which offers self-custodial perpetuals trading with on-chain verifiable outcomes - reflect where the DeFi industry is moving: toward trustless, auditable systems where users control their own funds without counterparty risk. That broader industry direction aligns with what makes Avalanche's subnet architecture compelling as enterprise infrastructure.
Whatever scenario plays out for AVAX, price predictions from any single source should be treated as one input - not a trading plan.
Crypto trading involves substantial risk of loss. The forecasts and analysis in this article are for informational purposes only and do not constitute financial advice. Always conduct independent research and consider consulting a financial advisor before making investment decisions.
Last updated: April 2026.
Frequently Asked Questions
What is the AVAX price prediction for 2026?
AVAX price predictions for 2026 vary significantly by model. Bearish algorithmic models project AVAX remaining in the $6.62-$9.72 range, with the current price (~$9.38) near the top of that scenario. Bullish models anticipate a Bitcoin halving follow-through driving altcoin season, pushing AVAX toward $40-$49. The key variables are Bitcoin dominance trends, Avalanche ecosystem TVL growth, and whether institutional capital rotates back into altcoins. Position sizing should reflect the full range of outcomes rather than any single forecast.
Will AVAX reach $100?
Under bullish analyst models, AVAX could reach $100 in the 2028-2029 timeframe, contingent on a sustained crypto bull cycle following the Bitcoin halving. At $100 per AVAX, the market capitalization would reach approximately $41.6 billion based on current circulating supply - comparable to mid-tier blue-chip crypto assets today. Conservative models show AVAX declining well below current levels by 2028, making the $100 target a high-conviction, long-horizon scenario rather than a near-term expectation. AVAX has traded above $146 historically, so the level itself isn't unprecedented.
What is the Avalanche (AVAX) all-time high?
AVAX reached its all-time high of $146.22 on November 21, 2021, during a broader crypto market peak. The catalyst specific to Avalanche included a $230 million institutional investment from Polychain Capital and Three Arrows Capital in September 2021, followed by a partnership with Deloitte for improving US disaster relief fund management. This combination drove AVAX into the top-10 cryptocurrencies by market capitalization at that time. AVAX is currently trading approximately 93% below that peak level.
What technical indicators are used to predict AVAX price?
The primary technical indicators used in AVAX price analysis include RSI (Relative Strength Index) for overbought/oversold signals, MACD (Moving Average Convergence Divergence) for momentum direction, Simple and Exponential Moving Averages (SMA/EMA) across multiple timeframes for trend confirmation, Bollinger Bands for volatility range identification, and Fibonacci Retracement levels for support and resistance mapping. Volume analysis confirms whether price moves are backed by genuine market participation. Currently, AVAX's RSI is at 52.77 (neutral), MACD histogram is positive, but the 200-day SMA at $13.98 remains a significant overhead resistance level.
What makes Avalanche different from Ethereum?
The most significant technical differentiator is Avalanche's subnet architecture, which allows developers and enterprises to launch independent EVM-compatible blockchains sharing Avalanche's security. Transaction fees on Avalanche are a fraction of Ethereum's, and finality is under 2 seconds versus Ethereum's 12-15 seconds. However, Ethereum's DeFi TVL (~$47B) versus Avalanche's (~$800M) reflects a substantial maturity gap that Avalanche hasn't yet closed. Avalanche's EVM compatibility means Ethereum developers can port projects with minimal code changes, reducing the migration barrier.
How does the Bitcoin halving affect AVAX price?
Bitcoin's halving reduces new BTC issuance, creating a supply shock that has historically preceded significant Bitcoin price appreciation. As Bitcoin rises, market sentiment improves broadly, capital flows into crypto, and eventually rotates from Bitcoin into altcoins - including Layer-1 platforms like Avalanche. This rotation typically occurs 6-18 months after a halving event. However, the halving effect isn't guaranteed to replicate every cycle. Bitcoin dominance metrics are the best leading indicator of when altcoin rotation is beginning - if dominance is rising, capital hasn't rotated yet.
Is AVAX a good investment in 2026?
Whether AVAX represents a sound investment depends on your risk tolerance, time horizon, and portfolio construction - not on any single forecast. AVAX is currently trading ~93% below its all-time high, creating potential upside alongside genuine uncertainty. The technical setup shows consolidation near annual lows with neutral sentiment. The fundamental case - subnet adoption, tokenomic burn mechanics, enterprise use cases - is intact but unproven at scale. This is not financial advice: assess your own risk capacity before any allocation, and never allocate more than you're prepared to lose entirely.
