
Any serious cardano ada price prediction starts with one honest acknowledgment: ADA is a high-volatility asset in a high-volatility market, and no analyst has a crystal ball. What analysts do have are on-chain metrics, historical price cycles, technical indicators, and a solid understanding of Cardano's development roadmap - and right now, those inputs are generating some of the most interesting forecasts in the altcoin space.
This guide covers everything that moves ADA's price: historical performance, year-by-year targets from 2026 through 2040, key technical signals, macro catalysts, and how different investor types should approach the asset. All price forecasts carry inherent uncertainty - treat every figure here as a probabilistic range, not a guarantee.
⚡ Key Takeaways
- ADA's all-time high is $3.10, reached in September 2021 [CoinGecko]. As of early 2026, the token trades roughly 90% below that level.
- Consensus analyst range for 2026: $0.71-$1.50 (avg. ~$0.90).
- Major bullish catalyst: ADA's inclusion in the US Strategic Crypto Reserve - the first time the asset has received explicit political endorsement at the federal level [CoinDesk Policy].
- Spot ADA ETF applications from Grayscale and Canary Capital [CoinDesk] are under SEC review, with deadlines extending into mid-2026.
Before running through the numbers, understanding Cardano's architecture is worth a few minutes - because the fundamental design directly shapes why analysts assign the price targets they do.
What Is Cardano (ADA)?
Cardano is a proof-of-stake blockchain platform built for smart contracts and decentralised applications. Charles Hoskinson - one of Ethereum's original co-founders - launched it in 2017 alongside Jeremy Wood, with a specific philosophy that set it apart from day one: every protocol decision would be peer-reviewed by academic researchers before deployment Cardano Foundation.
That research-first approach means Cardano has moved more slowly than some competitors. Slowly, but deliberately. The core consensus mechanism - Ouroboros - was the first proof-of-stake protocol ever published through formal academic peer review, and the main programming language, Haskell, is the same one used by banks and defence systems for high-assurance security requirements. These aren't marketing talking points; they're architectural decisions that define the asset's risk profile and long-term adoption story.
ADA, the native token, serves two functions simultaneously: it pays for network fees when users interact with smart contracts and dApps, and it acts as the governance and staking currency that secures the network. Total supply is capped at 45 billion ADA, with roughly 78% already in circulation through ICO allocations, staking rewards, and team distribution.
Compared to Ethereum and Solana, Cardano's DeFi ecosystem is smaller in total value locked - but its energy efficiency (PoS from day one, never PoW), formal verification approach to smart contracts, and deterministic fee model give it a distinct positioning. The competitive gap to Ethereum remains large. Whether it closes by 2030 is the central question behind most long-term ADA price predictions.
How Cardano's Ouroboros Protocol Works
Ouroboros divides blockchain time into epochs and slots. Within each epoch, the protocol randomly selects "slot leaders" from the pool of ADA stakers, weighted by stake size. Each slot leader validates a block of transactions and adds it to the chain - then the selection resets for the next slot. The result is a system that achieves Bitcoin-level cryptographic security at a fraction of the energy cost, because there's no computational race to solve puzzles.
For ADA holders, this design has a direct economic implication: staking your ADA secures the network and earns you a proportional share of transaction fees. Typical staking yields run in the 3-5% APY range, making ADA what some analysts call a "productive asset" - you're not simply holding for price appreciation, you're earning yield while you wait.
Hydra, Cardano's Layer-2 scaling solution, sits on top of Ouroboros and is critical context for any long-term forecast. In recent testing, Hydra achieved close to 1 million transactions per second on a gaming application [IOHK] - far beyond what the Ethereum base layer can handle. The upcoming Ouroboros Leios upgrade is expected to further improve base-layer throughput, and these scalability milestones factor directly into whether Cardano can attract the DeFi TVL it needs to sustain higher price levels.
Understanding Ouroboros matters for price analysis because protocol upgrades - Shelley, Vasil, and the pending Leios - have historically been the most reliable catalysts for ADA's short-term price movements. The pattern repeats: upgrade approaches, sentiment turns bullish, price runs, profit-taking hits. Knowing where Cardano sits on that cycle is half the analysis.
Cardano (ADA) Price History
ADA launched in 2017 at roughly $0.02 after a public token sale. Within weeks, the momentum from the broader 2017 bull run pushed it to an early ATH of $1.04 by January 2018 - a 5,000%+ move from launch price that set an unrealistic baseline in retail memory.
The 2018 crypto crash was brutal for ADA. By March 2018, the token had fallen to $0.14. By November 2018, it sat at $0.04. The 2019 market offered brief relief followed by another sell-off, and ADA essentially went sideways until the Shelley upgrade arrived in July 2020. That upgrade - which introduced ADA staking and made the network 50-100x more decentralised - triggered an 85% price surge in ten days, taking ADA from roughly $0.08 to $0.15 and past Bitcoin SV in market cap ranking.
The real breakout came in 2021. The broader crypto bull run pushed ADA to $2.46 by May, and the Alonzo smart contract upgrade in September 2021 carried it to its all-time high of $3.10 on September 2, 2021 CoinMarketCap. Then the cycle turned. The Terra LUNA collapse in May 2022 and the FTX implosion in November 2022 shredded the entire market. ADA ended 2022 at $0.24.
One important lesson from this history: the Vasil Hard Fork of September 2022 - a legitimate protocol improvement that made Cardano faster and cheaper - produced almost no positive price impact because macro sentiment dominated. Fundamentals matter for the long run. In the short run, Bitcoin correlation and global risk appetite call the shots.
That context is essential when reading any cardano ada price prediction for 2026. The upgrade cycle is favourable. Whether macro cooperates is a separate question entirely.
Cardano (ADA) Price Prediction 2026-2040
Analyst forecasts for ADA span a wide range, reflecting genuine disagreement about Cardano's adoption trajectory. Some analysts build models on technical price action; others focus on DeFi TVL growth and network activity; a few use algorithmic extrapolation of historical cycles. No single model is definitively correct - which is why presenting a consensus range is more useful than citing a single number.
Two macro catalysts currently dominate the bullish case: ADA's inclusion in the US Strategic Crypto Reserve (announced March 2025, placing ADA alongside BTC, ETH, XRP, and SOL as a government-recognised strategic asset) and the SEC's ongoing review of spot ADA ETF applications from Grayscale and Canary Capital. Neither outcome was on the table 18 months ago. Both fundamentally change Cardano's institutional credibility profile.
⚠ Disclaimer
- All price forecasts below represent third-party analyst consensus ranges and should not be construed as financial advice. → Cryptocurrency markets carry substantial risk of loss. Past price performance is not indicative of future results.
ADA Price Prediction 2026
The 2026 outlook is shaped by two forces pulling in opposite directions: strong political tailwinds and persistent technical headwinds.
On the bullish side, the Strategic Crypto Reserve inclusion is genuinely unprecedented - ADA now sits alongside Bitcoin in a US government reserve asset framework. Charles Hoskinson's direct involvement in US crypto policy gives Cardano a political credibility that most Layer-1 projects don't have. Hydra's demonstrated near-1 million TPS performance strengthens the technical case. And the Canary ADA ETF deadline of May 29, 2026 creates a hard catalyst date for institutional interest.
On the technical side, as of early 2026 ADA was trading below its 20/50/100/200-day moving average cluster, with RSI in lower-neutral territory (~35) and MACD yet to confirm a reversal. The $0.37-$0.43 resistance zone is the first wall to break. Until ADA reclaims the 100-day SMA, the technical trend is downward.
The analyst consensus range sits between $0.71 on the conservative end and $1.50 if the ETF gets approved and the broader crypto bull run resumes. Average projections cluster around $0.90.

ADA Price Prediction 2027
By 2027, the DeFi story becomes the dominant narrative. Cardano's ability to attract high-yield DeFi protocols - similar to the synthetic asset platforms already offering notable stablecoin yields on the network - will determine whether TVL accelerates and ADA demand rises accordingly.
Benzinga's 2027 forecast places ADA in the $0.48-$0.57 range in a moderate case, rising to roughly $0.57 with the Hydra and Mithril scaling upgrades successfully deployed. More optimistic models that factor in ETF-driven institutional inflows and DeFi TVL growth reach the $1.20-$1.80 range. Algorithmic models project a $0.27-$0.80 range, with the upper end contingent on trend continuation from 2026.
Cardano doesn't need to defeat Ethereum in DeFi to generate significant ADA price appreciation. It needs a meaningful share of the DeFi TVL growth that research models project at ~46% CAGR through 2030 Zipmex Research. Even capturing 3-5% of incremental DeFi volume would represent a multi-billion dollar increase in Cardano's on-chain economy.
ADA Price Prediction 2030
The 2030 analysis operates on a completely different timescale - four years of Bitcoin halving effects, DeFi market maturation, and Cardano's full upgrade roadmap completion.
Two Bitcoin halvings are scheduled between now and 2030. Historically, each halving cycle has produced a broad altcoin bull run with ADA generating 500-1,000%+ returns from cycle lows. That pattern isn't a law, but it's a consistently observed market dynamic.
The DeFi market size - estimated at roughly $20 billion TVL today - is projected by some research firms to grow at nearly 46% CAGR through 2030. If Cardano participates meaningfully in that expansion, the TVL-driven demand for ADA as the network's utility and staking token creates fundamental price support independent of sentiment cycles.
Will ADA reach $10 by 2030? Based on current growth trajectories, this is within the plausible range under a base or bullish scenario. Analyst consensus sits at $9.56-$12.72, with an average projection around $10.37. The bearish case ($9.56) assumes two favourable halving cycles but limited DeFi penetration. The bullish case ($12.72) assumes Cardano reaches top-3 smart contract platform status.
ADA Price Prediction 2040
Fifteen-year crypto forecasts are more thought experiment than analysis. The variables - regulation, technology shifts, competitive landscape, macro cycles - compound in ways that make any specific number unreliable. That said, directional framing has value.
Will ADA reach $100? At current trajectory: unlikely before 2040, and not certain even then. Reaching $100 would require a market cap of roughly $4.5 trillion (at full ADA supply) - larger than the current entire crypto market. It's not impossible in a world where blockchain becomes core financial infrastructure, but it requires a sequence of conditions that have never all been true simultaneously.
The realistic 2040 range sits between $13.50 (conservative: market saturation, stronger competition) and $25.50 (optimistic: Cardano as global financial infrastructure layer, widespread dApp adoption, deep institutional integration). The base case sits around $18.90.
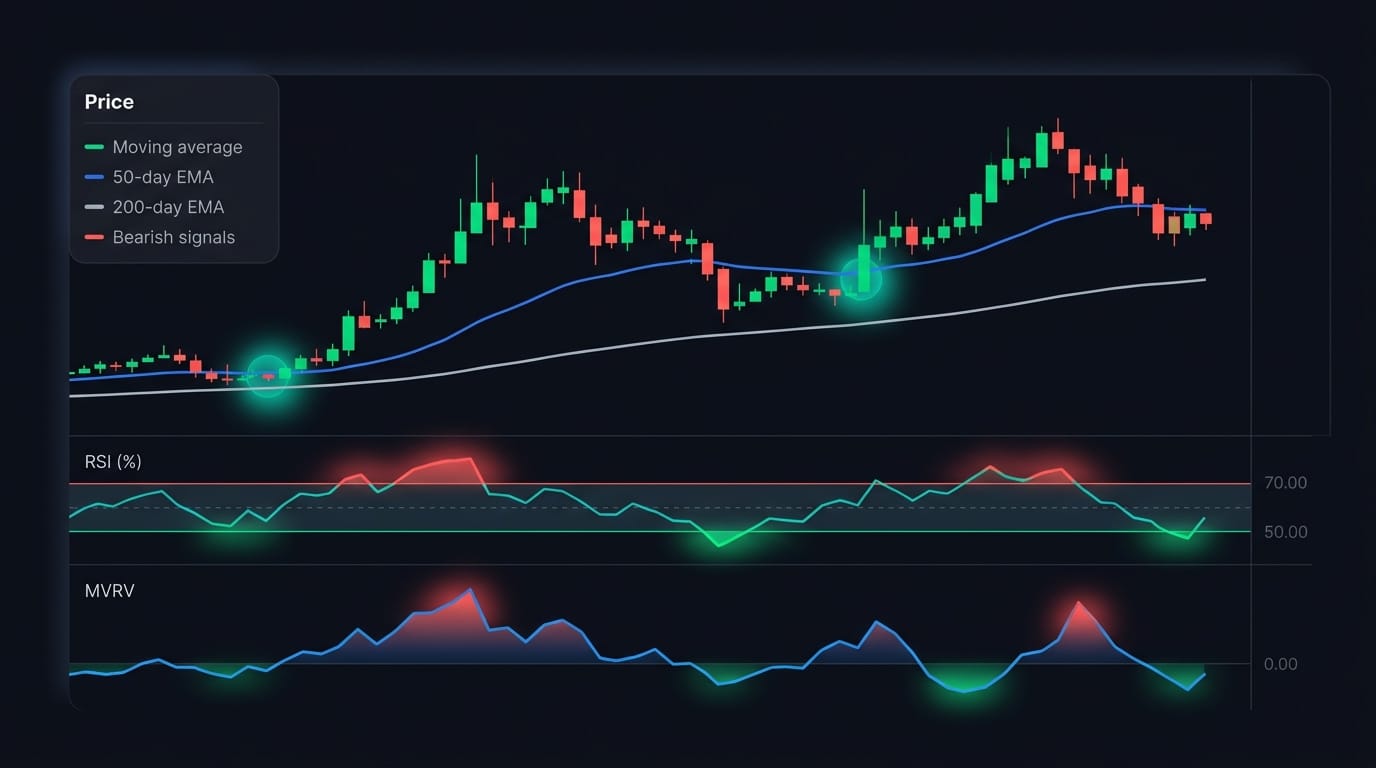
Cardano Technical Analysis: Key Indicators to Watch
Long-term fundamentals drive multi-year ADA price predictions. Technical indicators determine short-to-medium term entry and exit timing. Both matter, but they answer different questions.
As of early 2026, ADA's technical picture is bearish on every standard timeframe. The token trades below all four major moving averages (20/50/100/200-day SMAs clustered in the $0.37-$0.63 range). RSI sits near 35 - lower-neutral, not yet at extreme oversold levels that historically preceded ADA reversals. ADX around 26 confirms an established downtrend rather than a consolidation range.
What's more interesting is what on-chain data shows - specifically the MVRV ratio.
Working from Capital.com's technical data and standard pivot analysis, ADA's current key levels are:
Resistance:
- $0.37-$0.43 zone: clustered SMAs (20/50-day) + R1 pivot - first wall to break
- $0.54-$0.56: R2/R3 pivot band - meaningful resistance zone once $0.43 clears
- $0.63: 200-day SMA - major structural resistance level
Support:
- $0.32-$0.33: current price range / recent consolidation floor
- $0.28: S1 classic pivot - deeper test if current support breaks
- $0.20-$0.22: major historical support from 2022-2023 accumulation zone
Fibonacci Retracement levels from the December 2024 high ($1.20+) to the January 2026 low (~$0.28) put the 0.382 retracement near $0.57 and the 0.618 near $0.82 - alignment with R2/R3 and the major technical target for any sustained recovery.
MVRV Ratio and On-Chain Signals
This is where the analysis gets genuinely interesting - and where most competitor forecasts fall short.
MVRV stands for Market Value to Realized Value. It compares ADA's current market capitalisation (what the market says ADA is worth today) to the realized capitalisation (the aggregate price at which all ADA in circulation last moved on-chain - essentially what holders actually paid). When MVRV drops below 1.0, the market is pricing ADA below what the average holder paid. Historically, that condition has been a strong long-term accumulation signal.
ADA's MVRV ratio in early 2026 is consistent with what technical analysis flagged as an "undervalued" reading - the same configuration that preceded the 2020 and 2024 recoveries. Short-term price momentum is bearish. On-chain value positioning is long-term bullish. That divergence is exactly the signal long-term accumulators watch for.
The implication for 2026: the on-chain data supports patient accumulation for long-term holders, even as the short-term technical trend remains capped below the SMA cluster. These aren't conflicting signals - they're signals for different timeframes and different trading styles.
Key Factors That Will Drive the ADA Price Prediction
No price forecast is more reliable than the assumptions behind it. Understanding the specific variables analysts are tracking - and weighing them honestly against downside risks - gives you a far better framework for evaluating any cardano ada price prediction than following a single number.
Bullish Catalysts for Cardano
- US Strategic Crypto Reserve inclusion: The Trump administration included ADA alongside BTC, ETH, XRP, and SOL in a federally designated strategic reserve CoinDesk Policy. That's an explicit government endorsement that no regulatory agency can easily reverse. The institutional signal this sends is material.
- Spot ADA ETF review: Grayscale's Spot Cardano ETF and Canary Capital's ADA ETF are both under SEC review. ETF approval would unlock exposure for retirement funds, institutional allocators, and regulated investment vehicles that can't hold direct crypto. The Canary ADA ETF had a review deadline extended to May 29, 2026.
- Charles Hoskinson's policy influence: Hoskinson has been directly involved in US crypto policy discussions. His role as a speaker at the DC Blockchain Summit - alongside the President's family - gives Cardano a political visibility that most blockchain projects lack.
- DeFi ecosystem expansion: Cardano's DeFi protocols are producing competitive yields. On-chain TVL has room to grow significantly relative to Ethereum and Solana, and each dollar of TVL added represents incremental demand for ADA as the base asset.
Bearish Risks and Downside Scenarios
- Ethereum and Solana competition: Ethereum has orders of magnitude more developer activity and DeFi TVL. Solana has raw transaction speed and a large NFT/gaming ecosystem. Cardano needs to carve out a differentiated niche, not just compete on the same dimensions.
- Slower-than-expected dApp adoption: Cardano's developer ecosystem is smaller than its market cap ranking suggests. If TVL growth disappoints relative to projections, the fundamental demand case weakens.
- ETF delay or denial: If the SEC extends review timelines or rejects ADA ETF applications, the anticipated institutional inflow catalyst evaporates - at least temporarily.
- Macro bear market: ADA is highly correlated with Bitcoin in down markets. A macro-driven crypto selloff (rate hikes, liquidity tightening, regulatory shock) would drag ADA lower regardless of its on-chain fundamentals.
How to Buy and Store Cardano (ADA)
Buying ADA is accessible through most major centralised and decentralised exchanges. Here's the standard process:
One underrated benefit of self-custody with ADA: you can delegate your ADA to a staking pool directly from Daedalus or Yoroi and earn staking rewards (typically 3-5% APY) without locking your tokens. Your ADA remains liquid and transferable at any time while generating yield. That combination - liquidity plus yield plus self-custody - is genuinely unusual in the crypto space.
ADA Investment Strategies and Risk Management
Knowing what analysts forecast is useful. Knowing how to diversify your crypto portfolio and position for those scenarios is what actually matters. The right approach depends entirely on your time horizon, risk tolerance, and technical expertise.
Cardano vs. Competitors: ADA vs. ETH, SOL, and XRP
Understanding ADA's competitive position contextualises why price predictions vary so widely. Each of these Layer-1 assets has a different risk/reward profile.

Conclusion: Is Cardano ADA Worth Buying in 2026 and Beyond?
The cardano ada price prediction consensus tells a nuanced story: bearish technicals in the short term, material catalysts building for the medium term, and a long-term thesis that depends on whether Cardano converts research credibility into DeFi market share.
Here's how the picture looks across different investor profiles:
Two catalysts are worth watching specifically: the ADA ETF review timeline (SEC decisions expected mid-2026) and the Ouroboros Leios upgrade rollout, which is the next major throughput improvement on Cardano's roadmap. If both deliver on schedule, the 2027 $1.20-$1.80 range becomes more credible. If either slips, the base case reverts to the $0.48-$0.90 range.
The broader trend in crypto is toward transparency and on-chain verifiability. Cardano's architecture aligns with that direction, and platforms like Zipmex that are built around self-custody and provably fair mechanics operate by the same philosophy.
Frequently Asked Questions
What is the current Cardano (ADA) price prediction for 2026?
Analyst consensus for ADA in 2026 ranges from $0.71 on the bearish end to $1.50 in an optimistic scenario, with the average projection sitting around $0.90. The bullish case hinges primarily on two catalysts: the SEC approving a spot ADA ETF and sustained momentum from Cardano's inclusion in the US Strategic Crypto Reserve.
What is the ADA price prediction for 2027?
For 2027, forecasts vary significantly by methodology. Benzinga's base case sits in the $0.48-$0.57 range for a moderate scenario, while models factoring in ETF-driven institutional inflows and DeFi TVL expansion reach $1.20-$1.80. The key variable is Cardano's ability to grow its on-chain DeFi ecosystem.
What is the Cardano price prediction for 2030?
ADA's 2030 consensus range sits between $9.56 (bearish) and $12.72 (bullish), with a base case around $10.37. This range incorporates two expected Bitcoin halving cycles between now and 2030, projected DeFi market CAGR of approximately 46%, and Cardano's full upgrade roadmap completion.
Will ADA reach $10 by 2030?
Based on current analyst consensus, ADA reaching $10 by 2030 is within the plausible base case. The $10.37 average projection sits just above that threshold, supported by expected Bitcoin halving cycles, projected DeFi market growth, and Cardano's technical development.
Will Cardano (ADA) ever reach $100?
At current trajectory, ADA reaching $100 before 2040 is highly unlikely. That price level would imply a market capitalisation of roughly $4.5 trillion at full supply. Realistic 2040 forecasts sit in the $13.50-$25.50 range under base and optimistic scenarios.
Why was Cardano included in the US Strategic Crypto Reserve?
The Trump administration's March 2025 announcement included ADA alongside Bitcoin, Ethereum, Solana, and XRP in a designated US government strategic crypto reserve. The decision reflected ADA's top-10 market cap status, the active role of Charles Hoskinson in US crypto policy discussions, and Cardano's positioning as a peer-reviewed blockchain.
What is the MVRV ratio and what does it say about ADA?
MVRV compares ADA's current market capitalisation to its realized capitalisation. When MVRV falls below 1.0, the market prices ADA below what holders collectively paid, historically signalling a long-term accumulation opportunity. ADA's MVRV in early 2026 is in the undervalued range.
