
The crypto crash of October 2026 was unlike anything the market had seen before. On October 10, a single social media post triggered a chain reaction that liquidated $19.16 billion in positions, wiped out 1.6 million trader accounts, and sent Bitcoin plummeting from its all-time high of $122,574 to approximately $105,000 - all within hours. What followed wasn't a natural correction. It was a mechanical catastrophe driven by record leverage, a flawed stablecoin loop, and exchange infrastructure that couldn't withstand the pressure.
This is the forensic breakdown of what happened, why it happened, and what every crypto participant must understand before the next shock hits.
⚡ Key Takeaways
- $19.16 billion liquidated in under 24 hours - the largest single-day crypto wipeout on record, approximately 9. larger than any prior event
- Bitcoin fell ~14% from its all-time high above $122,000 - sliding to ~$105,000 within hours of the violent cascade phase
- Trump's 100% China tariff announcement was the macro catalyst that ignited an already over-leveraged market
- The USDe leverage loop on Binance amplified losses far beyond what the macro shock alone would have caused
- 1.6 million trader accounts were forcibly closed as auto-deleveraging (ADL) swept through the market, closing profitable positions alongside unprofitable ones
What Was the Crypto Crash of October 2026? The Full Context
To understand how this happened, it helps to start with what the market looked like in the weeks before October 10. Bitcoin was trading above $122,574 - a new all-time high - and the market was in a state of euphoria. Aggregate open interest across crypto had climbed to $217 billion, a record. Funding rates on ETH perpetual futures had surged from roughly 10% annualized to nearly 30% by October 6. The kindling was already dry. Data providers like Glassnode, CoinGlass, and Amberdata had been flagging dangerous overleverage for weeks. The crash wasn't a black swan - it was a powder keg that needed a single match.
Open interest refers to the total value of outstanding derivative contracts that haven't been settled. When it climbs to record levels, it means enormous leveraged exposure is sitting in the market waiting to unwind. Understanding how funding rates function in perpetual futures is critical here: when rates spike toward 30% annualized, it signals extreme bullish positioning - and the cost of maintaining that crowded trade becomes unsustainable.
The Pre-Crash Conditions - Record Leverage and Altcoin Overextension
The numbers were alarming. BTC open interest had grown 374% since the start of the year, while Solana's open interest expanded 205% over the same period. That $217 billion aggregate OI represented a record concentration of leveraged bets - and a significant portion sat on venues using unified cross-asset margin.
Unified cross-asset margin is a system where positions across multiple assets share a single collateral pool. It's capital-efficient in calm markets; under stress, it becomes catastrophically efficient at propagating losses, because one collapsing position can drain the margin buffer for entirely unrelated trades.
The long-side dominance was extreme. An estimated 87% of all open leveraged positions were longs - a dangerously one-sided market. Altcoins and memecoins showed overextended valuations; the memecoin sector alone held approximately $80 billion in market cap on October 10. Technical analysts monitoring BTC noted it was trading more than two standard deviations above its 20-day moving average - a historically rare condition that traders watching RSI and MACD divergences had visible reason to flag as overextension.
The warning signals were present - but markets can remain irrational for longer than most anticipate.
The Trigger - Trump's 100% China Tariff Announcement
At approximately 16:30 ET on October 10, President Trump posted on Truth Social announcing a 100% tariff on all Chinese imports, effective November 1, bringing total tariffs on China to 130%. Global equities sold off. But crypto - trading 24/7 without circuit breakers or automatic halts - absorbed the shock in a way equity markets simply couldn't.
📢 THE ANNOUNCEMENT
Trump's Truth Social post declared a 100% tariff on all Chinese imports, effective November 1 - bringing total tariffs on China to 130%. The announcement hit at 16:30 ET on October 10, as crypto markets were at full leverage extension.
The S&P 500 fell, then closed for the day. Crypto had no such mechanism. Market makers began widening bid-ask spreads preemptively as weekend settlement risk increased and liquidity thinned. Bitcoin started sliding from its intraday high of $122,574. What followed was not a gradual correction - it was a mechanical catastrophe that played out at algorithmic speed.
Timeline of the October 10 Liquidation Cascade - A Minute-by-Minute Breakdown
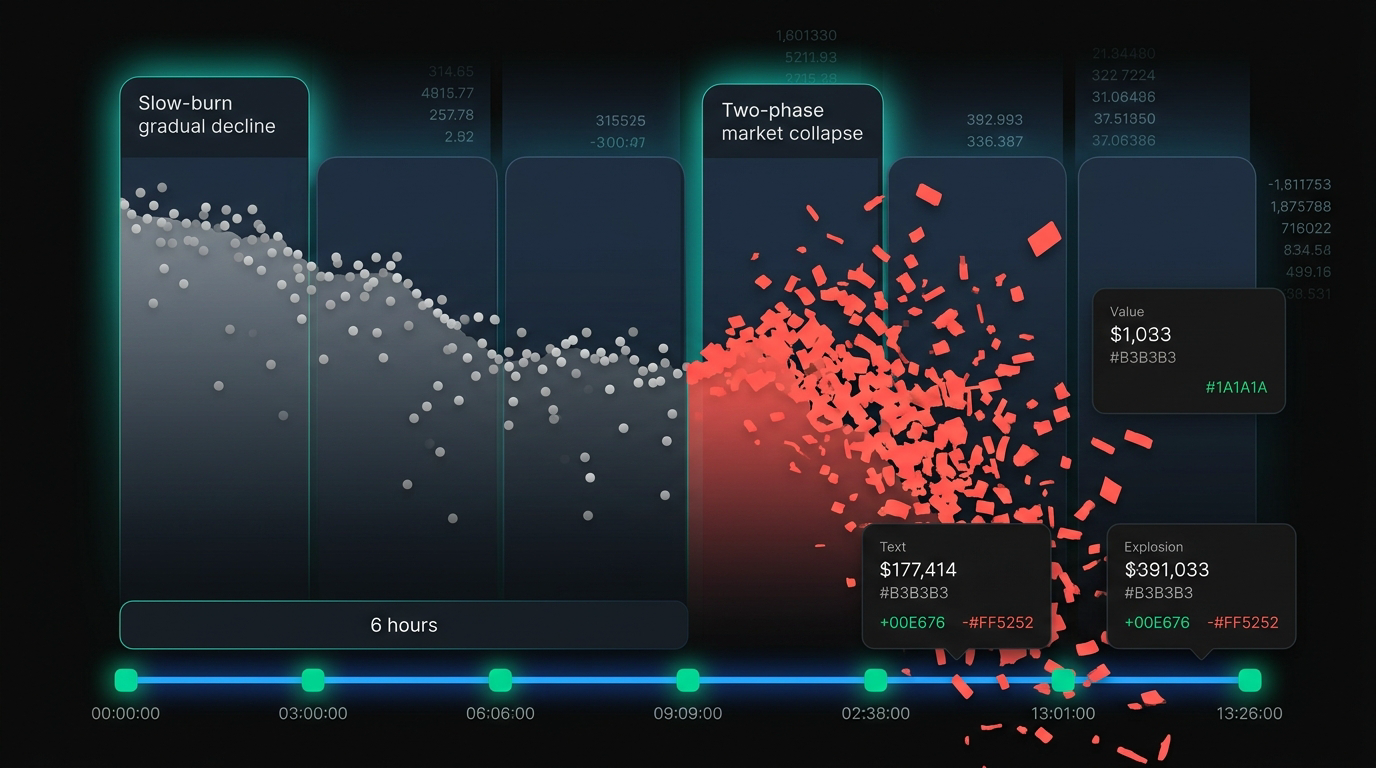
The crash unfolded in two distinct phases: a 6-hour gradual pressure phase, followed by a 40-minute violent cascade. According to Amberdata's chronological analysis, approximately 70% of the total damage occurred during those 40 minutes, at a liquidation rate 14.6. faster than the surrounding hours. Stage 1 established the conditions; Stage 2 executed the demolition.
OCTOBER 10 CRASH - EVENT TIMELINE
14:27 UTC
Large whale short positions reportedly established - on-chain investigators later identified $1.1B in pre-positioned short exposure
16:30 ET
Trump tariff announcement surfaces on Truth Social - 100% tariff on Chinese imports, effective November 1
14:27 - 20:50 UTC (Stage 1)
6-hour gradual sell-off. Prices decline slowly, liquidity providers begin retreating. Open interest remains at full extension - $146.67B powder keg
20:50 UTC - STAGE 2 BEGINS
Violent cascade phase starts. Liquidation rate reaches $10.39B/hr - 14.6. the prior rate. $6.93B liquidated in 40 minutes
21:15 UTC - PEAK DESTRUCTION
$3.21 billion liquidated in a single 60-second window. Bid-ask spreads widen 1,321. (0.02 → 26.43 bps). Order book depth collapses 98% ($103.64M → $0.17M)
21:18 - 21:51 UTC
Binance transfer system slowdown - cross-margin withdrawal corridors strained under volume surge
21:36 - 22:15 UTC
USDe depegs to ~$0.65 on Binance (not on other exchanges). Mass collateral revaluations trigger secondary liquidation wave
October 12
BTC recovers to $112K. Spot-only holders largely unaffected. Leveraged trader losses are permanent
Stage 1 - The Gradual Pressure (14:27-20:50 UTC)
At 14:27 UTC, large whale short positions were reportedly established. On-chain investigators later identified a wallet holding over 100,000 BTC and approximately $1.1 billion in short positions - though whether this constitutes coordinated pre-positioning or routine institutional hedging remains unverified and disputed. Trump's tariff announcement then created sustained selling pressure through the afternoon session.
Over the 6-hour window, prices fell gradually. Liquidity providers began retreating. Open interest remained at full extension throughout - the powder keg absorbing slow, sustained pressure. This gradual phase is routinely overlooked because Stage 2 overshadows it. But Stage 1 is where the cascade became inevitable.
Stage 2 - The Cascade: $3.21 Billion Liquidated in 60 Seconds (20:50-21:30 UTC)
At 20:50 UTC, the market structure gave way.
Within 40 minutes, $6.93 billion in positions were forcibly liquidated at a rate 14.6. the pre-cascade pace. The single most destructive minute arrived at 21:15 UTC, when $3.21 billion evaporated. BTC bid-ask spreads exploded from 0.02 to 26.43 basis points - a 1,321. expansion that made execution commercially impossible for most traders. Order book depth collapsed from $103.64 million to just $170,000, a 98%+ decline.
⚠ The Doom Loop - Stage 2 Mechanics
- Price Decline → Margin threshold breached for leveraged longs
- Forced Liquidation Orders → Hit an order book with 98% less depth
- Further Price Decline → Triggers more margin calls
- Market Makers Withdraw → Bid-ask spreads widen 1,321.
- ADL Activates → Profitable short positions forcibly closed
- Cascade Continues → Each cycle self-reinforces at algorithmic speed
Key figures: spreads 0.02 → 26.43 bps . order book depth $103.64M → $0.17M
Binance experienced two platform-specific incidents during the worst of it: a transfer system slowdown (21:18-21:51 UTC) and USDe/WBETH index price deviations (21:36-22:15 UTC). Hyperliquid, the on-chain perpetual DEX, liquidated over $10 billion in positions and triggered its first ADL event in more than two years. Of all positions liquidated, 87% were longs, confirming that pre-crash overextension on the long side drove the severity.
October 2026 vs. Historical Crypto Crashes - Comparison Table
October 2026 was not crypto's first crash - but by one critical measure, it was the worst. The $19.16 billion liquidated in a single day represents approximately 9. any prior single-day event in crypto history.
A critical distinction: FTX and Terra/Luna involved fraud and structural insolvency. October 2026 did not. The damage was mechanical - driven by leverage architecture and collateral design failures, not criminal activity.
How the USDe Leverage Loop Worked - The Hidden Mechanism Behind the Crash
Not all stablecoins are the same. USDe - issued by Ethena Labs as a delta-neutral synthetic dollar - is fundamentally different from USDT or USDC. Unlike USDT, which maintains its $1 peg through cash and cash-equivalent reserves, USDe holds its peg through funding-rate arbitrage strategies. In calm markets with positive funding rates, this earns significant yield. The problem: Binance promoted USDe at 12% APY and treated it as margin collateral equivalent to USDT.
📊 USDe vs USDT - What's the Difference?
USDe is NOT a traditional stablecoin. Unlike USDT, which aims to hold $1 through cash reserves, USDe maintains its peg through funding-rate arbitrage - making it susceptible to depeg during volatile markets when that arbitrage breaks down. On October 10, USDe fell to $0.65 specifically on Binance, triggering mass collateral revaluations that other exchanges - which hadn't adopted the same collateral treatment - largely avoided.
Think of USDe as a high-yield savings account that most traders were treating like a checking account - fine in calm markets, dangerous when volatility strikes. The real danger wasn't USDe itself. It was the loop it enabled.
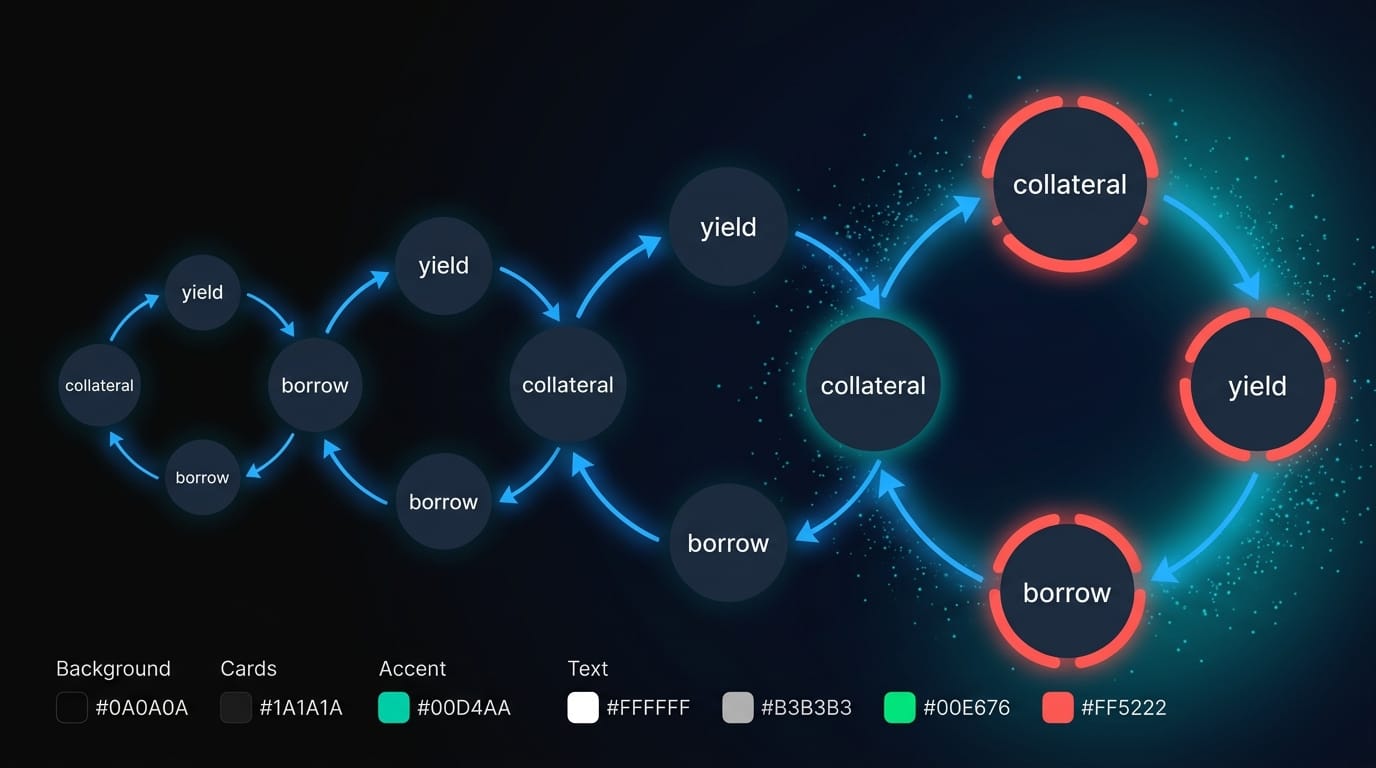
The Recursive Borrowing Mechanism - Step by Step
OKX CEO Star Xu was among the first to articulate the loop publicly. Here's how it functioned - and how APYs reportedly escalated from 12% to 70%+ through repeated iterations:
- User converts USDT/USDC to USDe to earn the promoted 12% APY
- User deposits USDe as collateral on Binance, where it's treated as standard stablecoin collateral
- User borrows USDT against that USDe collateral
- User converts the borrowed USDT back into USDe - earning yield again
- Repeat - each iteration adds leverage while appearing to earn stable yield
When volatility hit on October 10, USDe briefly depegged to approximately $0.65 on Binance - a depeg that did not occur on other venues. That collateral revaluation fed directly into the Stage 2 cascade around 21:36 UTC, triggering mass liquidations across thousands of accounts holding USDe-backed margin positions.
Binance vs. OKX - Who Really Caused the October 2026 Crypto Crash?
This became crypto's most public post-crash controversy - comparable in intensity to post-FTX blame allocation, but between two of the world's largest exchanges rather than involving fraud. The debate crystallized around three competing narratives.
FORMER CFTC REGULATOR - SALMAN BANAEI
"Whether you love or hate crypto, there should be an investigation by regulators into Oct 10, 2025."
OKX CEO Star Xu's Case - Irresponsible Marketing and Leverage Loops
Xu's argument was direct: Binance launched a 12% APY campaign on USDe, treated it as stablecoin-equivalent collateral in its margin system, and enabled the recursive leverage loop described above. When volatility hit, USDe depegged specifically on Binance - not on other exchanges. Xu stated publicly that many in the industry consider October 10 more damaging than the FTX collapse.
CZ responded on social media questioning the relationship between Dragonfly Capital and OKX, implying competitive motivation behind Xu's criticism. Xu clarified that Dragonfly was never an OKX investor - a factual correction worth noting for accuracy.
Binance's Response - Macro Factors, Platform Incidents, and $328M Compensation
Binance published a detailed official report attributing the crash to macroeconomic shock, record leverage, and vanishing liquidity - not internal system failures. Richard Teng, Binance CEO, told a crypto conference that blame lay entirely with Trump's tariff policy as the primary cause.
Binance's core argument: 75% of all liquidations had already occurred before either platform incident triggered. The exchange paid over $328 million in user compensation - acknowledging real user harm while disputing systemic responsibility. Binance's insurance fund absorbed approximately $188 million during the event.
The Three Theories - Macro Shock vs. Single Exchange vs. Coordinated Attack
Industry has not reached consensus. Three distinct explanations have emerged, and none has been definitively proven:
The coordinated attack theory should be treated as a forensic hypothesis backed by on-chain data - not established fact. Regardless of which theory proves correct, October 10 exposed structural vulnerabilities that every crypto participant must understand.
Exchange Infrastructure Red Flags - What October 10 Exposed
The crash didn't just reveal overleveraged traders. It exposed three systemic design flaws in how major exchanges handle stress events.
⚠ 5 Exchange Red Flags Every Crypto Trader Should Check
- Oracle price source → Single-venue or multi-venue averaged? (Single-venue = localized depeg risk)
- ADL policy → Published, transparent, and publicly available?
- Insurance fund size → Relative to total platform open interest (Binance fund absorbed ~$188M; the crash demanded multiples of that)
- Leverage caps on synthetic collateral → Does the exchange allow USDe-grade assets as stablecoin-equivalent margin?
- Historical compensation record → Binance's $328M is the current industry benchmark
First: unified/cross-asset margin ties an entire portfolio to its weakest position. A depegging stablecoin doesn't just affect stablecoin trades - it can drain margin from BTC and ETH positions simultaneously. Second: single-venue internal oracles pricing collateral from local spot prices created the Binance-specific USDe crisis. Third: auto-deleveraging (ADL) - the mechanism that, when insurance funds are exhausted, force-closes profitable positions to fund insolvent ones.
Auto-Deleveraging (ADL) - When Your Winning Trade Gets Forcibly Closed
ADL is arguably the least understood mechanism in crypto derivatives - and October 10 turned it into one of the most talked about.
When a leveraged account goes deeply negative and the exchange's insurance fund can't absorb the deficit, the exchange force-closes profitable positions on the opposite side to cover the loss. A trader running a correct short - generating actual profits from the crash - can have their position involuntarily closed, not because the trade was wrong, but because the exchange needed the capital.
⚠ ADL Mechanics - How a Winning Trade Gets Closed
- Step 1 - Standard Liquidation: Insolvent account margin falls below maintenance threshold → standard liquidation triggered
- Step 2 - Insurance Fund Exhausted: Losses exceed what the fund can absorb → insurance depleted
- Step 3 - ADL Triggers: Exchange force-closes the most profitable opposing positions → "ADL turns a hedged portfolio into a naked one at the worst possible moment"
Hyperliquid - a fully on-chain perpetual DEX - triggered its first ADL event in over two years during the October 10 cascade. That's the key lesson: ADL isn't just a centralized exchange risk. Decentralized systems with insurance fund mechanics face the same structural constraint. For guidance on how to check an exchange's ADL policy before trading, see the exchange evaluation checklist above.
How to Protect Your Portfolio - Risk Management Strategies for the Next Crypto Crash
October 2026 was a brutal stress test - but it came with a manual for surviving the next one. Open interest and funding rates function as macro leading indicators - analogous to RSI on a price chart. Monitoring them can signal elevated risk well before events like October 10 materialize.
⚡ Core Risk Principles - What Would Have Saved You on October 10
- Cap leverage in high-OI environments - when aggregate OI reaches record levels, crash amplification is structural, not speculative
- Use stop-losses that account for potential gap-down moves, not just normal volatility ranges
- Diversify capital across multiple exchanges to reduce ADL risk concentration
- Monitor funding rates and open interest as early-warning crash indicators - not just price action
If you're currently navigating the post-crash market, the strategies covered in how to navigate crypto in 2026 apply directly to the environment October 10 created - lower OI, normalized funding, and thinner liquidity across major venues.
Popular Trading Strategies - How Each Fared on October 10, 2026
Technical traders using MACD divergence and RSI overbought signals had visible warnings of overextension in early October - but timing the exact exit remained difficult, as it always does near cycle peaks. A swing trader using 3. leverage with a 10% stop would have survived Stage 1 but faced gap-down risk in Stage 2 if their stop levels coincided with key support zones breached in the cascade.
For investors assessing which assets held up best and where recovery potential exists, our analysis of the best crypto to buy during a crash covers the post-October 10 landscape in detail.

What Changed After October 2026 - Market Structure Shifts and Long-Term Impact
The market's immediate response was significant. BTC declined approximately 30% from its ATH through December. Bitcoin ETFs experienced substantial outflows as institutional risk appetite contracted. Total open interest fell over 40% from October highs as the deleveraging cycle ran its course, confirmed by CoinDesk's post-event data. Funding rates normalized - back to single-digit annualized territory across major pairs.
The broader market impact continues: as covered in our analysis of why crypto is crashing in 2026, the October 10 event was the inflection point from which the market never fully recovered through year-end.
What has NOT changed: the fundamental incentive structure that enables leveraged products to exist. As long as traders are willing to pay for leverage, someone will offer it. The volume of excess leverage was reduced; the appetite for it was not.
Several major exchanges tightened leverage caps on selected pairs and raised collateral haircuts on fragile assets. Multiple venues began transitioning toward multi-venue oracle pricing. Regulatory discussions around circuit breakers, transparent liquidation protocols, and enhanced ADL disclosure requirements are ongoing. The conversations are serious - but structural reform in crypto moves slowly.
Conclusion - What October 2026 Means for Crypto's Future
October 2026 may prove to be crypto's structural inflection point - the event that compels the industry to build the safety rails it has long resisted. Former CFTC regulator Salman Banaei's comparison to the May 6, 2010 Flash Crash is apt: equities markets built circuit breakers and central counterparty safeguards after that event. Crypto now has the same empirical grounds and the same opportunity.
The crash demonstrated that on-chain verifiability and transparent mechanics aren't just philosophical preferences - they're structural protections. Platforms built on trustless, auditable infrastructure represent the direction the industry must move: away from opaque collateral systems and hidden leverage amplifiers, toward systems that can be stress-tested in real time.
Crypto trading involves substantial risk of loss. Leveraged derivatives trading is not suitable for all users. This article is for informational purposes only and does not constitute financial advice. Always assess your risk tolerance before trading.
Last updated: March 2026.
Frequently Asked Questions
What was the crypto crash of October 2026?
The crypto crash of October 2026 - known as the "10/10 crash" - was the largest single-day liquidation event in crypto history, occurring on October 10. In under 24 hours, $19.16 billion in leveraged positions were forcibly closed, 1.6 million trader accounts were wiped out, and Bitcoin fell from its all-time high of $122,574 to approximately $105,000. The immediate trigger was Trump's 100% China tariff announcement, but the catastrophic scale was driven by record leverage, a recursive USDe borrowing loop on Binance, and exchange infrastructure that failed under the pressure of algorithmic-speed forced selling.
Why did crypto crash on October 10, 2026?
Multiple factors converged simultaneously. The macro trigger was Trump's Truth Social post announcing 100% tariffs on Chinese imports, which hit global risk assets. Crypto reacted more violently than equities for three structural reasons: it trades 24/7 with no circuit breakers, aggregate open interest had reached a record $217 billion with 87% of positions on the long side, and a recursive USDe borrowing loop on Binance had created hidden leverage of up to 10. for many participants. When the macro shock hit those pre-existing conditions, a mechanical cascade played out at algorithmic speed - not a discretionary sell-off.
How much was liquidated during the October 2026 crash?
According to CoinGlass data, over $19 billion in leveraged positions were liquidated within 24 hours - approximately 9. larger than any prior single-day event in crypto history. Roughly 87% of liquidated positions were longs. The true figure is likely higher: CoinGlass noted that some exchanges report liquidations with delays or caps (Binance logs only one per second), meaning $19B is a conservative floor. Derivatives trading volume hit $748.3 billion on October 10 alone - nearly three times the 2025 annual daily average of $264.5 billion.
What is USDe and how did it contribute to the crash?
USDe is a synthetic dollar issued by Ethena Labs that maintains its $1 peg through funding-rate arbitrage - not cash reserves like USDT. Binance promoted USDe at 12% APY and treated it as standard stablecoin margin collateral, enabling traders to create recursive borrowing loops where USDe exposure was amplified up to 10.. When volatility hit on October 10, USDe briefly depegged to approximately $0.65 specifically on Binance - a depeg that did not occur on other exchanges. This triggered mass collateral revaluation and a secondary wave of liquidations that amplified the macro-driven cascade far beyond its initial scope.
What is auto-deleveraging (ADL), and how did it hurt traders?
ADL is a mechanism used when a leveraged account's losses exceed what the exchange's insurance fund can absorb. Instead of socializing the loss, the exchange force-closes profitable positions on the opposite side to fund the deficit. On October 10, traders who had correctly positioned short - and were actively profiting from the crash - had those positions involuntarily closed, not because their trade was wrong, but because the exchange needed the capital. Hyperliquid, a fully on-chain perpetual DEX, triggered its first ADL event in over two years during the cascade, demonstrating that even decentralized systems face this same structural constraint.
What structural changes did exchanges make after the crash?
Several major venues tightened leverage caps on selected pairs and raised collateral haircuts on synthetic assets, effectively restricting USDe-grade instruments from being used as standard stablecoin collateral. Multiple exchanges began transitioning toward multi-venue oracle pricing - addressing the single-venue oracle vulnerability that contributed to Binance's localized USDe depeg. Binance paid over $328 million in user compensation. Regulatory discussions around circuit breakers, transparent liquidation protocols, and enhanced ADL disclosure are ongoing. Former CFTC regulator Salman Banaei has publicly called for a formal investigation, comparing the event to the May 2010 Flash Crash.
How do I protect my portfolio from a crash like October 2026?
Five specific practices would have materially reduced exposure on October 10. First, limit leverage - positions above 10. were wiped before stops could execute during Stage 2. Second, use stop-losses calibrated for gap-down scenarios, not typical volatility. Third, diversify capital across multiple exchanges - ADL risk is exchange-specific, and concentration on one venue creates single-point-of-failure exposure. Fourth, monitor open interest and funding rates as early-warning indicators: when aggregate OI reaches record levels and funding spikes toward 30% annualized, structural crash amplification risk is elevated. Fifth, evaluate exchange collateral policies - synthetic assets treated as stablecoin collateral represent a concrete, identifiable risk category that October 10 permanently documented.
