
Few chart patterns have held up as consistently as the cup and handle across three-and-a-half decades of market history. First codified by William O'Neil in his 1988 work How to Make Money in Stocks, this bullish continuation pattern has since proven equally powerful in crypto markets - from Bitcoin's multi-year breakout in 2024 to intraday setups on 4H altcoin charts. This guide covers everything: how to recognize a valid cup and handle, how to separate real setups from lookalikes, exactly how to enter and exit, and which trading strategies suit it best across different timeframes and asset classes. If you're still building your foundation in chart reading, start with our beginner's guide to reading crypto charts before diving into pattern-specific setups.
⚡ Key Takeaways
- The cup and handle is a bullish continuation pattern - it signals that a prior uptrend is likely to resume after a period of consolidation
- The entry trigger is a breakout above the handle's descending resistance trendline, not at the cup rim
- A volume surge at the breakout point is the primary confirmation signal - low-volume breakouts fail far more often
- Stop-loss goes below the handle's lowest point; if price drops through that level, the pattern is invalidated
- Profit target is calculated by projecting the cup's depth upward from the breakout point (the "measured move")
- The pattern works across stocks, crypto, and forex on any timeframe from 15-minute intraday charts to weekly macro setups
What Is the Cup and Handle Pattern?
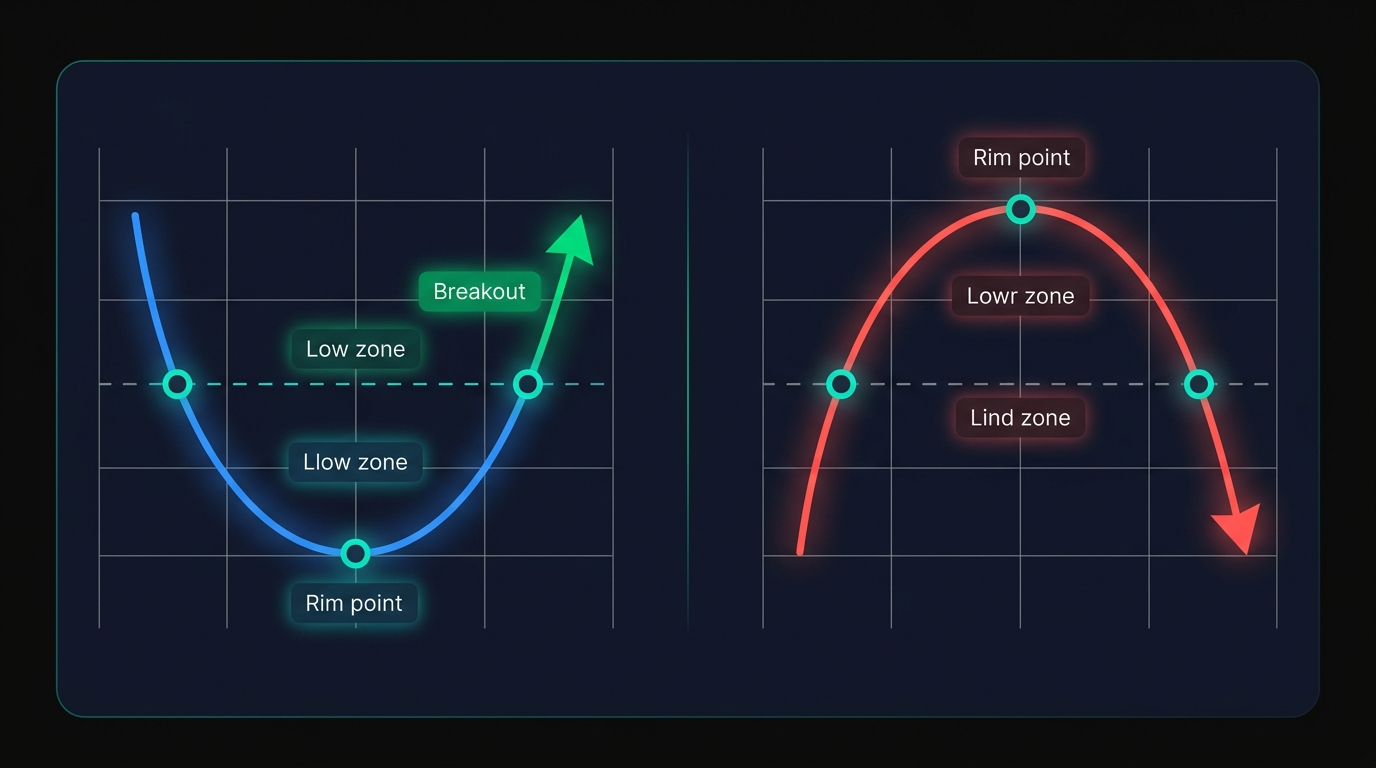
The cup and handle is a bullish continuation chart pattern that forms when a trending asset pauses, consolidates into a rounded U-shaped trough (the cup), undergoes a brief secondary pullback (the handle), and then breaks out above resistance to continue its prior uptrend.
William O'Neil introduced the pattern through his 1988 book How to Make Money in Stocks and refined it through years of work with traditional equities. His core insight was that this specific consolidation sequence - gradual accumulation, a test of resistance, a final shakeout of weak holders, and then a decisive breakout - repeated itself consistently enough across market cycles to be tradeable. What started as a stock market concept has since proven valid across virtually every liquid market, including crypto.
The psychology behind the pattern is as important as its shape. During the cup, sellers exhaust themselves and buyers gradually accumulate the asset at lower prices. By the time price returns to the prior high, there's a fresh layer of resistance - traders who bought at the top are relieved to break even and sell, while new buyers hesitate. This creates the handle: a brief, controlled consolidation. When the remaining sellers finally run out of conviction, buyers take over and push through resistance into new high territory.
The Cup - Anatomy and Requirements
The cup is the larger, slower-forming component of the pattern. Getting its shape and depth right is the difference between a valid setup and a misleading lookalike.
A valid cup has five characteristics:
- Prior uptrend - the cup must form after a clear upward move. There's nothing to continue without an existing trend.
- U-shaped rounded bottom - the trough should curve gradually, reflecting slow accumulation. A sharp V-bottom suggests a reactive panic-buying bounce, not the organic re-accumulation that makes the pattern reliable.
- Depth of 30-50% - the cup ideally retraces 30-50% of the preceding uptrend. Use the Fibonacci retracement tool to measure: the 38.2% and 50% levels are the most common zones where the cup bottom forms.
- Symmetrical rims - the left rim (where the prior uptrend peaked) and the right rim (where price recovers to) should sit at approximately the same price level. This shared level becomes the resistance zone.
- Declining then recovering volume - volume typically falls during the cup's downward phase and begins picking up as price climbs the right side. That volume pickup signals re-accumulation in progress.
The Handle - Anatomy and Requirements
While the cup measures in weeks or months, the handle forms quickly - typically within one to four weeks. Think of it as the market catching its breath before the final push.
A valid handle has five requirements:
- Shallower than the cup - the handle should retrace only 10-15% from the rim. If it retraces more than one-third of the cup's prior advance, that's a warning sign of weak buyer conviction.
- Forms in the upper half of the cup - the handle's price range must stay above the cup's midpoint. A handle that drifts into the lower half of the cup invalidates the setup entirely.
- Shorter duration than the cup - the handle forms faster. On daily charts, one to four weeks is typical. Handle durations exceeding the cup's own formation time are suspect.
- Slight downward drift - price should slope gently lower, forming a descending resistance trendline across the handle's highs. This line is your eventual entry trigger.
- Shrinking volume - volume should contract during handle formation, signaling the final elimination of weak hands before the breakout.
⚠ Deep Handle Warning
- A handle that drops below the cup's midpoint → suggests sellers still have meaningful control; this reduces breakout probability and should be treated as an invalidating signal
How to Identify a Valid Cup and Handle Pattern
Knowing what the pattern looks like theoretically is one thing. Running a systematic check on a live chart is another. Use this identification checklist before considering any cup and handle setup:
For implementation, charting platforms like TradingView allow you to overlay a 50-period moving average on the volume bars - this makes it easy to spot whether the breakout candle's volume meaningfully exceeds recent averages. Combining that with an RSI reading below 70 at entry reduces the risk of chasing into an already overbought breakout.
The most commonly missed criteria in practice? Rim symmetry and volume confirmation. Traders get excited about the shape and forget to check whether the right rim actually reaches the left rim's level, or whether the breakout is happening on genuine buying pressure versus a thin-market spike.
Common Lookalikes and False Signals
⚠ False Signal Red Flags - Walk Away If You See These
- Double Top masquerading as a cup → two sharp peaks with a flat bottom between them; lacks the gradual rounding and volume decline of a real cup
- V-shaped recovery → looks like a completed cup but formed too fast; reactive bounce, not accumulation
- Handle dipping into the cup's lower half → signals sellers are regaining control; don't take the trade
- Low-volume breakout → if the breakout candle doesn't show meaningfully above-average volume, treat it as suspect until confirmation follows
- Broad market in a downtrend → even a textbook-perfect cup and handle has a significantly lower completion rate when Bitcoin or broader market structure is bearish
O'Neil himself noted that breakout success rates are dramatically higher when the general market is in a confirmed uptrend. This isn't a minor footnote - it's arguably the most important filter of all. For a clear view of current market conditions before executing any breakout trade, see our 2026 crypto market navigation guide.
The Inverted (Bearish) Cup and Handle Pattern
Everything that makes the cup and handle powerful as a bullish continuation setup has a direct mirror image for bearish setups.
The inverted cup and handle forms during a downtrend. Price rallies into an inverted U-shaped peak (the inverted cup), then consolidates in a brief upward drift (the inverted handle), before breaking down below support to continue the downtrend. The structure is identical to the bullish version - just flipped upside down.
Here's how the mechanics map across:
- Inverted cup top - the resistance level the rally failed to overcome
- Inverted handle - a brief, upward-drifting consolidation after the failed rally
- Breakdown trigger - price breaking below the handle's ascending support trendline
- Entry - short position opened below the support level on the breakdown
- Stop-loss - above the handle's highest point
- Target - depth of the inverted cup projected downward from the breakdown point, using the same measured move methodology as the bullish version
Ethereum's weekly chart has produced textbook inverted cup and handle formations during cyclical bear markets - a useful reference for traders who want to see the pattern in action on a liquid asset. One important caveat for crypto traders: shorting mechanics differ depending on your setup. On spot markets, you need to hold the asset to sell it. On derivatives markets - perpetual futures, for example - you can open short positions directly. Understanding which mechanism you're using matters for execution, not just pattern recognition.
How to Trade the Cup and Handle Pattern - Step-by-Step
Knowing the pattern exists is half the job - executing it with discipline is the other half. Trading the cup and handle comes down to three decisions: when to enter, where to set the stop, and where to take profits. Here's the structured sequence:
- Confirm the prior uptrend - No trend to continue = no valid pattern. Look for a clear sequence of higher highs and higher lows before the cup's left rim forms.
- Identify the cup - Locate the U-shaped trough with two rim points at approximately the same price level. Verify the depth falls in the 30-50% zone using Fibonacci retracement.
- Wait for the handle to form - After price retests the rim, don't jump in. Wait for the controlled pullback and confirm it stays in the upper half of the cup.
- Draw the handle's resistance trendline - Connect the handle's highs with a descending trendline. This is your breakout trigger - the line price must close above to confirm the setup.
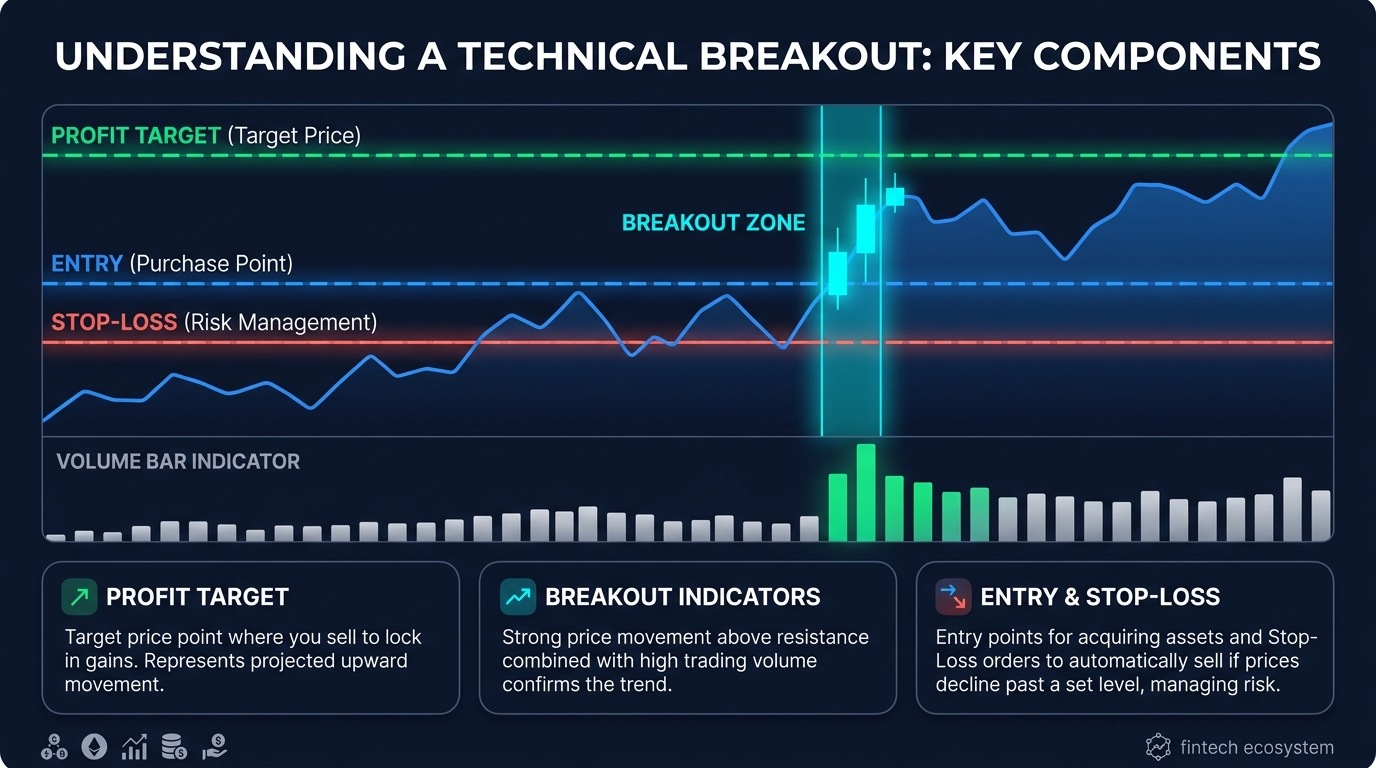
- Set your entry order - Either place a stop-buy order just above the trendline (aggressive) or wait for a full candle close above it (conservative). See below for the full breakdown of both approaches.
- Confirm with volume and RSI - A valid breakout should show above-average volume on the breakout candle. RSI ideally supports momentum without being severely overbought - a reading above 50 but below 70 at entry is the sweet spot.
Entry Methods - Aggressive vs. Conservative
There's a third approach worth knowing: the backtest entry. Price breaks out, pulls back to test the former resistance level (now acting as support), holds, and then continues higher. This entry gets you a lower average price than chasing the initial breakout, with the added confirmation that the old resistance has flipped to support. It's slower, it requires patience, but the risk-reward profile on the backtest entry is often the most favorable of the three.
Stop-Loss Placement and Profit Targets
Stop-loss placement is straightforward: below the handle's lowest point. The logic is clean - if price falls through the handle's low, the pattern has failed. The buyers who were supposed to absorb selling pressure clearly weren't strong enough, and holding the trade past that point is hope-based trading, not technical trading.
Profit target calculation uses the measured move method:
That same cup depth - 25% - is your profit target measured from the breakout, not from the cup's bottom. This is a critical distinction many traders get wrong the first time.
For volatile crypto assets like Bitcoin and Ethereum, consider using a trailing stop once the trade is 50% toward the target. Crypto trends can extend well beyond the measured move, and a trailing stop captures additional upside without requiring a specific exit prediction. Solid crypto risk management principles apply here: never adjust a stop downward mid-trade, and keep position sizes consistent regardless of how confident you feel about the setup.
Cup and Handle Pattern Across Different Markets and Timeframes
The cup and handle isn't market-specific - it's a pattern of crowd psychology that repeats wherever buyers and sellers interact over time. That said, each market has characteristics that affect how the pattern forms and how reliable it is.
Stocks remain the pattern's natural home. O'Neil identified it in equities, and lower intraday volatility means cup formations are cleaner - the U-shape is more obvious and rims tend to align more precisely.
Crypto has produced some of the most discussed cup and handle formations in recent history. Bitcoin's weekly chart from 2021 to 2024 is the most cited: a multi-year cup formed across multiple market cycles, with the handle developing around the prior all-time high and resolving with a decisive breakout into new ATH territory. Higher crypto volatility means cups can be deeper - 30-60%+ retracements are common - and they can form faster than their stock market equivalents.
Forex presents the biggest challenge: volume data isn't centralized, so the volume confirmation that makes the pattern reliable in equities and crypto is much harder to obtain. Forex traders using the cup and handle typically rely on price structure alone, which reduces edge compared to the other markets.
Popular Trading Strategies Using the Cup and Handle
The same cup and handle pattern tells a different story depending on how you trade. A setup that's ideal for a swing trader might be irrelevant to a scalper, and vice versa.
Swing Trading the Cup and Handle
Swing trading is the most natural fit for this pattern. The daily chart is where cup and handle setups are clearest - formations take long enough to be meaningful but resolve within days to weeks, which matches the swing trader's typical hold window.
The process: spot the setup on the weekly chart to confirm the macro trend, then drop to the daily for entry timing. Enter on a daily close above the handle's resistance trendline. Check RSI - ideally it's above 50 (confirming momentum) but below 70 (not yet overbought). Set the stop below the handle's daily low. Once the trade is halfway to the measured move target, consider moving the stop to breakeven and switching to a trailing stop to let the position run.
If you're comparing the cup and handle to similar continuation setups, the same structural logic applies to the falling wedge pattern - both require volume confirmation at breakout and both reward patient entries over reactive ones.
Day Trading and Scalping the Intraday Cup
On intraday charts - particularly the 4H and 1H - cups form within hours or days rather than weeks. The pattern is real, but the noise-to-signal ratio is higher. False breakouts on intraday setups are significantly more common than on daily setups.
For day trading the pattern, MACD provides a useful secondary filter: a MACD line crossover above the signal line at the time of the handle breakout confirms that momentum is genuinely shifting. Volume confirmation remains essential - thin-volume intraday breakouts are frequent fakes in crypto markets. Tighter stops are required, and profit targets should be scaled down proportionally to the smaller pattern size.
Position Trading - The Multi-Month Cup
Position traders use weekly and even monthly charts, where cup formations can span from several months to multiple years. Bitcoin's 2021-2024 weekly chart formation is the most prominent recent example: a three-year cup completed with a handle forming around the prior cycle's all-time high. The 50-week and 200-week moving averages serve as macro trend filters - a breakout that happens while price is above both moving averages is structurally stronger than one occurring below them.
Position trading requires patience and tolerance for drawdown. Macro events - regulatory shifts, Fed policy changes, market cycle transitions - are the primary risk factor for setups that take months to develop. To understand what's currently driving crypto market conditions, see our guide on why crypto markets move.
Limitations and Red Flags of the Cup and Handle Pattern
No chart pattern is infallible - the cup and handle included. Being honest about where the pattern breaks down is as important as knowing where it works.
⚠ Red Flags - Walk Away If You See These
- V-shaped cup bottom → a sharp bounce signals reactive buying, not the patient accumulation that makes the pattern reliable
- Handle drops below the cup's midpoint → sellers are stronger than buyers; the setup is compromised
- Breakout on below-average volume → high probability of reversing; wait for confirmation before committing
- Broad market in a confirmed downtrend → bullish breakouts have materially lower success rates in bearish macro environments
- Illiquid or small-cap assets → volume metrics are unreliable on thinly traded assets, making confirmation impossible to verify
- Handle duration exceeds the cup → an unusually long handle suggests sellers are still engaged and buyers haven't established control
Beyond specific red flags, there are structural limitations worth acknowledging. The pattern takes time - a daily-chart cup might take two to six months to complete. In crypto markets specifically, volume data is fragmented across hundreds of exchanges, making the volume confirmation that makes the pattern reliable in equities harder to trust. And macro shocks can invalidate any setup instantly - regulatory announcements, exchange failures, and broader liquidity events have broken technically valid setups mid-formation with no warning.
The antidote to pattern risk isn't better pattern recognition - it's disciplined risk management regardless of setup quality. RSI, MACD, and Bollinger Bands serve as confirmation layers, and keeping position sizes consistent across trades prevents any single failed pattern from doing significant damage. For the full framework, see our complete crypto risk management guide.
Cup and Handle vs. Other Chart Patterns - Quick Comparison
Every pattern in this table shares the same execution mechanic at the breakout: price breaks through a defined resistance level, ideally confirmed by elevated volume. What differs is the setup structure and the trend context it requires.
Conclusion
More than 35 years after William O'Neil introduced it, the cup and handle continues to produce consistent, high-probability setups across markets that didn't even exist when he wrote How to Make Money in Stocks. Bitcoin's multi-year weekly chart formation is the most striking recent validation - a pattern originally designed around NYSE equities played out in near-textbook fashion on a 24/7 decentralized market. That durability says something important about the underlying crowd psychology the pattern captures.
TRADE THE RIGHT VERSION OF THIS PATTERN FOR YOUR STYLE
For Beginners
Start with daily chart setups only - weekly and intraday add complexity before the fundamentals are solid. Require both volume confirmation and RSI below 70 before entering. Paper trade at least 10 setups before risking real capital; watch how many complete and how many fail.
For Swing Traders
The daily chart is your primary execution timeframe; use weekly to confirm macro context. Favor conservative entries (candle close above handle resistance) over aggressive stop-buy orders. Define stop and target before entering - never adjust the stop downward mid-trade.
For Position Traders
Weekly charts only; expect formation times measured in months. Use 50-week and 200-week moving averages as macro trend filters. Size positions to survive the inevitable volatility during the formation period - macro events are your primary risk.
The cup and handle is a probability framework, not a prediction. Even technically perfect setups fail when macro conditions shift or when a low-volume fake breakout triggers stops before the real move develops. The pattern's edge comes from the consistent risk-reward profile it offers - a well-defined stop below the handle, a measurable target via cup depth projection, and a historically reliable breakout signal when volume confirms.
The pattern does the geometry. Risk management does the rest. On platforms built around self-custody and on-chain verifiability, that transparency principle extends to execution: every entry, stop, and target should be calculable and defensible before you click buy.
Last updated: March 2026.
Crypto trading involves substantial risk of loss and is not suitable for all participants. Leveraged trading amplifies both gains and losses. This article is for educational purposes only and does not constitute financial advice.
Frequently Asked Questions
What is a cup and handle pattern?
The cup and handle is a bullish continuation chart pattern that forms when a trending asset pauses, consolidates into a rounded U-shaped trough (the cup), then undergoes a brief secondary pullback (the handle), before breaking out above resistance to resume the prior uptrend. First described by William O'Neil in How to Make Money in Stocks (1988), the pattern has since proven applicable across stocks, crypto, and forex. The entry trigger is a breakout above the handle's descending resistance trendline, confirmed by elevated trading volume.
Where do you place the stop-loss in a cup and handle trade?
The stop-loss belongs below the handle's lowest point. If price falls through the handle's low after the breakout, the pattern is invalidated - the buyers who were supposed to hold the support zone clearly weren't strong enough. There's no technical argument for staying in the trade below that level. Set the stop just below the handle's lowest candle, accounting for a small buffer against brief wicks. Once the trade reaches 50% of the measured move target, move the stop to breakeven.
How do you calculate the profit target for a cup and handle?
The profit target uses the measured move method: calculate the cup depth as a percentage by dividing the distance from the cup rim to the cup bottom by the rim price. Then apply that same percentage upward from the breakout point. For example - cup rim $100, cup bottom $75, cup depth 25%, breakout at $101 - the target is $101 . 1.25 = $126.25. This gives you a data-driven exit level derived from the pattern's own geometry rather than a subjective price.
Can the cup and handle pattern fail?
Yes - any chart pattern can fail, and the cup and handle is no exception. The most common failure scenarios are: a low-volume breakout that quickly reverses, a bearish broad market overwhelming the individual setup, a macro event (regulatory news, exchange failures, liquidity crises) disrupting formation mid-development, or a handle that's too deep signaling sellers weren't fully exhausted. Success rates improve dramatically when the broader market is in a confirmed uptrend and volume confirms the breakout decisively.
What timeframes work best for the cup and handle pattern?
Daily and weekly charts produce the most reliable cup and handle setups. On daily charts, formations take weeks to months and have fewer noise-driven false signals. Weekly charts are the domain of position traders - Bitcoin's 2021-2024 multi-year cup is the most prominent example. Intraday charts (4H, 1H, 15-min) do produce tradeable patterns, but false breakout frequency increases significantly as timeframe decreases. Always check the higher timeframe trend direction before executing on a lower timeframe setup.
What is an inverted cup and handle pattern?
The inverted cup and handle is the bearish mirror of the standard bullish pattern. It forms during a downtrend: price rallies into an inverted U-shaped peak (the inverted cup), then consolidates in a brief upward drift (the handle), before breaking down below support to continue the downtrend. Entry is a short position below the handle's support trendline. Stop-loss sits above the handle's highest point. Target = inverted cup depth projected downward from the breakdown point, using the same measured move formula.
How is the cup and handle different from a bull flag?
Both are bullish continuation patterns, but they form under different conditions. The bull flag forms after a sharp, nearly vertical rally - a tight downward channel (the "flag") then develops before continuation. Bull flags form quickly, typically over days. The cup and handle, by contrast, forms a broad, rounded base over weeks to months and doesn't require a preceding sharp pole. The cup's gradual consolidation reflects deeper market participation and accumulation, while the bull flag reflects a brief pause in a fast-moving trend.
