
Any serious DOT price prediction for 2026 has to start with one uncomfortable truth: the market is sending mixed signals. Polkadot's native token is trading around $1.39 as of late March 2026 - down sharply from prior cycle highs - with the Fear & Greed Index sitting at an extreme fear reading of 11. Yet technical models still show a near-term resistance target of $1.83, and long-term forecasts from some analysts run into the double digits by the decade's end.
This analysis breaks down what the charts, on-chain fundamentals, and analyst models actually show - across the 2026 near-term window and through the 2027-2030 horizon. No narratives. Just the data, the methodology behind it, and what it means for different types of DOT holders.
⚡ Key Takeaways
- Current DOT price: ~$1.39 (as of March 25, 2026)
- 2026 forecast range: $1.20 (bear case, CoinCodex model) to $1.83 (near-term resistance, MEXC analysis)
- Long-term bull case: $31+ by 2029 (Benzinga); long-term bear case: $0.63 by 2030 (CoinCodex)
- Current sentiment: Extreme Fear (Fear & Greed Index: 11); RSI: ~43 (neutral zone)
- Risk disclaimer: Crypto trading carries substantial risk of loss. Nothing here constitutes financial advice.
Understanding what makes DOT tick - its architecture, tokenomics, and competitive position - is the foundation for interpreting any of these numbers meaningfully.
What Is Polkadot (DOT)? Fundamentals Behind the Price
Polkadot isn't just another Layer 1 blockchain competing for smart contract deployments. Its design solves a different problem: getting separate blockchains to communicate and share security without sacrificing their individual specialization. Think of parachains as specialized lanes on a highway - each optimized for a particular use case (DeFi, gaming, identity, storage) but all connected to one central relay chain that coordinates security and cross-chain messaging.
That architecture sets Polkadot apart from Ethereum, Solana, and most other networks. It was built for interoperability from the ground up, not as an afterthought. Gavin Wood - one of Ethereum's original co-founders - created Polkadot alongside Robert Habermeier and Peter Czaban. The Web3 Foundation, co-founded by Wood, funds the project's ongoing research and development. That institutional backing matters: it means Polkadot isn't a speculative venture with anonymous founders; it has a documented research roadmap and a named team accountable to the broader ecosystem.
DOT token use cases:
- Governance - DOT holders vote on protocol upgrades, fee structures, and treasury spending
- Staking - Validators and nominators lock DOT to secure the relay chain; earn rewards proportional to stake
- Parachain bonding - Projects must bond DOT to secure parachain slots via auction; bonded DOT is locked for the lease duration
- Transaction fees - DOT is used for fees within the Polkadot ecosystem
Each of these functions creates demand for DOT beyond pure speculation, which matters when evaluating long-term price sustainability. If you're new to how crypto staking works, understanding the supply mechanics is especially important before interpreting price forecasts.
How DOT Staking and Governance Affect Price
Staking is one of the most direct supply-side levers for DOT's price. When tokens are bonded for parachain slots or locked in staking, they're removed from the circulating supply. Fewer liquid tokens chasing the same buyer demand puts upward pressure on price, all else being equal.
The governance mechanism amplifies this dynamic. DOT holders who participate in on-chain votes - on runtime upgrades, treasury allocations, or parachain slot approvals - typically keep their tokens staked throughout the voting period. That's a structural reduction in sellable supply during periods of active governance.
Higher staking participation doesn't guarantee price appreciation - broader market forces always dominate short-term action. But over a multi-year horizon, tokenomics that reduce circulating supply create a structural tailwind that pure speculation-driven tokens don't have.

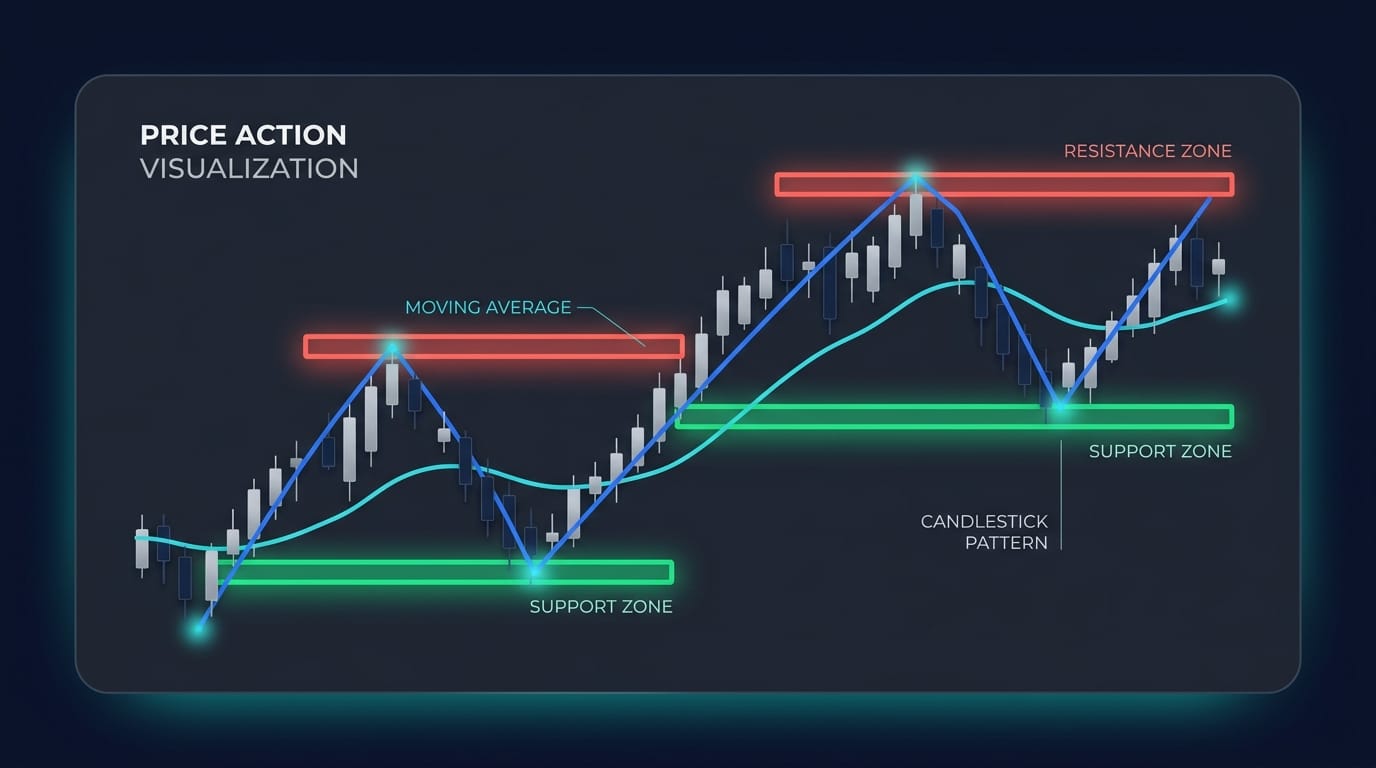
DOT Technical Analysis: Reading the Price Chart
DOT technical analysis in Q1 2026 paints a cautious picture. According to CoinCodex data, the 14-day RSI sits around 43 - technically neutral, but leaning toward oversold territory after a -15.27% drop over the past seven days. That kind of move doesn't invalidate the trend, but it does mean momentum is weak.
The 50-day simple moving average (SMA) is at approximately $1.47, sitting above the current price - a bearish signal. The 200-day SMA is significantly higher at around $2.46, which means DOT is trading well below its longer-term price average. A sustained return above the 50-day SMA would be the first real technical confirmation that the downtrend is reversing. For a deeper understanding of how to read these indicators, this guide to cryptocurrency charts covers RSI, moving averages, and candlestick patterns from the ground up.
The MACD is showing a bearish crossover - the signal line has crossed below the MACD line, indicating that downward momentum is dominant. Bollinger Bands would likely show price trading near the lower band, suggesting DOT is in an extended bearish stretch but may be approaching mean-reversion territory.
Key Support and Resistance Levels for DOT
Fibonacci retracement tools applied to DOT's prior cycle swing give us a map of the key price zones that traders watch. The $1.83 level is the one most analysts are focused on in the near term - MEXC's technical analysis flagged it as the key resistance after DOT staged a 27.74% surge to $1.62 in late February 2026. That rally broke DOT above key moving averages briefly, but it couldn't hold. A sustained close above $1.83 would open the door toward $2.20-$2.60.
Conversely, a break below $1.20 support without a quick recovery would likely put $1.00 in play - and that's a level where market psychology can accelerate selling.
DOT Price Prediction 2026: Short-Term Forecast
Models project a 2026 trading range of approximately $1.20 to $1.83 for DOT, with the balance of scenarios skewed bearish given current technical conditions.
CoinCodex's algorithmic model forecasts DOT ending 2026 around $1.20, reflecting continued weak momentum and a broader altcoin bear market. Their monthly data shows the $1.33-$1.42 range holding through Q1 before a gradual slide toward the $1.08-$1.25 range through Q3, then a partial recovery to ~$1.20 by December.
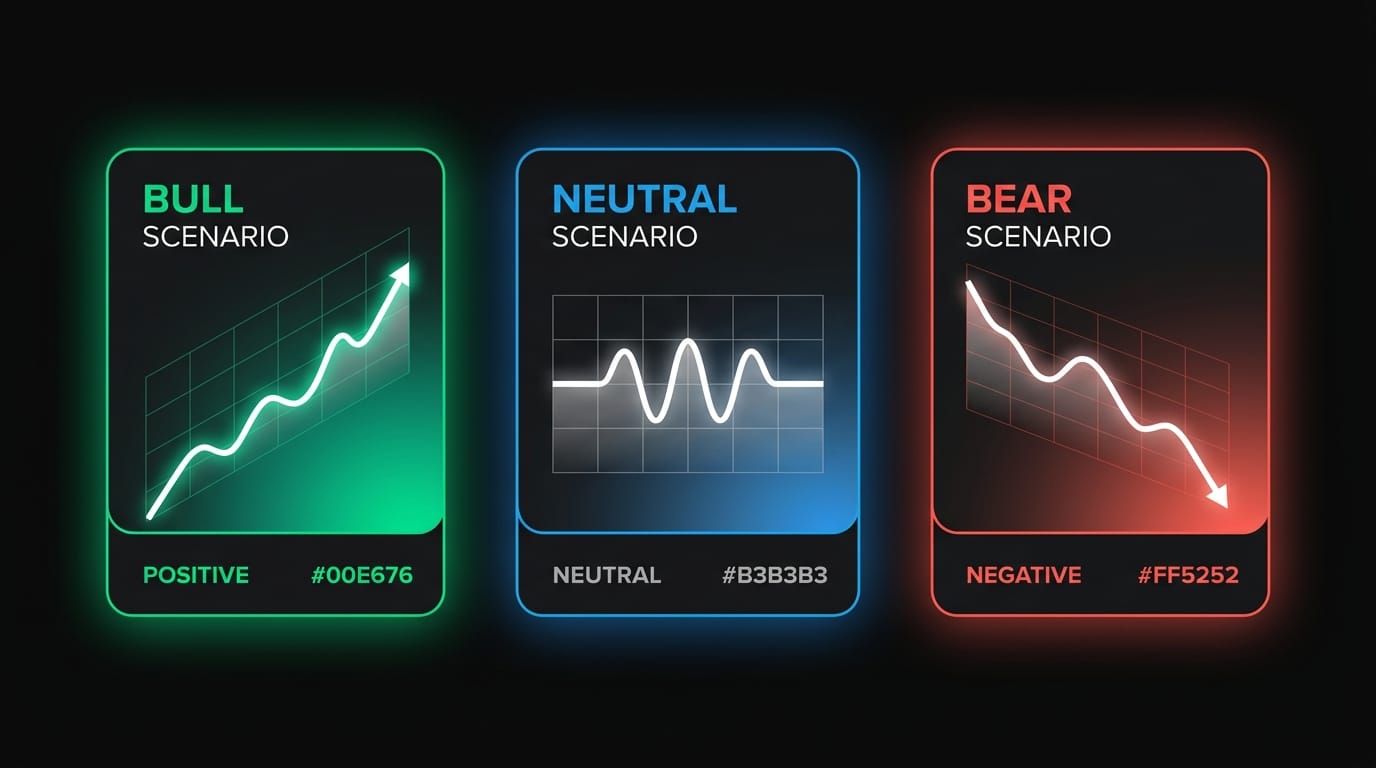
✓ BULL CASE
$1.83-$2.20
Sustained break above 50-day SMA + broader crypto market recovery
◎ BASE CASE
$1.30-$1.50
Range-bound between key support/resistance; no macro catalyst
✕ BEAR CASE
$1.00-$1.20
Macro deterioration; continued altcoin outflows; failed support
The Fear & Greed reading of 11 is worth contextualizing: historically, extreme fear readings have coincided with market bottoms, not tops. That doesn't make DOT a straightforward buy - sentiment can stay depressed for extended periods - but it does mean that the current price may reflect more fear than fundamentals strictly justify. The 2027-2030 picture diverges significantly depending on which macro assumptions you use.
Polkadot Price Prediction 2027-2030: Long-Term Outlook
Long-term DOT forecasts span an enormous range, and that's not a bug - it's an honest reflection of how uncertain multi-year crypto predictions are. Models that assume DOT recaptures meaningful market share in the interoperability niche project significantly higher prices. Models that assume continued competitive pressure from Ethereum's L2 ecosystem and stagnant developer activity project gradual decline.
The divergence between Benzinga's $31+ by 2029 and CoinCodex's $0.63 by 2030 reflects fundamentally different assumptions. Benzinga and Changelly are implicitly pricing in a strong crypto bull cycle; CoinCodex's model weights current technical momentum heavily. Neither is necessarily correct - they're asking different questions. For context on how similar divergences appear in other major altcoin forecasts, see the XRP price prediction analysis on Zipmex, which covers the same methodology gap in depth.
What Could Push DOT to Its Bull Case Target?
Several catalysts could shift DOT's price trajectory toward the higher analyst targets:
- New parachain activity - Each new parachain project bonds DOT for the lease duration, directly reducing circulating supply. A wave of new launches in DeFi and gaming would create structural demand pressure.
- Bitcoin halving tail effects - Historically, altcoins have experienced significant price appreciation 12-18 months after Bitcoin halvings. The most recent halving's secondary effects are still working through the market.
- Cross-chain DeFi expansion - As DeFi protocols increasingly require interoperability across chains, Polkadot's relay chain architecture becomes more valuable.
- Web3 Foundation milestones - Protocol upgrades, JAM (Join-Accumulate Machine) chain development, and ecosystem grants could drive developer adoption and TVL growth.
- Institutional altcoin ETF approvals - Any regulatory shift toward altcoin ETFs in major markets would bring significant capital into mid-cap assets like DOT.
- Macro risk-on environment - A sustained risk-on period - falling rates, dollar weakness, or tech sector outperformance - historically correlates strongly with altcoin bull runs.
Bearish Risks and Downside Scenarios for DOT
The bear case is equally credible. These are the headwinds most likely to keep DOT price suppressed:
- Ethereum L2 competition - Arbitrum, Optimism, Base, and other Ethereum Layer 2 solutions increasingly compete for the interoperability and scaling use cases that Polkadot was designed to solve.
- Cosmos (ATOM) rivalry - Cosmos targets the same cross-chain interoperability niche and has been gaining developer adoption. The IBC (Inter-Blockchain Communication) protocol offers comparable functionality to Polkadot's relay chain model.
- Regulatory risk on staking - Regulators in multiple jurisdictions have begun treating staking rewards as taxable income or potential securities. A broad crackdown on staking could reduce DOT bonding demand.
- Declining developer activity - If active developer counts on Polkadot's ecosystem trend downward, it signals weakening long-term utility demand.
- Failed parachain adoption - Parachain slots that fail to attract active user bases represent wasted bonded DOT; if enough projects fail or abandon their slots, it creates negative signal for the ecosystem.
- Broad altcoin bear market continuation - CoinCodex's $0.63 bear case reflects a scenario where DOT simply doesn't recover with the broader market - a fate that has befallen many former top-10 assets.

How to Trade or Invest in DOT: Getting Started
Buying DOT is straightforward on any major exchange. Here's a direct five-step process:
- Choose an exchange - Binance, Coinbase, Kraken, and MEXC all list DOT with solid liquidity. Check that the exchange is available in your jurisdiction.
- Create and verify your account - Complete KYC verification with government-issued ID. Most exchanges take 10-30 minutes for basic verification.
- Deposit funds - Fund your account via bank transfer, card, or by transferring crypto from another wallet. Deposit fees vary by method.
- Purchase DOT - Use a market order for instant execution at current prices, or a limit order to buy at your target entry price (e.g., setting a limit buy at the $1.20-$1.30 support zone).
- Secure your DOT - For amounts you don't plan to actively trade, transfer DOT to a non-custodial wallet (Polkadot.js, Talisman, or a hardware wallet). This enables direct staking and gives you full on-chain custody of your funds.
For traders who want direct on-chain exposure without exchange custody, perpetual futures contracts on DOT are available on decentralized platforms - allowing both long and short exposure with leverage. Note that leveraged positions amplify both gains and losses and carry significantly higher risk than spot holdings. Understanding how funding rates work in perpetual futures is essential before trading leveraged DOT positions.
How Analysts Evaluate DOT Price Predictions: Methodology
Price predictions don't appear from nowhere. Understanding how they're built tells you how much weight to give any particular forecast - and why two reputable sources can publish targets that are 10x apart.
Two analytical frameworks dominate. Technical analysis reads price action and market structure using indicators like RSI, MACD, Bollinger Bands, Moving Averages, and Fibonacci Retracement - it doesn't care about Polkadot's technology, only what buyers and sellers are doing with the chart. Fundamental analysis evaluates the underlying value drivers: tokenomics, developer activity, parachain adoption, staking participation, and on-chain metrics like active addresses and transaction volume.
Free vs. Paid vs. AI-Based DOT Price Prediction Tools
Not all prediction tools are built the same. Here's how to match tool type to your actual use case:

DOT Trading Strategies Based on Price Predictions
Knowing the forecast range is only half the puzzle. DOT's current technical setup - RSI at 43, Extreme Fear sentiment, price below both key moving averages - shapes which strategies are actually executable right now. A bull-market momentum strategy doesn't work in this environment. What does work depends entirely on your risk tolerance and time horizon.
Popular Trading Strategies for DOT
Swing Trading DOT: With DOT oscillating between roughly $1.20 support and $1.83 resistance, swing traders can look to enter long positions when RSI drops below 35-40 near the $1.20-$1.30 support zone, targeting the $1.60-$1.83 resistance range for exits. A trailing stop-loss below $1.15 limits downside if support fails.
HODL / Long-Term Accumulation: Extreme Fear readings have historically offered better entry prices for long-term holders than periods of euphoria. Long-term accumulators who believe in Polkadot's interoperability thesis may view current prices as a potential entry point - with the understanding that price could remain depressed or decline further before any recovery.
Risk Management for DOT Investors
DOT's 5.55% daily volatility isn't unusual for crypto, but it does mean risk management isn't optional - it's structural. With only 33% green days over the past 30 sessions, the odds of any given day going against a long position are roughly 2:1.
⚠ Five Risk Management Rules for DOT Traders
- Set a stop-loss before entering any position → for long positions, a close below $1.00 on volume signals further downside; don't move your stop lower after entering
- Size positions to your actual risk tolerance → losing 50% of a DOT position hurts differently at 1% of portfolio versus 20%
- Never trade DOT with funds you can't afford to lose → 33% green-day rate means odds are against any given long position on a daily basis
- Diversify within crypto and across asset classes → concentration in a single altcoin amplifies volatility without improving expected returns
- Account for on-chain execution costs → gas fees, exchange fees, and slippage compound over many trades; factor them into expected return calculations
Polkadot vs. Competitors: Is DOT Still Worth Watching?
This is the question most DOT price prediction articles skip entirely. Whether DOT remains competitive vs. alternative platforms matters enormously for long-term price thesis.
Polkadot's interoperability architecture is genuinely differentiated - particularly for use cases requiring cross-chain communication at the protocol level rather than via bridges. The relay chain model offers shared security that neither Cosmos's IBC nor Avalanche's subnets fully replicate. The challenge is adoption pace: Ethereum's L2 ecosystem and Cosmos have both captured significant developer mindshare. That competitive reality is priced into DOT, which is why forecast models diverge so widely on its long-term trajectory.
Conclusion: Should You Invest in DOT in 2026?
The data doesn't point cleanly in either direction - which is exactly the honest answer.
📊 Summary of Key Forecasts
- 2026 range: $1.20 (bear, CoinCodex) to $1.83 (resistance target) - current base case $1.30-$1.50
- 2027-2028: Wide divergence - $2.24 (CoinCodex) to $15-$21 (Benzinga/Changelly)
- 2030 bull case: $28-$31+ (Digital Coin Price, Benzinga models)
- 2030 bear case: $0.63 (CoinCodex model based on current technical trajectory)
- Key variable: Whether Polkadot's parachain ecosystem and JAM chain development can drive meaningful adoption in the 2027-2029 window
For short-term traders: The current Extreme Fear reading (11) and neutral RSI (~43) suggest DOT may be approaching a contrarian entry zone near $1.20-$1.30 support. But momentum must confirm any reversal before committing - a confirmed close above the 50-day SMA ($1.47) is the signal worth waiting for.
For long-term investors: If you hold a constructive view on the interoperability thesis, current prices represent a significant discount to the 2021 cycle high. The question isn't whether current prices are low - they clearly are relative to prior peaks. It's whether the underlying adoption story materializes on the timeline that makes those long-term forecasts meaningful.
For risk-averse market participants: The forecast divergence is too wide to be comfortable with heavy allocation. A $0.63 bear case and a $31 bull case coexisting isn't uncertainty - it's a coin flip on market cycle direction. Position sizing matters more than entry timing in this environment. Self-custodial platforms that give you full on-chain ownership of your assets - where positions are transparent and auditable rather than held in opaque custodial structures - align with the kind of trustless approach that volatile assets like DOT demand. Platforms built on this principle, like Zipmex, reflect where serious crypto infrastructure is heading.
As Polkadot's JAM chain development progresses and the 2025 Bitcoin halving cycle plays out, the picture should clarify. Until it does, conviction-sized positions in DOT require either a strong fundamental thesis or a well-defined technical setup - and preferably both.
Last updated: March 2026.
⚠ Risk Disclaimer
Crypto trading and investing involves substantial risk of loss. This article is for informational purposes only and does not constitute financial or investment advice. Past price performance is not indicative of future results. Always conduct independent research and consult with a qualified financial professional before making investment decisions.
Frequently Asked Questions
What is the DOT price prediction for 2026?
Models project DOT trading in a range of approximately $1.20 to $1.83 throughout 2026. CoinCodex's algorithmic model forecasts the token ending the year around $1.20, reflecting continued weak momentum. On the bullish end, MEXC's technical analysis cites $1.83 as a near-term resistance target achievable if momentum sustains. The base case - absent a major macro catalyst - is a range-bound $1.30-$1.50. As always with crypto price forecasts, actual outcomes can deviate significantly from model projections.
What is the DOT price prediction for 2030?
Long-term DOT predictions for 2030 span an extreme range. CoinCodex's bear-case model puts DOT below $0.63 by 2030 based on current technical trajectory. On the other end, Digital Coin Price and Benzinga project DOT reaching $28-$31+ before 2030 under bullish crypto cycle assumptions. The wide divergence reflects genuinely different views on whether Polkadot's interoperability architecture will gain mainstream adoption by the decade's end. Neither outcome is implausible; position sizing accordingly.
Is Polkadot (DOT) a good investment in 2026?
Whether DOT suits your portfolio depends entirely on your risk tolerance, time horizon, and conviction in the interoperability thesis. Technically, DOT is in a bearish trend with RSI at ~43 and price below both the 50-day and 200-day SMAs. Fundamentally, Polkadot has genuine architectural advantages in cross-chain communication. What's uncertain is whether adoption timelines will validate the bullish long-term forecasts. This article provides data and analysis - not investment recommendations. Always evaluate positions based on your individual financial situation.
What are parachains and how do they affect DOT price?
Parachains are independent blockchains that run in parallel within the Polkadot ecosystem, each specializing in a particular use case. They connect to the relay chain, which provides shared security and cross-chain messaging. The price connection is direct: to secure a parachain slot, projects must bond a substantial amount of DOT for the lease duration - typically 2 years. More active parachains means more DOT bonded and removed from circulating supply, creating upward supply pressure. Parachain slot auctions are closely watched as demand signals for the token.
What technical indicators are most useful for predicting DOT price?
For short-to-medium term DOT analysis, RSI and MACD are the most widely referenced. RSI identifies overbought/oversold conditions - currently reading ~43, just above the oversold zone. MACD signals momentum shifts through moving average crossovers - currently in bearish territory. The 50-day and 200-day SMAs are essential for trend identification. Bollinger Bands help assess volatility regimes, and Fibonacci retracement provides high-probability support and resistance zones. No single indicator is sufficient; the strongest signals emerge when multiple indicators converge.
How do I buy DOT on a crypto exchange?
To buy DOT: create an account on a major exchange (Binance, Coinbase, Kraken, or MEXC), complete KYC verification with government-issued ID, deposit fiat or crypto, then search for the DOT/USDT or DOT/USD trading pair. Place a market order for immediate execution or a limit order at your target price - the $1.20-$1.30 support zone is a level many traders watch for potential entry. After purchase, consider transferring to a self-custodial wallet for staking or long-term storage rather than leaving funds on the exchange.
What is the biggest risk to the DOT price in 2026?
The primary risks are: continued competitive pressure from Ethereum's L2 ecosystem (Arbitrum, Optimism, Base) and Cosmos IBC, both gaining developer adoption in interoperability use cases; declining developer activity on Polkadot itself; regulatory crackdowns on staking; and a prolonged altcoin bear market. CoinCodex's $0.63 bear case for 2030 reflects a scenario where several of these risks materialize simultaneously. Risk management - defined position sizing, stop-losses, and diversification - matters more than entry timing in this environment.
