
Every crypto bull run ends the same way: euphoria peaks, late buyers flood in, and then the music stops. The difference between walking away with profits and holding the bag often comes down to one skill - recognizing when the market is dangerously overbought.
⚡ Quick Answer
An overbought crypto market shows specific warning signs: RSI above 70, Fear & Greed Index above 75, NUPL exceeding 0.75, MVRV Z-Score above 6, and widespread mainstream media coverage. As of January 2026, the market sits in "Fear" territory (index ~30-35) following the October 2025 peak when Bitcoin reached its all-time high of $126,210. When multiple indicators align in the red zone, it signals elevated risk and potential profit-taking opportunity. No single metric is perfect - savvy traders watch for convergence of 3-5 signals before making exit decisions.
In October 2025, Bitcoin reached $126,210 while multiple on-chain indicators flashed extreme warnings. Those who recognized these signals took profits before the subsequent 25%+ correction. Those who dismissed them watched their portfolios decline significantly.
This guide breaks down the exact metrics professionals use to identify market tops - and more importantly, how to read them yourself in the current market environment.
What Does "Overbought" Mean in Crypto?
An overbought market occurs when asset prices rise faster than fundamentals justify, driven primarily by speculation and emotional buying rather than intrinsic value. In traditional markets, this concept is well-established. In crypto, where volatility runs 5-10x higher than stocks, understanding overbought conditions becomes critical for survival.
The crypto market operates in distinct psychological phases. During accumulation, smart money quietly builds positions. During the markup phase, prices rise steadily with healthy corrections. But during the euphoria phase - when everyone from your Uber driver to your grandmother starts asking about Bitcoin - the market enters dangerous overbought territory.
The tricky part? Euphoria feels incredible while you're in it. Prices keep rising, your portfolio keeps growing, and bearish warnings seem like the pessimistic ramblings of people who "just don't get it." This is precisely when you need objective metrics to cut through the emotional noise.
⚠ Risk Warning
Markets can remain overbought longer than expected. In 2021, Bitcoin stayed in "Extreme Greed" territory for over a month before the May crash. In October 2025, multiple indicators flashed red for 3+ weeks before the correction began. Use these indicators for risk management, not perfect timing. No indicator predicts exact tops.
Technical Indicators: The Foundation of Overbought Analysis
Before diving into advanced on-chain metrics, every trader should understand the classic technical indicators that have identified overbought conditions for decades.
1. RSI (Relative Strength Index) - The Essential Indicator
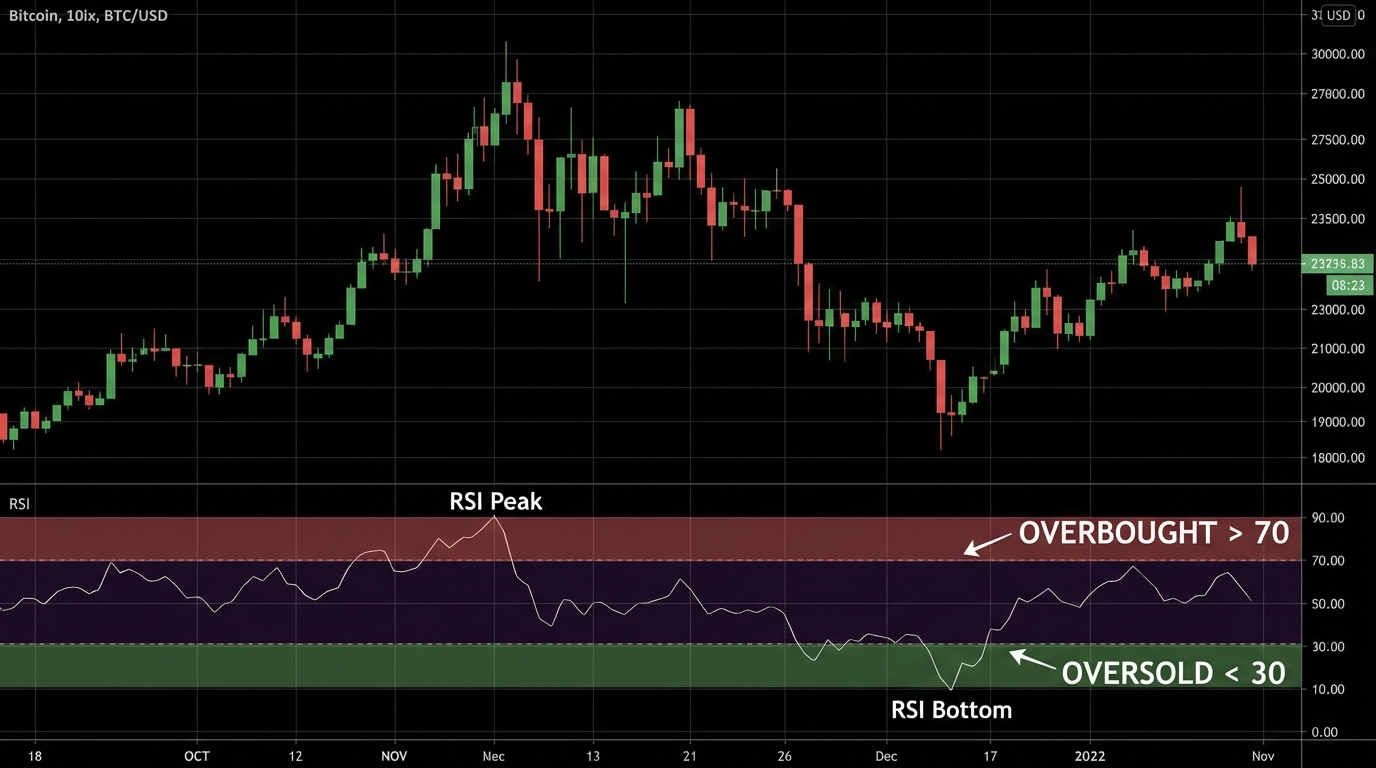
The Relative Strength Index is the most widely used overbought/oversold indicator in all of trading - crypto included. Developed by J. Welles Wilder in 1978, RSI measures the speed and magnitude of recent price changes on a scale of 0 to 100.
How RSI Works:
- RSI calculates the ratio of recent gains vs. recent losses over a specified period (typically 14 days)
- Values oscillate between 0 and 100
- The indicator identifies momentum shifts before they appear in price
Crypto-Specific Adjustments: In strong bull markets, crypto RSI can stay above 70 for weeks - even months. Experienced traders often use 80/20 levels during trending markets rather than the traditional 70/30.
Where to check RSI: TradingView, CoinGlass RSI Heatmap
2. Stochastic Oscillator
The Stochastic Oscillator compares a cryptocurrency's closing price to its price range over a specific period. It's particularly useful in choppy, sideways markets where RSI may give false signals.
Key Levels:
- Above 80: Overbought
- Below 20: Oversold
- Crossovers: When %K crosses %D, signals potential reversals
The advantage over RSI: Stochastic is more sensitive to short-term price movements, making it valuable for swing traders looking at shorter timeframes.
3. Williams %R
Williams %R measures how the current close compares to the highest high over a lookback period. It ranges from 0 to -100 (note the negative scale).
Key Levels:
- -20 to 0: Overbought zone
- -80 to -100: Oversold zone
Where to check: TradingView, MarketMilk
Sentiment Indicators: Measuring Market Psychology
4. Fear & Greed Index (0-100)
The Crypto Fear & Greed Index aggregates multiple data sources - volatility, trading volume, social media sentiment, market momentum, and Bitcoin dominance - into a single score between 0 and 100.
📊 Current Reading (January 2026)
Fear & Greed Index
~30-35 (Fear)
Bitcoin Price
~$89-95K
October 2025 ATH
$126,210
Correction from ATH
-25%+
The overbought signal: When the index stays above 75 ("Extreme Greed") for extended periods - particularly 2+ weeks - the market is likely overheated.
Where to check: CoinMarketCap, Alternative.me, CFGI.io (multi-timeframe)
On-Chain Indicators: Reading the Blockchain's Story
Unlike traditional markets, blockchain transparency gives us unprecedented insight into holder behavior and market psychology.
5. NUPL (Net Unrealized Profit/Loss)
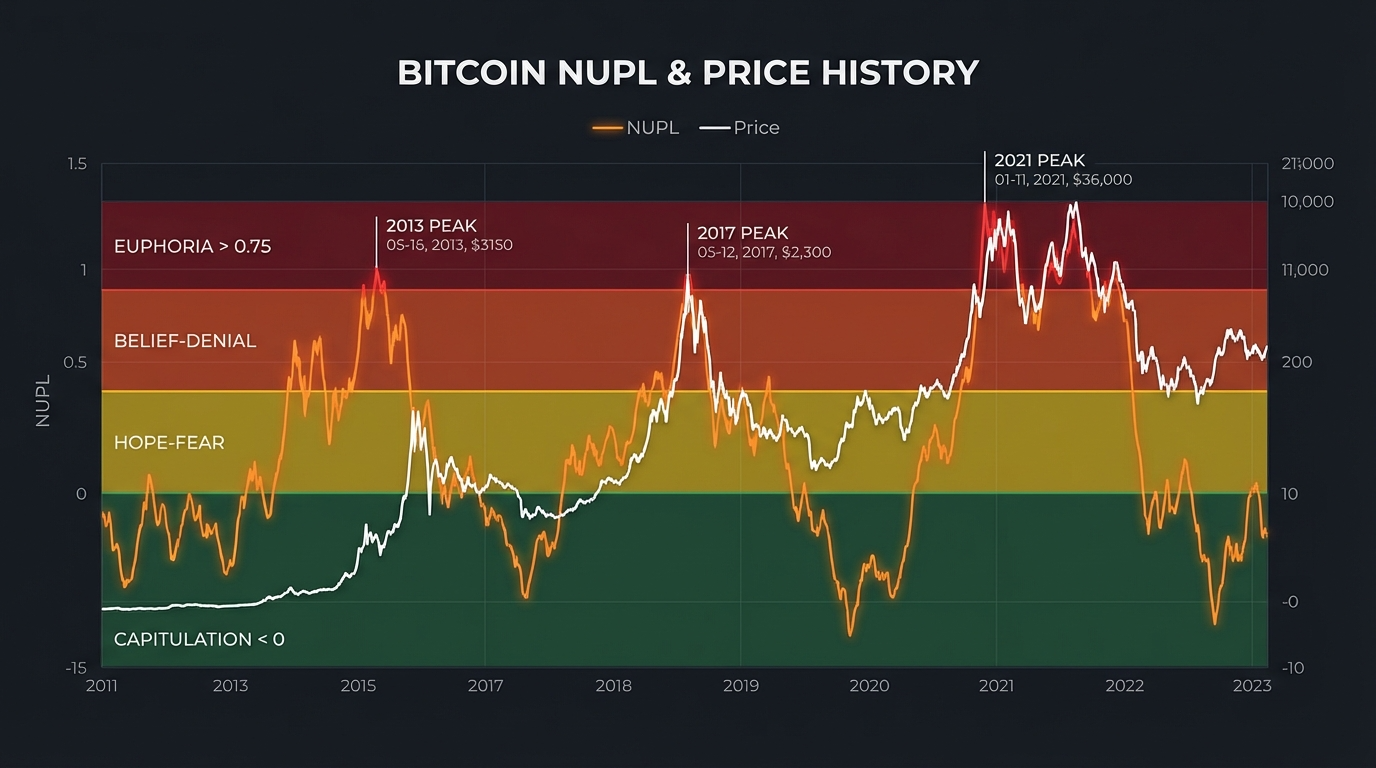
NUPL is one of the most powerful on-chain metrics for identifying market cycle phases. It measures the aggregate unrealized profit or loss held by all Bitcoin investors relative to market capitalization.
The Formula:
NUPL = (Market Cap - Realized Cap) / Market Cap
Historical accuracy: NUPL above 0.75 coincided with major cycle tops in 2011, 2013, 2017, 2021, and approached this level in October 2025. When this indicator reaches the euphoria zone, smart money typically begins distribution.
Where to check: Glassnode, CoinGlass NUPL, LookIntoBitcoin
6. MVRV Z-Score
The MVRV (Market Value to Realized Value) Z-Score identifies whether Bitcoin is overvalued or undervalued relative to its "fair value" - the aggregate cost basis of all coins in circulation.
How it works: The metric compares Bitcoin's market capitalization against its realized capitalization (sum of all coins valued at their last on-chain movement price), then normalizes using standard deviation.
The overbought signal: When MVRV Z-Score enters the red zone (above 7), Bitcoin has historically been at or near cycle tops. In both 2017 and 2021, this indicator reached extreme levels before major corrections.
Where to check: CoinGlass Bull Market Peak Signals, LookIntoBitcoin, Bitbo
7. Pi Cycle Top Indicator
This indicator gained fame for calling previous Bitcoin cycle tops with remarkable precision - often within days of the actual peak.
How it works: Pi Cycle Top uses two moving averages:
- 111-day Simple Moving Average (SMA)
- 350-day SMA multiplied by 2
The limitation: Pi Cycle Top is a lagging indicator. By the time the cross occurs, you're likely already at or past the peak. It's better used as confirmation rather than advance warning.
Where to check: Bitcoin Magazine Pro, Bitbo Charts
8. Puell Multiple
The Puell Multiple examines the market from the mining supply side, measuring miner revenue relative to its 365-day average.
The Formula: 'Puell Multiple = Daily Miner Revenue (USD) / 365-day MA of Daily Revenue'
Key Levels:
- Below 0.5: Miners in distress, often signals bottoms
- 0.5 to 4: Normal operating range
- Above 4: Miners earning 4x+ their yearly average - unsustainable euphoria
The overbought signal: When miners earn more than 4x their yearly average, it indicates extreme market conditions. Historically, these periods precede significant corrections as miners begin selling to lock in profits.
Where to check: LookIntoBitcoin, CoinGlass
Market Structure Indicators
9. Bitcoin Dominance & Altcoin Season Index
Market structure provides important context for overbought conditions. When Bitcoin dominance drops sharply while speculative altcoins surge, it often signals late-cycle euphoria.
What to Watch:
- Bitcoin dominance falling below 40%
- Altcoin Season Index above 75 (indicating 75%+ of top 100 coins outperforming BTC)
- Meme coin mania dominating social media
- Low-cap "moonshot" narratives everywhere
The warning sign: The peak of the bull market often occurs when altcoin mania reaches its zenith. Watch for BTC dominance to stop falling, find a bottom, and begin sharply reversing upwards - this indicates smart money fleeing to safety.
Where to check: CoinMarketCap Altcoin Season Index, TradingView BTC.D
10. Social & Behavioral Signals
Sometimes the most reliable indicators aren't on any chart - they're in human behavior.
Classic Euphoria Signals:
- Mainstream media coverage surge (CNN, Bloomberg crypto segments)
- Celebrity endorsements and influencer shilling
- Family members and coworkers asking for crypto tips
- "This time is different" narratives dominating discourse
- Extreme leverage usage across derivatives markets
- Google Trends for "buy Bitcoin" spiking to cycle highs
- Social media engagement peaks on crypto content
- New exchange signups reaching record levels
The contrarian indicator: When everyone agrees the market will keep going up, there's no one left to buy.
## Historical Case Studies: What Overbought Looked Like ### October 2025 Peak ($126,210)📊 Indicator Readings at October 2025 Top
Fear & Greed Index
82 (Extreme Greed)
Bitcoin Price
$126,210 ATH
MVRV Z-Score
Elevated (Orange Zone)
Subsequent Correction
-25%+ to ~$89-95K
What happened: Bitcoin reached an all-time high of $126,210 in early October 2025, driven by ETF inflows, institutional adoption, and post-halving momentum. The Fear & Greed Index showed Extreme Greed readings for several weeks. Social media was flooded with predictions of $150K+ by year-end.
The aftermath: Bitcoin corrected over 25% in the following months, trading around $89-95K by January 2026. The Fear & Greed Index shifted to "Fear" territory.
November 2021 Peak ($69,000)
📊 Indicator Readings at November 2021 Top
Fear & Greed Index
84 (Extreme Greed)
NUPL
0.72 (Near Euphoria)
Bitcoin Dominance
40.7%
Subsequent Crash
-78%
What happened: Bitcoin reached $69,000 amid widespread euphoria. Celebrities launched NFT collections, Coinbase ran Super Bowl ads, and "number go up" was the prevailing narrative.
The aftermath: Bitcoin crashed 78% to $15,476 over the following year. Many who bought near the top remained underwater for years.
December 2017 Peak ($20,000)
Indicator Readings:
- NUPL reached extreme euphoria levels above 0.80
- MVRV Z-Score hit the red zone
- Google Trends for "Bitcoin" hit all-time highs
- ICO mania was in full swing
The aftermath: 84% crash over the following year to $3,200.
🎯 Key Takeaways from Historical Tops
- Multiple indicators flashed warnings weeks before the actual top
- Social euphoria peaked before price euphoria
- The most dangerous moment felt like the safest (consensus bullishness)
- Crashes came suddenly after extended periods of extreme readings
- Each cycle, fewer people heed the warnings due to "this time is different" thinking
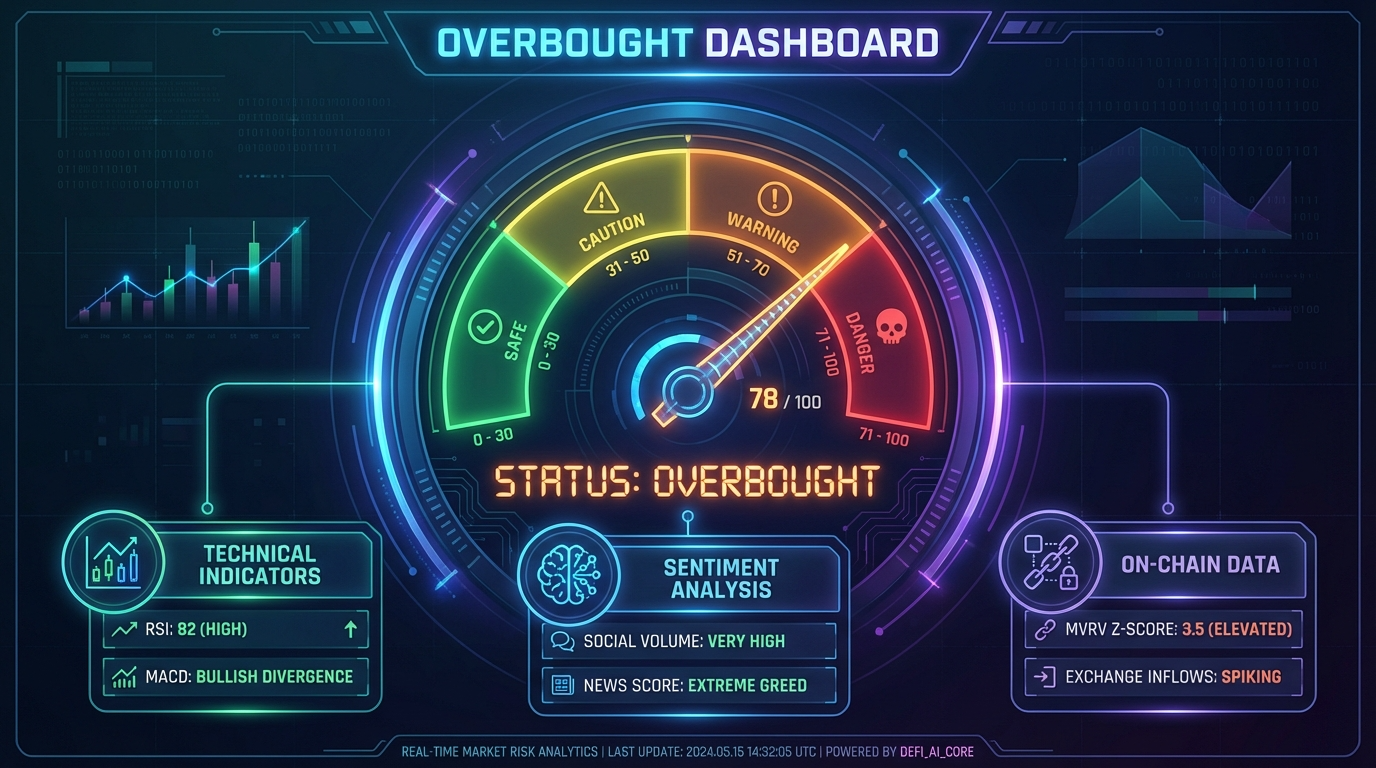
How to Build Your Overbought Detection System
Reading about indicators is one thing - implementing a systematic approach is another. Here's a practical framework:
Step 1: Set Up Your Dashboard
Create a monitoring routine with these free resources:
Step 2: Define Your Thresholds
Not all overbought signals are equal. Create a scoring system:
📈 Action Thresholds
Step 3: Develop Your Exit Strategy
Detecting overbought conditions is useless without an action plan:
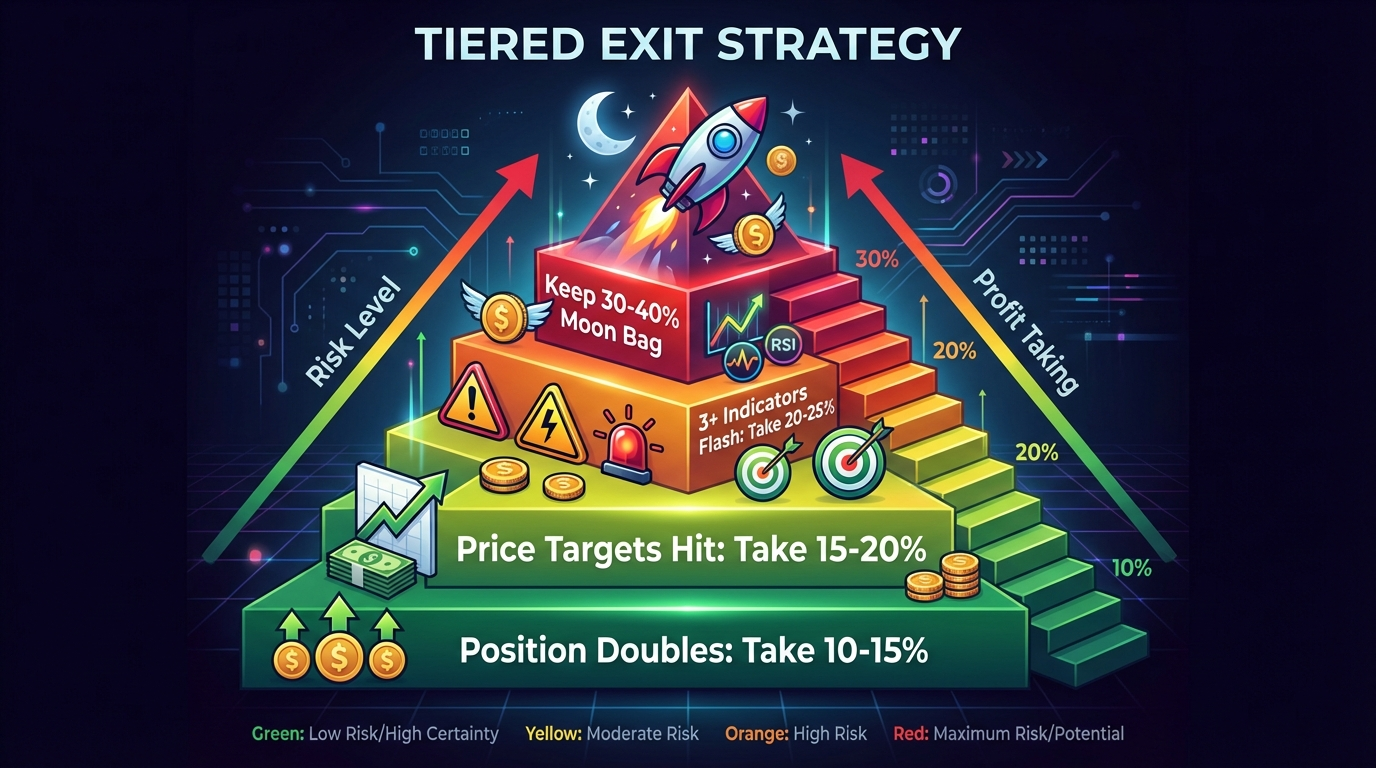
Tiered Selling Approach:
- Take 10-15% profit when your position doubles
- Another 15-20% at predetermined price targets
- Another 20-25% when 3+ indicators flash warnings
- Keep 30-40% as a "moon bag" for potential further upside
DCA Out Strategy: Just as you might dollar-cost average into positions, consider dollar-cost averaging out during euphoric phases. Sell 5% per week when conditions are extremely overbought.
Never Sell Everything: History shows that calling exact tops is nearly impossible. Keeping a portion ensures you benefit if the bull run extends further than expected.
📈 Practical Exit Framework by MVRV Z-Score
How ETFs Change the Game (2024-2026 Update)
Bitcoin ETFs introduced in 2024 have fundamentally altered market dynamics. Understanding this new reality is crucial for interpreting traditional indicators.
What's Different Now:
- Institutional Flows Don't Show On-Chain: Large ETF purchases happen through custodians, reducing the accuracy of some on-chain metrics
- New Demand Sources: ETFs create sustained buying pressure that can extend overbought conditions longer than historical patterns suggest
- Correlation Shifts: Bitcoin now correlates more closely with traditional risk assets, meaning macro events impact crypto more directly
- Liquidity Improvements: Higher liquidity can dampen volatility spikes, potentially making traditional RSI signals less reliable
What to Watch:
- ETF flow data (available on sites like Farside Investors)
- Grayscale vs. new ETF flows
- Options market put/call ratios
- Institutional positioning reports
⚠ Important: ETF Era Caveat
Traditional on-chain indicators were developed before institutional ETF adoption. While they remain valuable, consider them alongside ETF flow data for a complete picture. The October 2025 peak and subsequent correction showed that fundamentals still matter, but timing may differ from historical patterns.
What These Indicators Don't Tell You
Every tool has limitations. Understanding what overbought indicators can't do is as important as knowing what they can:
📉 Key Limitations
- They can't predict exact tops. Markets can stay irrational longer than you can stay solvent. An overbought market can become more overbought before correcting.
- They're backward-looking. On-chain metrics and moving averages process historical data. By the time an indicator triggers, the top may have already passed.
- Context matters. The 2024-2026 cycle introduced Bitcoin ETFs, unprecedented institutional adoption, and new market dynamics. Historical patterns may not repeat exactly.
- False signals occur. Every indicator has produced premature warnings that looked foolish in hindsight - until they weren't.
📉 Common Mistakes to Avoid
- Relying on single indicators: No metric works in isolation
- Selling too early: Overbought can get more overbought
- Ignoring all warnings: "This time is different" rarely is
- All-or-nothing exits: Gradual profit-taking beats timing attempts
- Emotional reactions: Stick to your predetermined plan
Frequently Asked Questions
What is the most reliable indicator for crypto market tops?
No single indicator is definitively "most reliable." However, NUPL (Net Unrealized Profit/Loss) has shown strong historical accuracy at identifying euphoria phases. When NUPL exceeds 0.75, all previous cycle tops have occurred within months. The key is using multiple indicators together - when 3-5 metrics align, the signal is much stronger than any individual reading. In the current market (January 2026), NUPL has retreated from elevated levels seen in October 2025.
What RSI level indicates overbought in crypto?
Traditionally, RSI above 70 indicates overbought conditions. However, in strong crypto bull markets, RSI can stay above 70 for extended periods. Many experienced traders use 80 as the overbought threshold during confirmed uptrends. For Bitcoin specifically, RSI above 85 on the daily chart has historically preceded significant corrections.
How long can crypto markets stay overbought?
Markets can remain in overbought territory for weeks or even months. In 2021, the Fear & Greed Index showed "Extreme Greed" readings for over a month before the May correction. In October 2025, multiple indicators flashed warnings for 3+ weeks before significant selling occurred. This is why timing exact tops is nearly impossible and tiered exit strategies work better than all-or-nothing approaches.
Should I sell everything when indicators show overbought?
Generally no. Even the best indicators produce false signals and early warnings. A more prudent approach involves taking partial profits as overbought signals accumulate while maintaining exposure for continued upside. Consider the 30-40% "moon bag" strategy - always keep a portion in case the bull run extends beyond expectations.
Where can I track these indicators for free?
Several excellent free resources exist:
- CoinGlass Bull Market Peak Signals - 30+ indicators in one dashboard
- LookIntoBitcoin - NUPL, MVRV, Pi Cycle, Puell Multiple
- CoinMarketCap - Fear & Greed Index, Altcoin Season Index
- CFGI.io - Multi-timeframe Fear & Greed
- TradingView - RSI, Stochastic, custom charts
- Glassnode - Limited free on-chain access
Do these indicators work for altcoins too?
Most on-chain indicators (NUPL, MVRV, Pi Cycle) are Bitcoin-specific. However, the Fear & Greed Index, Altcoin Season Index, RSI, and social sentiment signals apply to broader crypto markets. For altcoins specifically, Bitcoin's overbought status matters enormously - altcoins typically crash harder than Bitcoin during corrections. When Bitcoin indicators flash warnings, altcoin risk multiplies significantly.
What's the difference between overbought and a bubble?
"Overbought" describes a market condition where prices have risen faster than fundamentals justify in the short term. It often self-corrects through consolidation or modest pullbacks. A "bubble" implies speculative excess that will eventually result in a severe crash. Overbought conditions can occur within healthy bull markets; bubbles represent the terminal phase. The indicators discussed help identify both - mild overbought readings suggest caution, while extreme readings across multiple metrics may indicate bubble territory.
How do Bitcoin ETFs affect these traditional indicators?
Bitcoin ETFs introduce new market dynamics that may alter how traditional indicators behave. Large institutional flows through ETFs don't show up in on-chain metrics the same way retail transactions do. This could potentially reduce the predictive accuracy of purely on-chain indicators like NUPL. Smart analysts now track ETF flows alongside traditional metrics for a more complete picture. The October 2025 peak showed that while timing may differ, fundamentals still matter.
Can RSI divergence predict market tops?
Yes, but with caveats. RSI divergence occurs when price makes a new high while RSI makes a lower high - this can signal weakening momentum. However, divergences can persist for extended periods before a reversal occurs. They're best used as confirmation alongside other indicators, not standalone sell signals.
Conclusion
Spotting overbought conditions in crypto isn't about predicting exact tops - it's about managing risk when the music gets loud. The traders who navigated the October 2025 correction successfully weren't necessarily smarter; they simply paid attention to signals most ignored while riding the euphoria.
Your toolkit now includes 10 key metrics: RSI, Stochastic Oscillator, Williams %R, Fear & Greed Index, NUPL, MVRV Z-Score, Pi Cycle Top, Puell Multiple, Bitcoin Dominance/Altcoin Season, and Social Sentiment signals. Used together, they provide a robust framework for identifying elevated risk periods.
The next time everyone is certain that crypto only goes up, check your dashboard. When multiple indicators flash warnings simultaneously, remember: preserving gains is the foundation of long-term wealth building. You don't have to catch the exact top - you just need to not be the last one holding the bag.
Start Building Your Portfolio Wisely
Whether the market is overbought or not, smart position management starts with a reliable platform.
Explore Zipmex →⚠ Disclaimer: The information provided in this article is for educational purposes only and should not be considered investment advice. Cryptocurrency investments carry significant risk and volatility. Past performance of indicators does not guarantee future results. Always conduct your own research and consider consulting a financial advisor before making investment decisions. Never invest more than you can afford to lose.
