
Most crypto traders rely on price charts and gut feelings-then wonder why they bought at the top and panic-sold at the bottom. The difference between profitable traders and everyone else often comes down to one thing: on-chain analytics.
⚡ Quick Answer
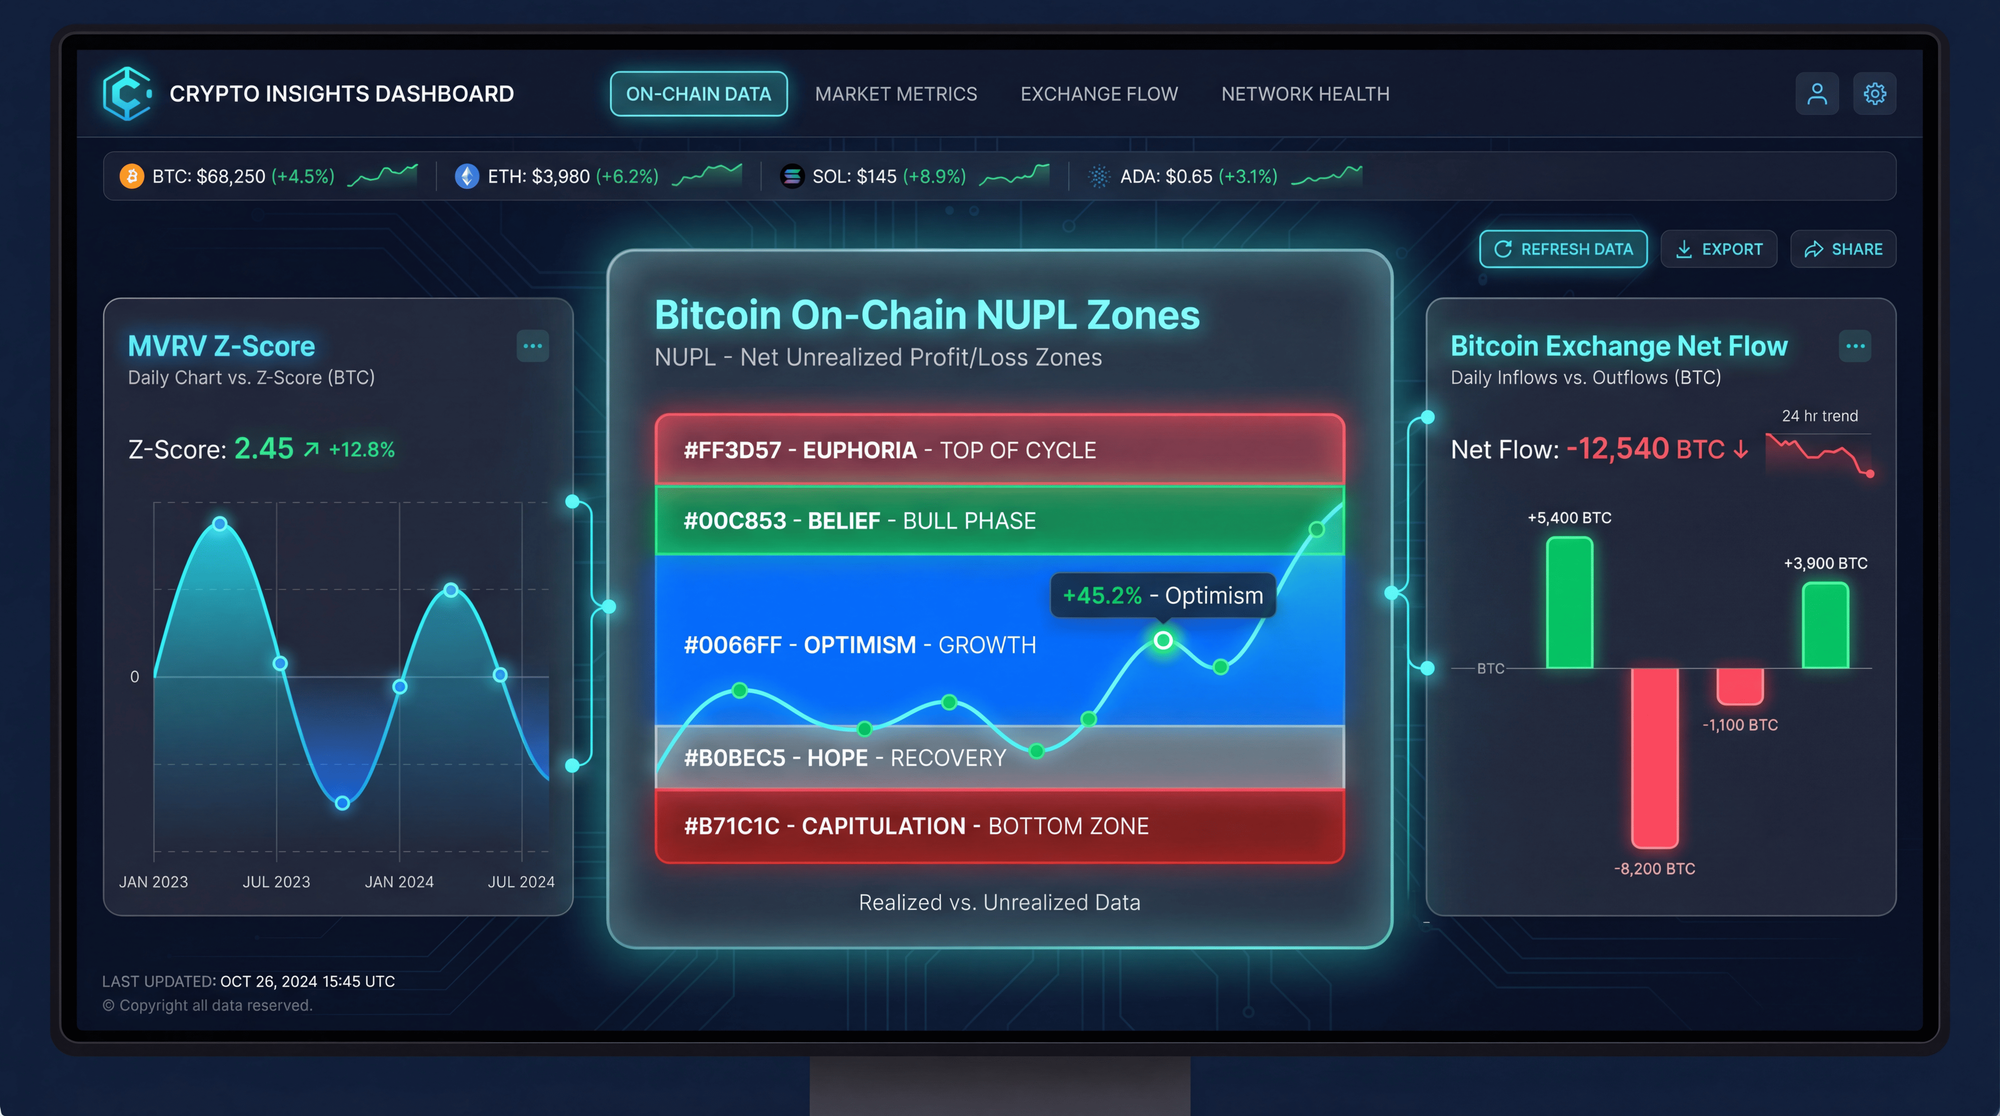
On-chain analytics lets you see what's actually happening on the blockchain-who's buying, who's selling, and whether long-term holders are taking profits. Key metrics like NUPL (Net Unrealized Profit/Loss) and MVRV Z-Score have historically identified market tops within days. As of January 2026, Bitcoin's MVRV Z-Score sits at 1.32-well below the "overheated" zone above 7, suggesting room for growth. When NUPL enters the "euphoria" zone (above 0.75) or MVRV Z-Score exceeds 7, history suggests it's time to take profits.
Unlike traditional markets, Bitcoin and other cryptocurrencies operate on transparent public ledgers. Every transaction, every wallet balance, every movement of coins is permanently recorded. On-chain analytics transforms this raw blockchain data into actionable trading signals that reveal what sophisticated investors are actually doing-not just what they're saying.
With Bitcoin trading between $92,000 and $97,000 in early 2026 and spot ETFs holding over $134 billion in assets, understanding on-chain metrics has never been more important for navigating this institutional-grade market.
What Is On-Chain Analytics and Why Does It Matter in 2026?
On-chain analysis examines data recorded directly on the blockchain to understand market behavior and predict future movements. Think of it as X-ray vision into the crypto market's inner workings.
When you look at a price chart, you see the result of millions of buy and sell decisions. On-chain data shows you the decisions themselves before they fully impact price. You can see coins moving from cold storage to exchanges (potential selling pressure), long-term holders accumulating during dips, or "smart money" wallets entering new positions.
The 2024-2026 landscape changed everything. The approval of spot Bitcoin ETFs in January 2024 created a new layer of institutional demand. By January 2026, U.S. spot Bitcoin ETFs recorded approximately $1.2 billion in inflows during the first two trading days alone, with total assets under management reaching $134.2 billion. This institutional presence means traditional on-chain metrics must now be combined with ETF flow data for complete market analysis.
On-Chain vs Off-Chain: Understanding the Data Landscape
Not all crypto activity happens directly on the blockchain:
On-Chain Data (Transparent):
- Wallet-to-wallet transfers
- Exchange deposits and withdrawals
- Smart contract interactions
- DeFi protocol activity
- Staking and unstaking
Off-Chain Activity (Less Visible):
- Internal exchange transactions
- ETF custody holdings (partially visible)
- OTC desk trades
- Centralized exchange order books
The key insight: on-chain data works best for Bitcoin and Ethereum because these networks have the longest history and most robust analytics infrastructure. For newer tokens, combine on-chain metrics with other analysis methods.

The 7 Essential On-Chain Metrics Every Trader Must Know
Not all on-chain metrics are created equal. After multiple market cycles, certain indicators have proven remarkably accurate at identifying major turning points. Here are the seven metrics that consistently deliver actionable insights.
1. NUPL (Net Unrealized Profit/Loss) - The Market Cycle Compass
NUPL is arguably the most important on-chain indicator for timing market cycles. It measures the total paper profits or losses held by all Bitcoin investors and normalizes it against market cap.
How it works: NUPL compares the current market value of all coins to the price at which each coin last moved (its cost basis). When the market trades far above most investors' cost basis, NUPL rises into "euphoria" territory. When the market crashes below most cost bases, NUPL drops into "capitulation."
The Formula: NUPL = (Market Cap - Realized Cap) / Market Cap
📊 NUPL Market Zones
- Euphoria (>0.75): Extreme greed - historically marks cycle tops within days. Time to aggressively de-risk.
- Belief (0.5-0.75): Healthy bull market - most holders in profit, momentum building. Hold with trailing stops.
- Optimism (0.25-0.5): Recovery phase - confidence returning after a downturn. Consider accumulating.
- Hope (0-0.25): Early recovery or late bear market - cautious optimism. Dollar-cost average in.
- Capitulation (<0): Most investors underwater - historically marks generational buying opportunities.
Historical Accuracy: NUPL identified the 2017 peak, 2021 double-top, and every major bottom with remarkable precision. When NUPL hit 0.75+ in November 2021, Bitcoin was at $69,000-it subsequently dropped 77%.
2. MVRV Z-Score - The Fair Value Detector
MVRV (Market Value to Realized Value) Z-Score identifies when Bitcoin is trading significantly above or below its "fair value" based on aggregate investor cost basis. The Z-Score component normalizes the data to account for volatility, making comparisons across cycles more meaningful.
Key levels to watch:
| Z-Score Range | Signal | Historical Action |
|---|---|---|
| > 7 | Extreme Overvaluation | Cycle tops (2013, 2017 within days) |
| 3 - 7 | Overheated but not extreme | Consider scaling out |
| 1 - 3 | Fair value to moderately bullish | Hold / Accumulate on dips |
| 0 - 1 | Undervalued | Strong accumulation zone |
| < 0 | Extreme Undervaluation | Generational buying opportunity |
January 2026 Reading: MVRV Z-Score at 1.32 indicates Bitcoin remains in fair-value territory with significant room for growth before reaching historical overheated levels. This contrasts with the late 2025 highs when Bitcoin briefly touched $126,000.
3. Exchange Flows - The Early Warning System
Exchange flows track the movement of cryptocurrency to and from exchange wallets. This metric provides direct insight into potential buying and selling pressure.
Reading the signals:
- Large inflows to exchanges: Coins moving to exchanges are positioned for potential sale - bearish signal
- Large outflows from exchanges: Coins moving to cold storage indicate accumulation - bullish signal
- Exchange reserve trends: Declining reserves over time suggest supply tightening
⚠ Important Context for 2026
Exchange flow interpretation has evolved. In 2022-2023, stablecoins moving to exchanges often represented USD redemptions, not buying intent. In 2026, with ETF dominance, some "accumulation" now happens off-chain through institutional custody. Always combine exchange flows with ETF data for the complete picture.
2025-2026 Pattern: Bitcoin exchange reserves declined to multi-year lows while price broke $100,000. This supply constraint, combined with ETF demand ($21.4 billion net inflows in 2025 alone), created significant upward pressure.
4. SOPR (Spent Output Profit Ratio) - The Profit-Taking Tracker
SOPR measures whether coins moving on-chain are being sold at a profit or loss. Values above 1 mean coins are moving at profit; below 1 means at loss.
How traders use SOPR:
- SOPR > 1 (consistently): Holders taking profits - normal in bull markets but watch for spikes
- SOPR < 1 (consistently): Holders selling at losses - capitulation signal, often near bottoms
- SOPR = 1: Breakeven level - often acts as support in bull markets, resistance in bear markets
The Psychology: During bull markets, SOPR dipping to 1 and bouncing indicates holders are unwilling to sell at a loss-bullish. During bear markets, SOPR failing to break above 1 shows every relief rally is used to exit-bearish.
5. Long-Term Holder vs Short-Term Holder Metrics
This distinction separates "diamond hands" from "paper hands" and reveals crucial market dynamics.
Definitions:
- Long-Term Holders (LTH): Coins unmoved for 155+ days
- Short-Term Holders (STH): Coins moved within last 155 days
Key metrics to track:
📈 LTH vs STH Signals
- LTH-MVRV: When LTH-MVRV exceeds 3.5, long-term holders are in massive profit-distribution phase likely.
- STH-MVRV: When STH-MVRV falls below 1, recent buyers are underwater-potential capitulation.
- LTH Supply: Declining LTH supply during price rises = distribution to new (weak) hands.
- STH Cost Basis: Current price relative to STH cost basis acts as key support/resistance.
January 2026 Context: Analysts note Bitcoin is trading between the "true mean price" and short-term holder cost basis, indicating a consolidation phase where "a more decisive move will require a return of liquidity and stronger participation."
6. Pi Cycle Top Indicator - The Cycle Peak Detector
The Pi Cycle Top uses two moving averages to identify major market cycle tops with remarkable historical accuracy.
The Signal: When the 111-day moving average crosses above the 350-day moving average multiplied by 2, it has historically signaled cycle peaks.
Historical Performance:
- Called 2013 top within 3 days
- Called 2017 top within 3 days
- Called April 2021 local top within 3 days
Current Status (2026): The Pi Cycle reading remains well below the crossover threshold, suggesting the current cycle has not yet peaked according to this indicator.
7. Stablecoin Supply Ratio (SSR) and TVL
Stablecoin metrics reveal the "dry powder" available to buy crypto and overall ecosystem health.
Key Stablecoin Metrics:
- SSR (Stablecoin Supply Ratio): Bitcoin market cap / total stablecoin supply. Low SSR = high buying power available. High SSR = limited stablecoin liquidity.
- Stablecoin Dominance: Percentage of crypto market cap in stablecoins. Rising dominance = risk-off sentiment.
- TVL (Total Value Locked): Capital committed to DeFi protocols. Rising TVL = ecosystem growth.
January 2026 Data: Total stablecoin supply reached $269.65 billion with USDT gaining market share (+$1.05B weekly) while USDC saw redemptions (-$639M). This USDT dominance often indicates offshore/emerging market demand.
Bitcoin ETF Flows: The New Essential Metric for 2026
The approval of spot Bitcoin ETFs in January 2024 fundamentally changed how institutional capital enters crypto. Understanding ETF flows is now as important as traditional on-chain metrics.
Why ETF Tracking Matters
ETF holdings represent a new form of institutional "cold storage" that doesn't appear in traditional exchange reserve metrics. When BlackRock's IBIT accumulates Bitcoin, it reduces circulating supply just like coins moving to cold wallets—but this activity is measured differently.
January 2026 ETF Landscape:
| ETF | Issuer | Market Share | Notable Flow Pattern |
|---|---|---|---|
| IBIT | BlackRock | ~50%+ | +$287M (Jan 2) |
| FBTC | Fidelity | ~25% | +$88M (Jan 2) |
| GBTC | Grayscale | Declining | Continued outflows |
| Others | Various | ~15% | Mixed |
Key 2026 ETF Stats:
- Total BTC ETF AUM: $134.2 billion
- 2025 net inflows: $21.4 billion
- 2024 net inflows: $35.2 billion
- Single-day record (Jan 2026): $760 million
How to Interpret ETF Flow Signals
Bullish Signals:
- Sustained daily inflows above $200M
- BlackRock/Fidelity leading inflows
- Grayscale outflows decelerating
- ETF volume exceeding on-chain settlement volume
Bearish Signals:
- Multiple consecutive outflow days
- Wide-spread redemptions across all issuers
- ETF discount to NAV appearing
New Development: Solana and XRP ETFs
2025-2026 saw the expansion of crypto ETFs beyond Bitcoin and Ethereum:
- Solana ETFs: Recording 12+ consecutive days of inflows in early 2026
- XRP ETFs: Seeing renewed interest amid regulatory clarity
- Morgan Stanley Filings: Traditional finance giant filed for Bitcoin and Solana ETF products
Corporate Treasury Analysis: Tracking Institutional Accumulation
Public companies holding Bitcoin as treasury reserves provide another layer of on-chain intelligence. These positions are often publicly disclosed and their wallet addresses are known.
Key Corporate Holders to Track
Strategy (formerly MicroStrategy):
- Holdings: 400,000+ BTC (as of late 2025)
- Strategy: Continuous accumulation via debt financing
- Recent Activity: Moved $5.1B BTC to Fidelity custody in late 2025
- Wallets: Publicly tracked on Arkham and similar platforms
Bitmine and Other DATCOs:
- Bitmine accumulated 3.3% of total ETH supply
- Digital Asset Treasury Companies (DATCOs) emerged as a category
- Combined corporate holdings: 1M+ BTC (approximately 5% of total supply)
📊 Corporate Treasury Insight
When Strategy moves BTC between wallets (like the $5.1B Coinbase-to-Fidelity transfer), it often creates panic on social media. Understanding the difference between custodial transfers (neutral) and exchange deposits (potentially bearish) prevents emotional trading mistakes.
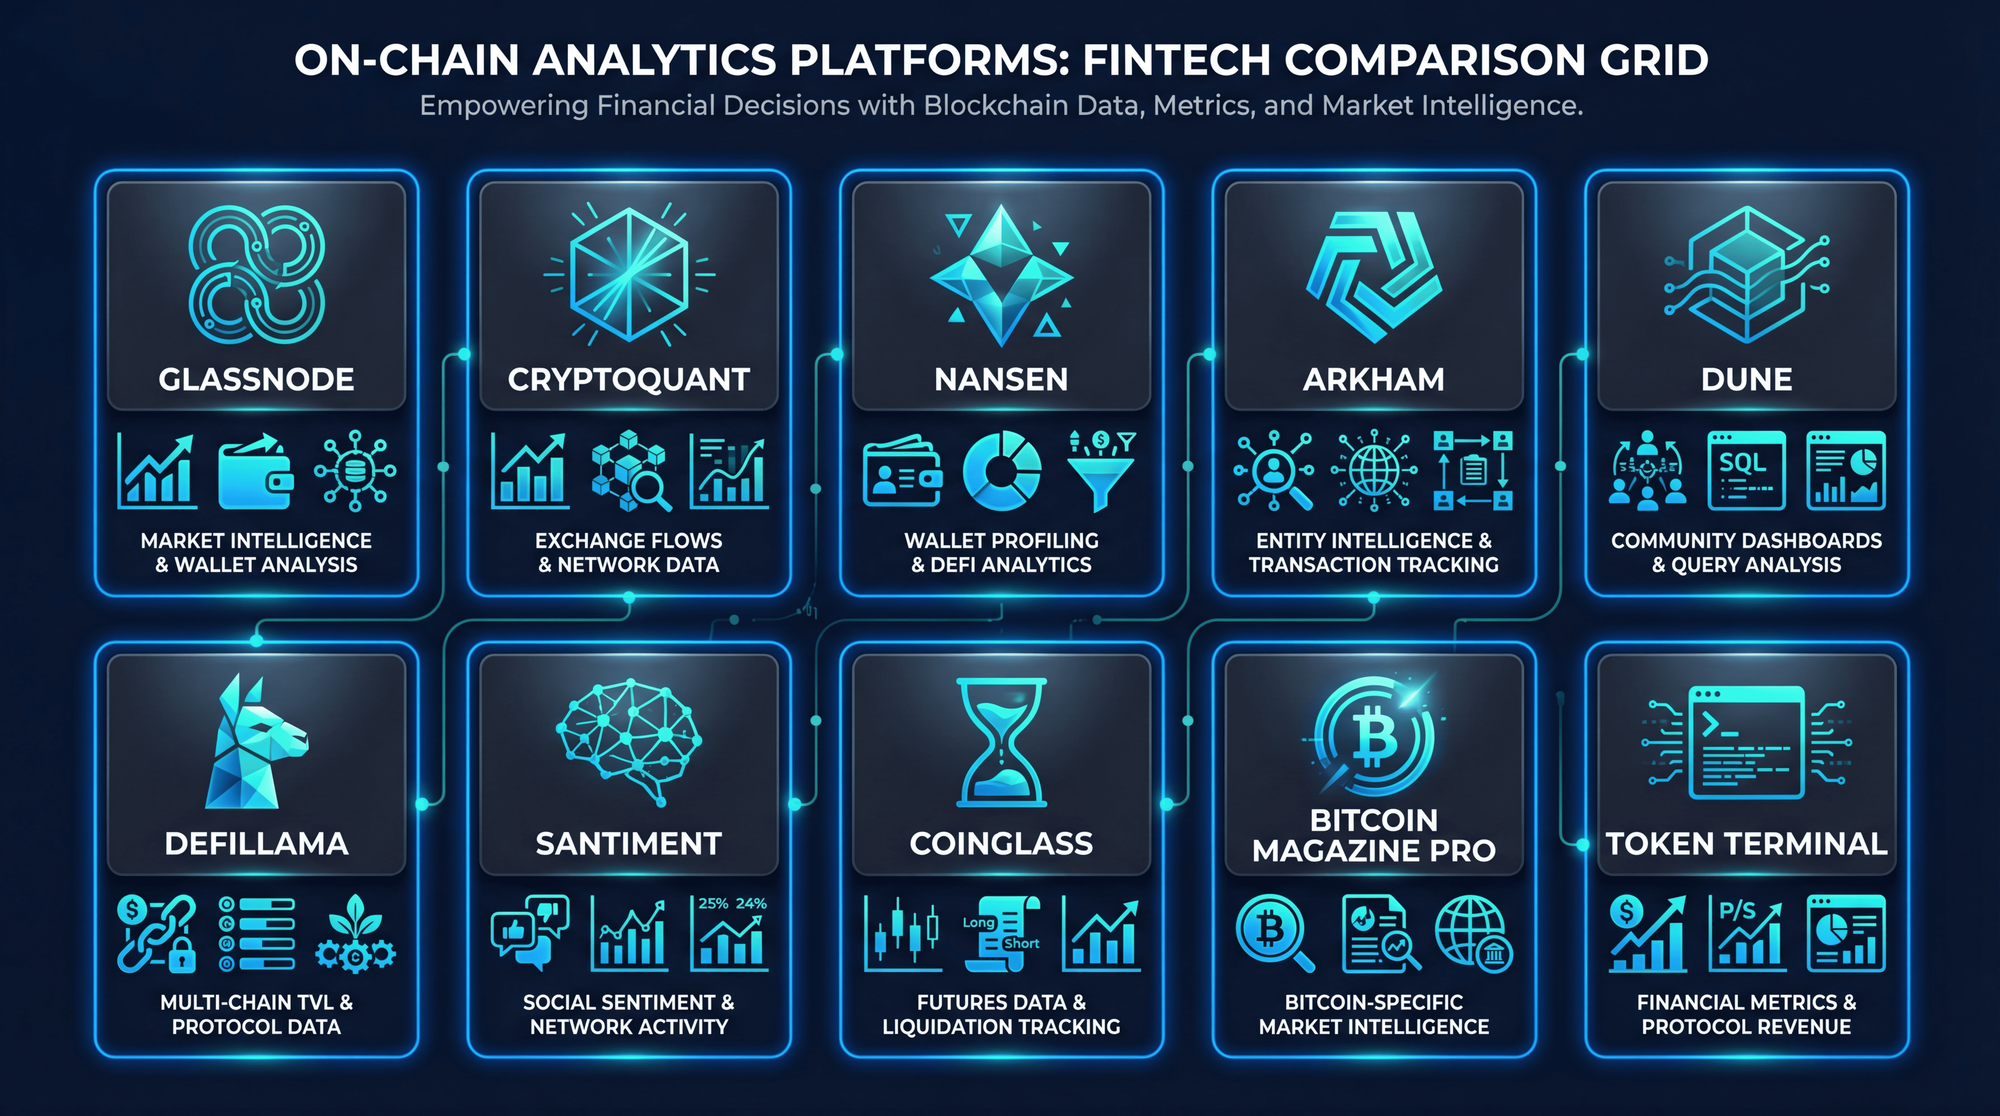
The 10 Best On-Chain Analytics Tools for 2026
Here's a comprehensive comparison of platforms that serious traders use:
| Platform | Best For | Free Tier | Key Features |
|---|---|---|---|
| Glassnode | BTC/ETH metrics | ✓ | NUPL, MVRV, curated dashboards |
| CryptoQuant | Exchange flows | ✓ | Miner data, stablecoin metrics |
| Nansen | Smart money tracking | Limited | 500M+ labeled wallets, 20+ chains |
| Arkham | Entity identification | ✓ | AI-powered wallet labels, alerts |
| Dune Analytics | Custom queries | ✓ | SQL queries, 100+ chains, community dashboards |
| Bitcoin Magazine Pro | Cycle analysis | ✓ | Pi Cycle, NUPL, educational content |
| DeFiLlama | DeFi TVL tracking | ✓ | Protocol TVL, yields, bridges |
| Santiment | Social + on-chain | Limited | Social sentiment, dev activity |
| CoinGlass | Derivatives data | ✓ | Open interest, funding rates, liquidations |
| Token Terminal | Protocol fundamentals | Limited | Revenue, users, P/E ratios |
Beginner Recommendation: Start with Glassnode's free tier for NUPL and MVRV, Bitcoin Magazine Pro for cycle indicators, and CryptoQuant for exchange flows. Add Arkham for wallet tracking as you advance.
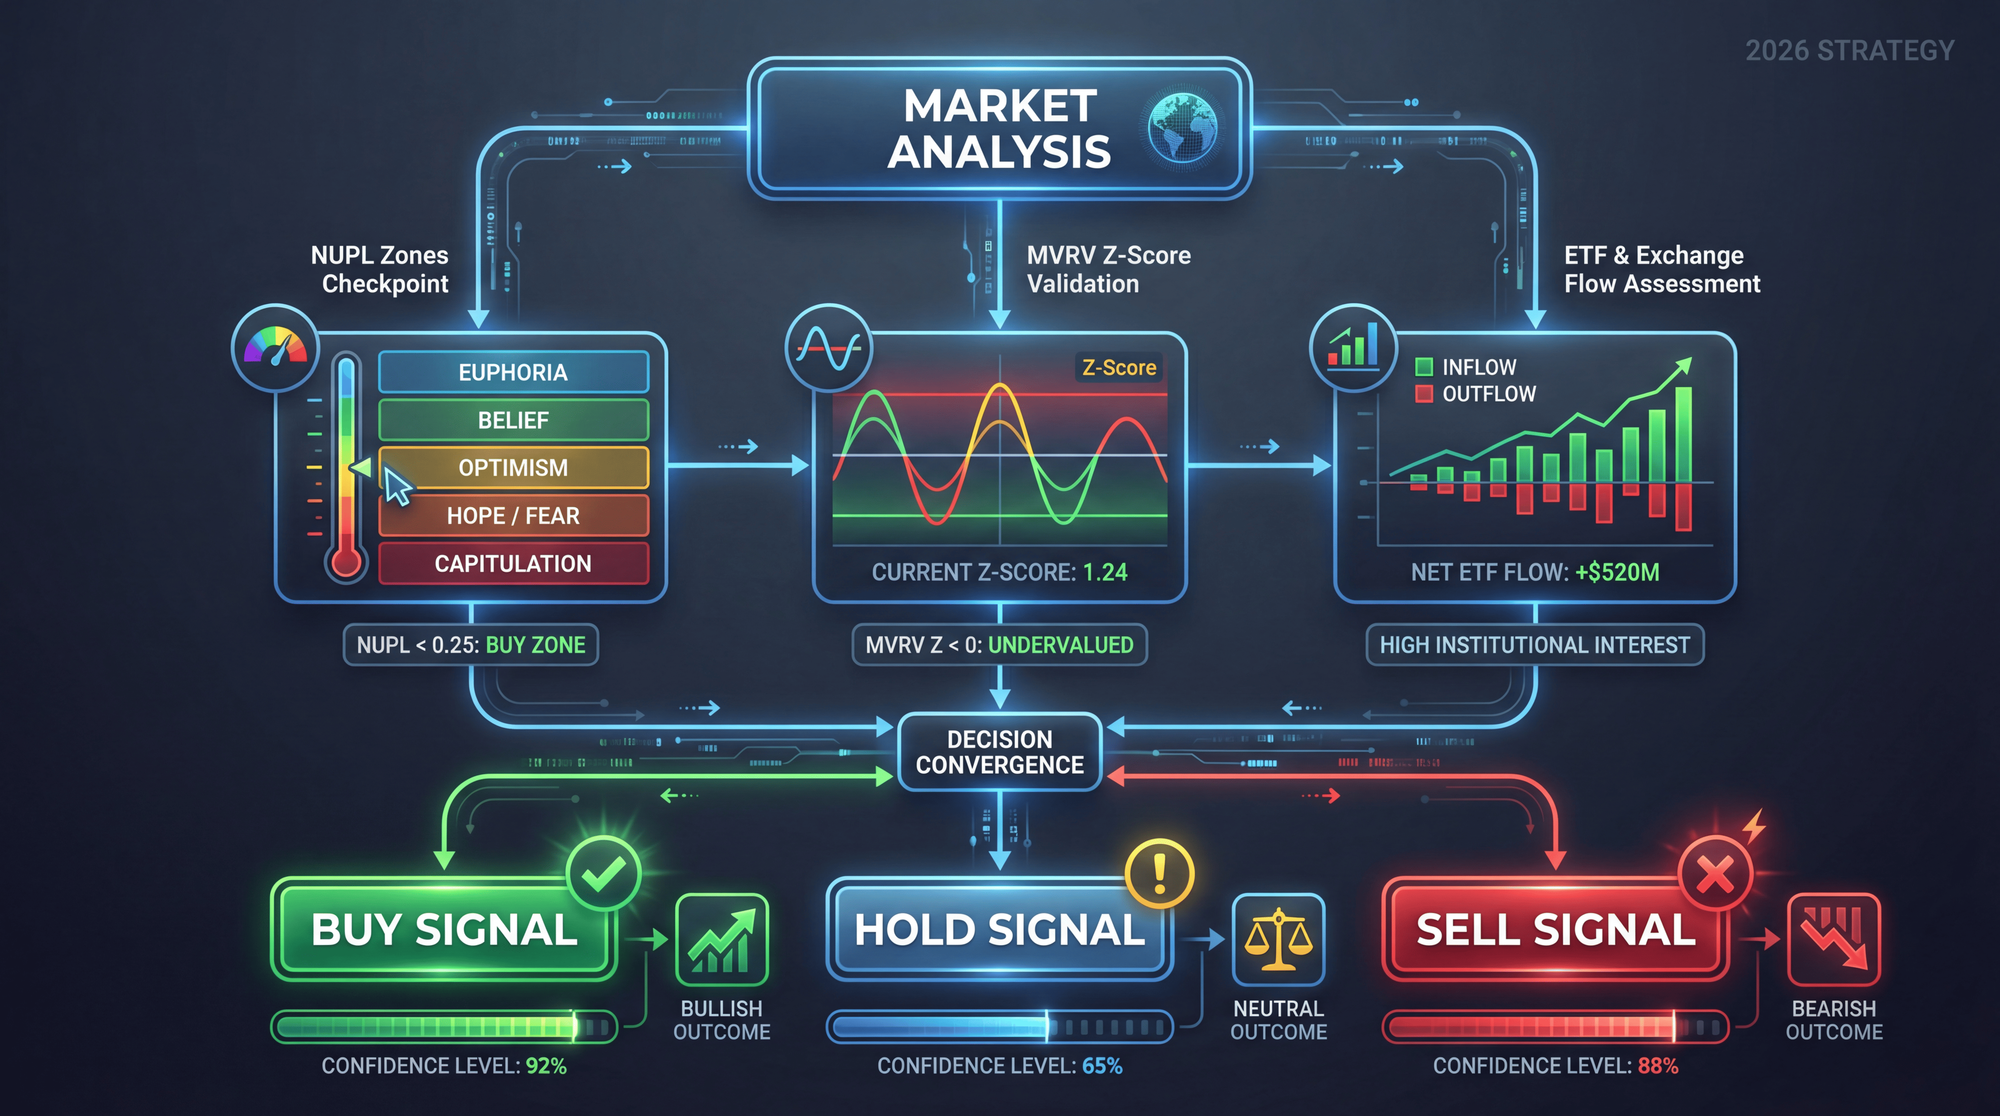
Building Your On-Chain Trading Strategy: A 3-Step Framework
Here's how to integrate on-chain analytics into your actual trading decisions:
Step 1: Establish the Macro Regime
Before making any trade, determine where we are in the market cycle. Understanding how blockchain transactions work helps you interpret what these flows actually mean.
Check NUPL Zone
Are we in euphoria (>0.75), belief (0.5-0.75), or capitulation (<0)? This determines your overall bias.
Validate with MVRV Z-Score
Current reading at 1.32 suggests fair value. Above 3 = caution. Above 7 = extreme overvaluation.
Assess Supply Dynamics
Check exchange reserves + ETF flows. Declining reserves + positive ETF flows = supply tightening (bullish).
Step 2: Identify Entry and Exit Signals
Use on-chain data to time your trades more effectively.
For Entries (Accumulation):
- NUPL below 0.25 or negative (hope/capitulation zones)
- MVRV Z-Score below 1 or negative
- Sustained exchange outflows
- LTH supply increasing (long-term holders accumulating)
- ETF inflows accelerating
For Exits (Distribution):
- NUPL approaching or exceeding 0.75 (euphoria)
- MVRV Z-Score above 6-7
- Sharp spikes in exchange inflows
- LTH supply declining rapidly (distribution to new buyers)
- Pi Cycle Top indicator approaching crossover
- ETF outflows persisting multiple days
Step 3: Combine with Traditional Analysis
On-chain data provides powerful context, but it works best when combined with other forms of analysis. Consider the broader cryptocurrency market predictions and macroeconomic factors.
Confluence Trading Framework:
- On-chain signals provide the macro direction (accumulate vs distribute)
- ETF flows show institutional sentiment
- Technical analysis helps refine entry/exit timing
- Fundamental analysis confirms project quality and catalysts
- Macro conditions (interest rates, liquidity, regulatory news) impact overall risk appetite
Real-World Application (January 2026 Example):
The recent market context illustrates this perfectly:
- MVRV Z-Score at 1.32 (fair value, not overheated)
- ETF inflows returned strongly ($1.2B first week)
- Exchange reserves near lows
- Price consolidating after pullback from $126K ATH
- Fed policy uncertainty creating macro volatility
Interpretation: On-chain metrics suggest structural bullishness (supply constraints, fair valuation), but macro factors warrant caution. Appropriate strategy: Maintain core positions, use pullbacks to accumulate, avoid FOMO on pumps.
🎯 Key Takeaways
- NUPL above 0.75 has historically marked major cycle tops-begin scaling out
- NUPL below 0 (capitulation) has marked generational buying opportunities
- MVRV Z-Score at 1.32 (current) indicates room for growth before overheating
- ETF flows now essential-$134B AUM represents significant "off-chain" accumulation
- No single metric is perfect-use multiple indicators for confirmation
Real Case Studies: On-Chain Analysis in Action
Learning from historical examples demonstrates how on-chain metrics work in practice.
Case Study 1: Ethereum Foundation Distribution (2021-2023)
The Ethereum Foundation has developed a reputation for selling near market tops. In May and November 2021, significant ETH transfers to exchanges coincided with local price peaks.
The Pattern:
- May 2021: 35,053 ETH to exchanges → local top, 55% drawdown followed
- November 2021: 20,000 ETH to exchanges → ATH at $4,800, 80%+ drawdown followed
- May 2023: $30M ETH to exchanges → 5% same-day price drop
The Lesson: Tracking known entity wallets (foundations, VCs, early investors) provides advance warning of potential selling pressure. Tools like Arkham and Nansen identify these wallets and allow alert setup.
Case Study 2: a16z MKR Distribution (July 2023)
Andreessen Horowitz (a16z), a prominent investor in MakerDAO, moved over $10 million worth of MKR tokens to Coinbase in late July 2023. MKR price fell 12.5% in the following week.
The Signal: Venture capital firms moving tokens to exchanges after significant price appreciation often signals distribution. Early detection through on-chain tracking allowed traders to reduce exposure before the decline.
Case Study 3: ETF Launch Impact (January 2024)
The spot Bitcoin ETF approval created a new on-chain dynamic:
Pre-Launch (December 2023):
- Speculation drove price from $42K to $49K
- Exchange reserves already declining
- Grayscale premium/discount indicated approval was priced in
Post-Launch (January 2024):
- "Sell the news" initially pushed price to $38K
- GBTC outflows created selling pressure
- But new ETF inflows eventually overwhelmed selling
- By March 2024, Bitcoin hit new ATH at $73K
The Lesson: Major structural changes require adapting on-chain frameworks. ETF tracking became essential overnight.
Common Mistakes to Avoid with On-Chain Analytics
Even with powerful data, traders can still lose money. Here are the critical pitfalls to avoid.
Mistake 1: Treating Metrics as Crystal Balls
On-chain metrics show probabilities, not certainties. NUPL entering the euphoria zone doesn't mean the top happens immediately-price can stay elevated for weeks or months. Use metrics for risk management and probability assessment, not precise timing.
Mistake 2: Ignoring the ETF Effect
The crypto market has evolved significantly since 2024. Some on-chain activity now occurs "off-chain" through custodial ETF solutions. Traditional metrics like exchange reserves may understate actual accumulation when institutions are buying through IBIT or FBTC rather than direct on-chain purchases.
Mistake 3: Overcomplicating Analysis
You don't need 50 metrics. Master NUPL, MVRV Z-Score, exchange flows, and ETF tracking. Add LTH/STH analysis and SOPR as you progress. Complexity often reduces rather than improves trading results.
Mistake 4: Missing the Forest for the Trees
On-chain analysis reveals long-term holder behavior and macro cycles. It's less useful for short-term day trading. If you're trading 15-minute candles, on-chain data probably won't help. If you're making decisions about whether to accumulate or distribute over weeks to months, it's invaluable.
Mistake 5: Ignoring Context
A single metric reading means nothing without context. Exchange inflows during a bull market may simply be profit-taking (healthy). The same inflows during a panic suggest capitulation (potentially bullish contrarian signal). Always ask: "What's the narrative behind this data?"
⚠ Risk Warning
On-chain analysis cannot account for black swan events, regulatory changes, or macroeconomic shocks. The UK and other jurisdictions implemented new crypto reporting rules (CARF) in January 2026. Always use proper risk management regardless of how bullish or bearish the on-chain data appears. Never invest more than you can afford to lose.
Beyond Bitcoin: On-Chain Analysis for Ethereum and Altcoins
While Bitcoin has the most robust on-chain data history, similar principles apply to Ethereum and other networks. Decentralized finance protocols on Ethereum have their own relevant metrics.
Ethereum-Specific Metrics
- ETH Staking Rate: Currently ~28% of supply staked, reducing liquid circulating supply
- Gas Fees: Indicate network demand and activity levels
- Burn Rate: Since EIP-1559, high activity = deflationary pressure
- DeFi TVL: Shows capital committed to DeFi protocols (~$80B+ ecosystem)
Smart Contract Platform Metrics
For networks like Solana, Avalanche, or Cardano, focus on:
- Active Addresses: User engagement trend
- Transaction Counts: Network usage
- Protocol-Specific TVL: Capital locked in ecosystem DeFi
- Developer Activity: GitHub commits, new contracts deployed
Understanding how smart contracts work helps interpret on-chain activity across these ecosystems.
Altcoin Analysis Cautions
⚠ Altcoin On-Chain Limitations
Most altcoins lack sufficient data history for reliable cycle analysis. Focus on: token holder concentration (whale risk), exchange flow patterns, and TVL trends. Be skeptical of altcoin-specific "NUPL" or "MVRV" metrics-they don't have the multi-cycle validation that Bitcoin metrics do.

Frequently Asked Questions
What is NUPL and how do I use it for trading?
NUPL (Net Unrealized Profit/Loss) measures the aggregate paper profits or losses of all Bitcoin holders relative to market cap. When NUPL exceeds 0.75 (euphoria zone), it historically signals market tops. When NUPL falls below zero (capitulation), it has marked generational buying opportunities. Traders use NUPL to gauge whether to accumulate or distribute their holdings based on market cycle positioning.
What is the current MVRV Z-Score and what does it indicate?
As of January 2026, Bitcoin's MVRV Z-Score sits at approximately 1.32. This indicates Bitcoin is trading at fair value with room for growth-well below the "overheated" zone above 7 that historically marks cycle tops. For comparison, the Z-Score approached 7+ during the 2017 and 2021 peaks.
Which on-chain analytics platform is best for beginners?
Start with Glassnode's free tier or Bitcoin Magazine Pro for foundational metrics like NUPL and MVRV Z-Score. Both offer educational resources explaining each metric. CryptoQuant excels at exchange flow data. Once comfortable with basics, add Arkham for wallet tracking and Dune for custom analysis.
Can on-chain analysis predict exact market tops and bottoms?
No on-chain metric can predict exact tops or bottoms. What they can do is identify high-probability zones where reversals have historically occurred. For example, NUPL entering euphoria (>0.75) doesn't mean sell immediately-it means start de-risking because major corrections have historically followed. Use metrics for risk management, not precise timing.
How do Bitcoin ETFs affect on-chain analysis accuracy?
The launch of spot Bitcoin ETFs in 2024 changed on-chain dynamics significantly. ETF holdings represent a new form of "cold storage" that doesn't appear in traditional exchange reserve metrics. With ETF AUM now exceeding $134 billion, analysts must combine traditional on-chain metrics with daily ETF flow data (available from sources like SoSoValue) for a complete picture.
What's the difference between NUPL and MVRV?
NUPL measures total unrealized profits/losses as a percentage of market cap, showing aggregate investor sentiment. MVRV compares market value to realized value (aggregate cost basis), showing whether Bitcoin is over or underpriced. Both measure similar concepts but present the data differently. MVRV Z-Score adds volatility normalization for comparing across cycles.
How do I track whale wallets and set up alerts?
Platforms like Arkham, Nansen, and Whale Alert identify and label known whale wallets (exchanges, funds, notable individuals). You can set up email, Telegram, or webhook alerts for transactions above certain thresholds. Start by tracking: major exchange hot/cold wallets, known VC wallets (a16z, Paradigm), corporate treasuries (Strategy), and foundation wallets (Ethereum Foundation).
What stablecoin metrics should I watch?
Key stablecoin metrics include: Stablecoin Supply Ratio (SSR)-low SSR means high buying power available; total stablecoin supply ($269B+ currently); USDT vs USDC flows-USDT dominance often indicates offshore/emerging market demand; and stablecoin exchange flows, where large inflows historically preceded rallies.
Do on-chain metrics work for altcoins or just Bitcoin?
On-chain analysis works best for Bitcoin and Ethereum due to their longer data history and more mature analytics infrastructure. For altcoins, the principles apply but data quality varies significantly. Focus on exchange flows, holder concentration, staking metrics, and TVL where available. Be skeptical of altcoin "cycle indicators"-they lack multi-cycle validation.
How has on-chain analysis evolved for 2026?
Major 2026 developments include: integration of ETF flow tracking alongside traditional metrics; corporate treasury wallet monitoring (Strategy, Bitmine); AI-powered wallet labeling (Arkham's Oracle); stablecoin metrics gaining importance; and regulatory reporting frameworks (CARF) affecting privacy considerations. Successful analysts now combine multiple data sources rather than relying on any single metric.
Conclusion: Integrating On-Chain Analytics Into Your Trading
On-chain analytics provides a unique edge in cryptocurrency trading-the ability to see what's actually happening on the blockchain rather than relying solely on price action or sentiment. In 2026, with $134 billion in ETF assets and MVRV Z-Score at 1.32 indicating fair value, understanding these metrics has never been more crucial.
The key principles to remember:
- Use on-chain data for macro cycle positioning rather than short-term trades
- Always seek confirmation from multiple metrics (NUPL + MVRV + exchange flows)
- Integrate ETF tracking as a core component of your analysis
- Never ignore proper risk management regardless of how bullish the data appears
- Combine on-chain insights with technical analysis and fundamental research
Start simple. Master NUPL and exchange flows before adding complexity. The goal isn't to have the most sophisticated dashboard-it's to make better trading decisions with higher probability outcomes.
Ready to Apply On-Chain Insights?
Start trading smarter with data-driven decisions on Zipmex
Start Trading Now →⚠ Disclaimer: The information provided in this article is not intended to provide investment or financial advice. Investment decisions should be based on the individual's financial needs, objectives, and risk profile. We encourage readers to understand the assets and risks before making any investment entirely. Cryptocurrency investments are subject to high market risk. Past performance does not guarantee future results. On-chain metrics are analytical tools, not predictive guarantees.
