
Kyber Network Crystal has been one of DeFi's most recognized liquidity protocol tokens since the ecosystem's early days - but reading its price chart today tells a more complicated story than the hype cycles of 2021 suggest. This KNC price prediction guide cuts through the noise: short-term technical signals, year-by-year forecasts through 2030, and a clear breakdown of the macro forces that will actually determine whether KNC recovers, consolidates, or fades further.
This analysis is structured to be useful whether you're tracking KNC for a trade entry this week or evaluating it as part of a longer DeFi portfolio thesis. What you won't find here: inflated targets with no methodology behind them, or single-number forecasts presented as certainties. Crypto price prediction involves real uncertainty - and the goal is to give you the tools to evaluate scenarios rather than feed you a headline number.
⚠ Disclaimer
Nothing in this article constitutes financial advice. Crypto trading and investing carry substantial risk of loss. All price projections are model-based estimates, not guarantees of future performance.
⚡ Key Takeaways
- Current KNC price: ~$0.139 (as of March 2026)
- Short-term technical signal: Bearish-to-neutral - KNC is trading below both its 50-day and 200-day moving averages
- 2026 forecast range: Conservative $0.12-$0.15 | Optimistic $0.25-$0.32
- Primary price drivers: Bitcoin macro cycle, DeFi TVL trends, KyberSwap trading volume, KyberDAO governance activity
- Long-term outlook: Heavily dependent on Kyber Network's ability to maintain DEX aggregator relevance in a crowded market
- This is not financial advice - use all projections as one input among many
What Is KNC (Kyber Network Crystal)?
KNC - Kyber Network Crystal - is the native ERC-20 governance and utility token powering Kyber Network, one of DeFi's foundational on-chain liquidity protocols. If you've swapped tokens on-chain and received a better rate than the single DEX you visited would have offered, there's a reasonable chance Kyber's infrastructure was working somewhere in the routing stack behind that trade.
The current version, KNC v2, replaced the original token in April 2021 via a migration. Today it serves three primary functions: governance rights within KyberDAO, fee payment within the KyberSwap ecosystem, and staking for protocol revenue sharing. Understanding these mechanics matters for price prediction because each one creates a direct link between platform usage and token demand.
For verified current circulating supply and max supply figures, always check CoinMarketCap or the official KyberDAO dashboard at time of reading - these numbers change as burns occur.
How Does Kyber Network Work?
Kyber Network operates as an on-chain liquidity aggregator. Rather than maintaining a single liquidity pool like a traditional AMM, it queries multiple DEX sources simultaneously and routes your token swap through whichever path delivers the best effective price. Think of it like a price-comparison engine built directly into the blockchain - you submit a swap, and Kyber's smart contracts on Ethereum handle the routing and settlement automatically.
KyberSwap is the primary user-facing interface where this happens. It aggregates sources across multiple chains, not just Ethereum, and has expanded into a multi-chain protocol covering networks like BNB Chain, Polygon, Arbitrum, and others. The on-chain execution model means every trade is verifiable - there's no black box determining your rate.
How a KyberSwap swap executes:
- User initiates a token swap request on KyberSwap
- Smart contracts query multiple DEX liquidity sources simultaneously
- Kyber's routing algorithm identifies the optimal path for best output amount
- Transaction executes on-chain through Ethereum (or applicable L2/altchain) smart contracts
- User receives tokens in their self-custody wallet - Kyber never takes custody
KNC Token Use Cases and Tokenomics
Three mechanisms connect KNC's economic model to platform activity:
The burn mechanism is the one most relevant to price prediction modeling. When KyberSwap volume rises, more fees accumulate, more KNC gets burned, circulating supply decreases, and - assuming demand holds - price faces upward pressure. The reverse is equally true: declining volume shrinks burn rate and removes this supply-side support.
KNC Price Prediction: Short-Term Forecast (Today, This Week, Next 30 Days)
At the time of this analysis, KNC is trading around $0.139. Short-term models applying a 5% annualized growth assumption - the baseline used by most prediction aggregators for dormant or consolidating tokens - project minimal movement over the next 30 days.
These projections are derived from applying current growth rate assumptions to today's price baseline. They reflect the model input, not a fundamental view on KNC's near-term trajectory.
These short-term projections are grounded in the technical indicator signals described below. The wide min-max range reflects KNC's historical intraday volatility - even in consolidation phases, 10-15% swings in either direction are normal. The technical picture right now leans bearish to neutral, which informs why the average projections show minimal upside without a catalyst.
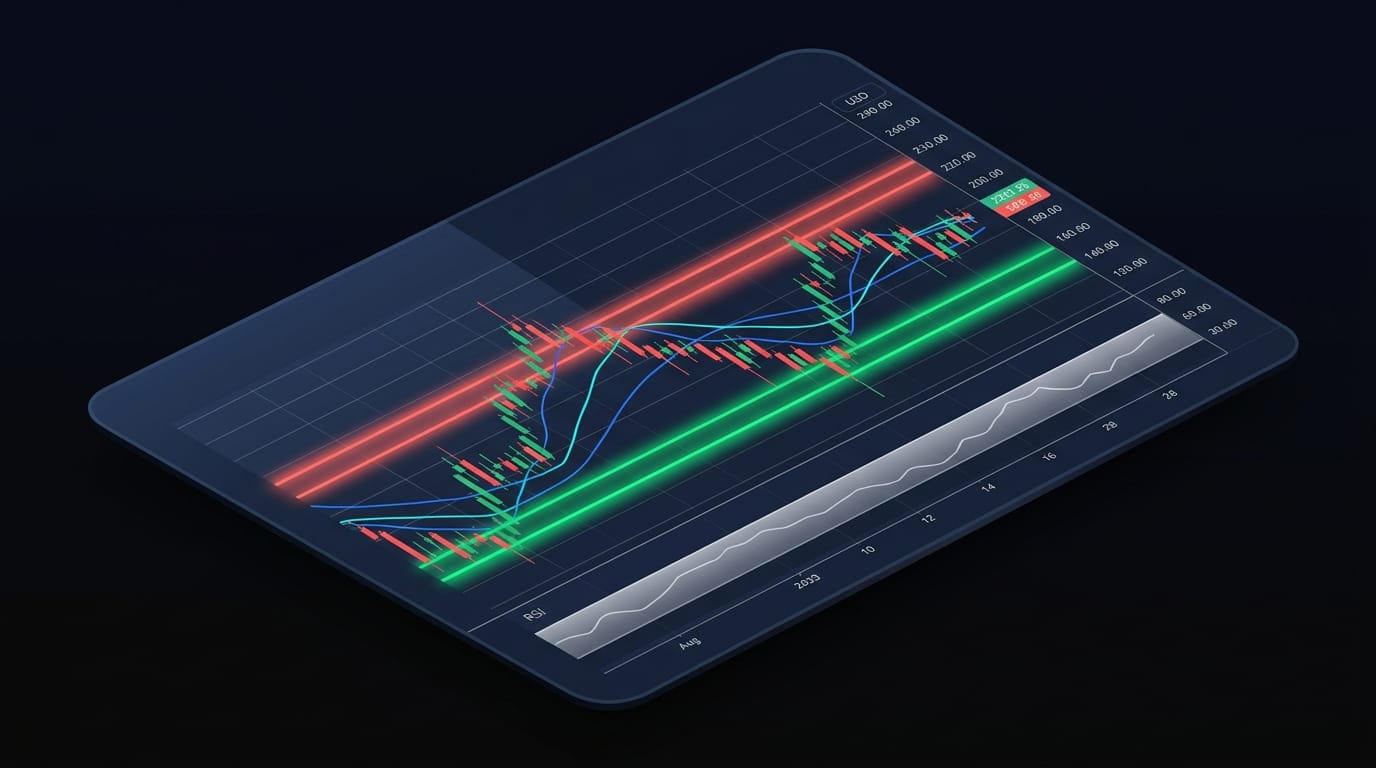
KNC Technical Analysis: Current Market Indicator Snapshot
Running the current chart through the five primary technical frameworks gives a mixed but mostly cautious picture for KNC.
Moving Averages are the clearest signal. KNC is trading below both its 50-day and 200-day moving averages - a bearish configuration on the daily timeframe. The 50-day SMA sits around $0.141, the 200-day SMA around $0.246. Price is significantly below both, which means those averages act as overhead resistance on any recovery attempt, not support. Until KNC reclaims the 50-day SMA with sustained volume, the trend structure remains weak.
RSI(14) reads approximately 51.6 on the daily chart - right in the neutral 40-60 zone. That's not oversold (which would be a potential reversal signal), and not overbought. It says the token is in directionless consolidation, with neither strong buying nor selling pressure dominating. There's a mild bearish divergence visible on shorter timeframes, which is a secondary signal worth watching for entries.
MACD on the weekly timeframe shows no clear bullish or bearish divergence - the histogram is flat. That's consistent with the RSI neutral reading. No strong momentum shift is signaled yet.
Bollinger Bands (20-period, 2 standard deviation) currently show KNC trading in the middle of the band on the daily chart. Neither band squeeze nor breakout condition is present. This reinforces the consolidation thesis.
Fibonacci Retracement levels from the most recent major price swing identify the key zones detailed in the table below:
The consolidated read: bearish trend structure on the daily and weekly, with neutral momentum. KNC isn't crashing, but it's not recovering either. A sustained close above $0.141 (the 50-day SMA) with elevated volume would shift the short-term picture meaningfully.
KNC Price Prediction 2026-2030: Long-Term Yearly Forecast
Long-term KNC price prediction depends on three macro factors more than any technical signal: Bitcoin's halving cycle trajectory, the health of the DeFi ecosystem, and Kyber Network's ability to maintain competitive relevance as a DEX aggregator in an increasingly crowded space.
Bitcoin's 2024 halving historically triggers an altcoin expansion phase 12-18 months post-halving - that cycle peak would land somewhere in 2025-2026, which explains why most prediction models show elevated 2026 targets before projecting a correction in 2027. Whether KNC participates in that expansion depends significantly on whether DeFi TVL recovers to 2021 levels and whether KyberSwap maintains meaningful market share.
⚠ Forecast Disclaimer
The table below aggregates model-based projections from multiple prediction methodologies. These are scenarios, not guarantees. Actual price outcomes will depend on market conditions, protocol developments, and macroeconomic forces that no model reliably predicts.
The wide min-max ranges here aren't a cop-out - they accurately reflect genuine model disagreement. For a token with KNC's market cap size and its dependence on DeFi sector conditions, the range of plausible outcomes over five years is genuinely wide.
KNC Price Prediction 2026
2026 is where prediction platforms diverge most sharply, and understanding why is more valuable than picking one number to believe.
Bullish 2026 scenario: Post-halving altcoin momentum carries DeFi tokens higher through Q1-Q2 2026. KyberSwap sees volume growth as DeFi TVL recovers. Increased protocol activity drives higher KNC burn rates, tightening circulating supply. Optimistic targets cluster around $0.25-$0.32. Multiple aggregator models show April 2026 max estimates in the $0.30+ range.
Bearish 2026 scenario: Bitcoin rally stalls earlier than expected. DeFi continues ceding market share to centralized alternatives. KNC remains trapped below the 200-day moving average. Conservative models show KNC trading in the $0.12-$0.15 range for most of the year.
Why platforms disagree: Short-term technical models (which feed most monthly prediction tables) conflict with longer-term fundamental adoption models. Technical models see a bearish trend structure and extrapolate it forward. Fundamental models factor in halving cycle dynamics and DeFi growth curves. Both inputs are valid - they're answering different questions.
Note: The table above reflects conservative 5% annualized growth model projections. Bullish scenarios driven by halving cycle dynamics could produce materially higher outcomes - and bearish scenarios could undershoot.
KNC Price Prediction 2027-2030
2027 presents the most challenging scenario for most altcoin models. Historically, the 18-24 months following a halving cycle peak sees significant corrections across the altcoin market. If 2026 represents a cycle top for KNC, 2027 could see the token retracing a substantial portion of any gains.
2027: Most models project significant downside from a 2026 peak. Conservative models show KNC falling toward $0.01-$0.05 during a prolonged bear market. The critical question is whether KyberDAO governance and continued KyberSwap protocol development can maintain community engagement through the downturn - historically, projects that keep building during bear markets outperform on the recovery.
2028-2029: Recovery and consolidation phase. Assuming the DeFi sector doesn't face a structural collapse, 2028-2029 should see KNC recovering toward the $0.08-$0.22 range as the next halving cycle (2028) approaches. KyberDAO protocol upgrades planned for this period could act as additional catalysts. Competition from other DEX aggregators remains the primary headwind.
2030: The 2030 forecast is the most speculative but also the most searched target. Bullish scenarios envision DeFi reaching mainstream adoption, with on-chain liquidity protocols like Kyber Network capturing a share of global trading volume - supporting KNC prices above $0.30. Bearish scenarios account for Kyber being displaced by next-generation protocols. The honest answer is that 2030 projections carry enormous uncertainty in either direction.
KNC Price Prediction 2035, 2040, and 2050
Projecting crypto prices at 10-25 year horizons should be treated as thought experiments, not forecasting. With that framing clearly established, here are the scenarios:
The gap between conservative and optimistic estimates is this wide because the models rely on fundamentally different assumptions about DeFi's long-term trajectory and whether Kyber Network remains a competitive force. Treat any ultra-long-term KNC price prediction as a framework for thinking about scenarios - not a target to build a position around.
What Factors Drive KNC Price? Key Market Influencers
Six interconnected forces shape KNC's price in practice. Understanding Bitcoin's role is the starting point, but the picture is more layered than a single correlation:
- Bitcoin's macro cycle - KNC amplifies Bitcoin's directional moves. In bull markets, KNC historically outperforms BTC on the way up; in bear markets, it underperforms on the way down. This leverage effect is typical for small-to-mid-cap altcoins and means timing relative to Bitcoin's cycle is as important as any KNC-specific analysis.
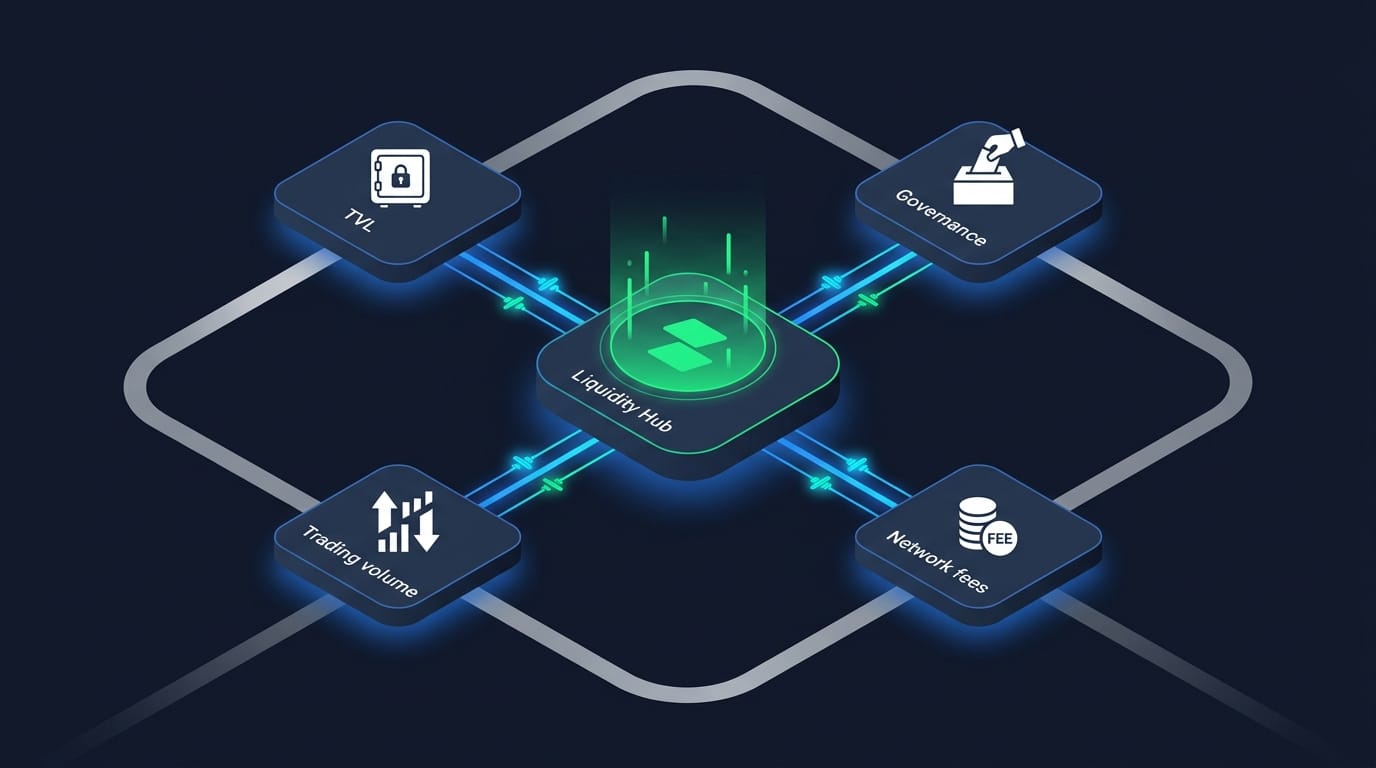
- DeFi Total Value Locked (TVL) - Rising DeFi TVL drives more activity across DEXs and aggregators, which flows directly into KyberSwap volume. Higher volume → more protocol fees collected → larger KNC burns → deflationary supply pressure. The reverse chain - declining TVL → shrinking volume → reduced burns → weakening supply-side support - is equally mechanical.
- KyberSwap protocol metrics - Trading volume, unique active wallets, and dApp integration count are the most direct on-chain indicators of KNC's fundamental health. These are publicly verifiable on-chain, which is one of the advantages of analyzing a DeFi protocol over a centralized project.
- KyberDAO governance decisions - Changes to fee distribution percentages, protocol upgrade timelines, or new feature launches voted through KyberDAO affect both tokenomics and market sentiment. Monitor KyberDAO proposal activity as a leading indicator of protocol trajectory.
- Regulatory environment - DeFi protocols face increasing regulatory scrutiny globally. Jurisdictions that classify on-chain DEX activity as regulated financial activity could restrict KyberSwap's accessibility, directly affecting volume and KNC demand.
- Ethereum network performance - KNC's primary deployment is on Ethereum. High gas fee periods increase the cost of KyberSwap transactions, reducing volume for smaller trades. Ethereum scaling improvements (L2 rollups, EIP upgrades) can expand the addressable user base for KyberSwap and, by extension, KNC demand.
How to Use KNC Price Predictions in Your Trading Strategy
Price predictions are a starting point, not a signal. Here's how to actually use this data:
1. Separate short-term technical signals from long-term fundamental projections. The monthly price tables in this article reflect technical trend extrapolation. The 2030 forecast reflects fundamental adoption scenarios. Use each for the appropriate decision - short-term technical signals for entry/exit timing, fundamental scenarios for position sizing and allocation conviction.
2. Cross-reference indicators before acting. A single indicator pointing bullish isn't an entry signal. Before trading a KNC position, look for RSI recovering from oversold territory, Moving Averages starting to slope upward, and MACD showing a bullish histogram crossover - directional alignment across multiple indicators. One signal is noise. Three aligned signals are worth considering.
3. Use Fibonacci levels and Support/Resistance for trade mechanics. For KNC specifically, $0.132 (S1) and $0.126 (S2) represent current support levels worth monitoring as potential long entries. $0.141 (R1, the 50-day SMA) and $0.146 (R2) are resistance levels where profit-taking or stop-loss placement makes sense for short-term trades.
4. Size positions relative to volatility. KNC's relatively small market cap means 20-30% intraday moves are plausible during high-volatility periods. A position size appropriate for BTC trading is not appropriate for KNC. Apply the 1-2% max risk per trade rule - define your stop-loss placement first, then work backward to determine position size.
5. Define your exit before your entry. Set a target and a stop before opening any position. A realistic risk-reward ratio for a KNC trade based on current levels: risking $0.132 (S1 support) on a long entry at $0.139, targeting $0.155 (above R2) gives you approximately 1:2.3 risk-reward. That's tradeable.
📊 Risk Management Example
No prediction methodology - including everything in this article - tells you what KNC will actually do. Treat predictions as scenario maps, not GPS directions.
Risks and Red Flags: What KNC Price Predictions Don't Tell You
Every price prediction table shows you a range of outcomes. None of them model the events that matter most.
⚠ Key Risk Factors When Trading KNC
- Prediction inaccuracy → No algorithm reliably forecasts crypto prices. Historical backtesting shows most prediction models fail during black-swan events - and crypto has had several. Use multiple frameworks; trust none completely.
- Black swan vulnerability → Smart contract exploits, exchange insolvencies, regulatory crackdowns, or macro shocks can invalidate any forecast within hours. KNC has experienced these types of sector-wide events before.
- Competitive displacement → KyberSwap competes in a crowded DEX aggregator market. Loss of market share to competing protocols would directly reduce KNC burn volume and protocol revenue distributed to stakers.
- Liquidity risk → KNC's market cap is modest relative to large-cap crypto assets. This means relatively small sell orders can create outsized price impact. Entering or exiting large positions requires care.
- Regulatory risk → DeFi protocols face increasing global regulatory pressure. Any restriction on KyberSwap's accessibility in major markets would materially affect volume and KNC price.
One risk that price tables systematically understate: the correlation between prediction platform estimates and actual outcomes degrades rapidly beyond 3-month horizons. 2030 KNC price prediction models have essentially no empirical basis - they're extrapolations from assumptions, not evidence-based forecasts. Holding that distinction clearly in mind prevents overconfidence in any long-term projection.
KNC Alternatives: Similar DeFi Tokens to Consider
If you're evaluating KNC as part of a broader DeFi liquidity protocol thesis, these are comparable tokens worth understanding alongside the 0x protocol, which operates a similar DEX aggregator model. The profiles below reflect project characteristics rather than price targets.
Each of these tokens faces similar macro forces to KNC: DeFi TVL correlation, Bitcoin cycle dependence, and governance token valuation uncertainty. None of them should be positioned without appropriate risk management, and each carries the same category-level risks described in the previous section.
Conclusion: Should You Consider KNC in 2026 and Beyond?
The honest assessment of KNC right now: technically weak in the near-term, fundamentally dependent on DeFi's next expansion phase, and highly speculative beyond 12 months. That doesn't make it uninvestable - it makes it a position that requires a clearly defined thesis and strict risk management.
For short-term traders: The current technical setup - price below both the 50-day and 200-day moving averages, neutral RSI, flat MACD - doesn't present a compelling entry from a momentum perspective. Watch for a sustained reclaim of the $0.141 SMA50 level with volume confirmation before considering a long position. Stop-losses belong below $0.126 in any bullish scenario.
For long-term holders: If you believe DeFi TVL will recover materially during the 2026-2028 period, KNC's burn mechanism means that recovery gets transmitted directly to supply dynamics. The thesis requires conviction on two things: that DeFi grows, and that KyberSwap maintains meaningful share within it. Monitor on-chain metrics - KyberSwap volume, KyberDAO governance participation, and protocol TVL - as leading indicators of whether the fundamental thesis is playing out.
For risk-averse participants: KNC's market cap size and DeFi-sector concentration make it unsuitable as more than a small speculative allocation - typically 1-5% of a diversified crypto portfolio for those with high risk tolerance. It is not appropriate as a core holding without a thorough understanding of DEX aggregator mechanics and DeFi market dynamics.
If DeFi adoption accelerates, if KyberDAO delivers its planned protocol upgrades, and if Bitcoin's macro cycle provides the tailwind that historical cycles suggest, KNC could trade significantly above current levels by 2027-2028. If those conditions don't materialize, the conservative models showing further downside are equally plausible.
Position accordingly.
⚠ Final Disclaimer
Crypto trading involves substantial risk of loss. All price projections in this article are model-based scenarios, not investment advice. Past performance of any cryptocurrency does not predict future results. Always do your own research before making any financial decision. Last updated: March 2026.
Frequently Asked Questions
What is the KNC price prediction for today?
The current KNC price is approximately $0.139, and short-term models suggest minimal movement within the next 24 hours - projecting a range of $0.125 to $0.153 for today's session. These estimates apply a conservative annualized growth assumption to the current price and don't account for any sudden market catalyst or news event. On shorter timeframes, KNC is showing neutral RSI and flat MACD, consistent with a token in consolidation rather than trending phase. Always verify the live price directly on a DEX aggregator or exchange before any trade.
What is the KNC price prediction for 2026?
The 2026 KNC price prediction varies significantly between models. Conservative projections following current trend extrapolation place KNC in the $0.12-$0.17 range for most of the year. Optimistic models, which factor in Bitcoin halving cycle effects and DeFi TVL recovery, show potential highs toward $0.30-$0.32 during a bull market peak. The honest answer is that both scenarios are plausible - the difference comes down to whether the 2024 halving cycle delivers altcoin tailwinds strong enough to lift smaller DeFi tokens.
What is the KNC price prediction for 2027?
2027 is where prediction models diverge most dramatically. Most technical extrapolation models show KNC declining significantly from any 2026 peak, with some conservative estimates placing the price below $0.05. Historically, the 12-24 months following a halving cycle peak produce sharp altcoin corrections. However, if Kyber Network continues protocol development through a bear phase and KyberSwap maintains trading volume, the correction may be shallower than models based purely on price momentum suggest. The $0.01-$0.17 range reflects genuine uncertainty about how deep any 2027 downturn could go.
What is the KNC price prediction for 2030?
The 2030 KNC price prediction is one of the most searched targets and one of the least reliable to model. Projections range from $0.10 on the conservative end to $0.35 for optimistic scenarios. The core question for 2030 is whether Kyber Network remains one of DeFi's relevant liquidity infrastructure protocols or gets displaced by next-generation alternatives. If DeFi scales to mainstream adoption volumes, the fee-burning KNC model could support materially higher prices.
What factors most influence KNC price movements?
Six primary factors drive KNC price: Bitcoin's halving cycle (KNC amplifies BTC directional moves); DeFi TVL (directly correlates with KyberSwap volume and KNC burn rate); KyberSwap protocol metrics (trading volume and active integrations are the best on-chain fundamental indicators); KyberDAO governance (major protocol changes affect tokenomics); regulatory environment (DeFi-specific regulations represent systemic risk); and Ethereum network conditions (gas fees and throughput affect KyberSwap's accessible user base).
What are the main risks of investing in KNC?
The main risks when trading or holding KNC include prediction inaccuracy (no model reliably forecasts crypto prices, especially beyond 3-month horizons); smart contract and protocol risk; competitive displacement (other DEX aggregators could capture KyberSwap's market share); liquidity risk (KNC's moderate market cap means large orders create outsized price impact); and regulatory risk (DeFi protocols globally face increasing regulatory scrutiny). Crypto trading involves substantial risk of loss and KNC is not suitable for risk-averse investors.
What is the KNC all-time high price?
According to CoinGecko, Kyber Network Crystal (KNC v2) reached its all-time high of $5.70 in 2022. Current prices around $0.139 represent a decline of over 97% from that peak - a pattern common across DeFi governance tokens that saw extreme valuations during the 2020-2021 bull cycle. Whether KNC can recover a meaningful fraction of those levels depends almost entirely on whether the next DeFi expansion cycle reaches 2021-comparable TVL and trading volumes.
