
The LRC price prediction landscape in 2026 looks complicated - and that's putting it diplomatically. Loopring's token is trading near multi-year lows, its RSI has dipped into oversold territory, and most moving averages are pointing firmly south. Yet the underlying technology - zkRollup-based Layer-2 scaling - is arguably more relevant to Ethereum's future than ever.
This guide breaks down everything: year-by-year forecasts from 2026 through 2050, current technical indicator readings, the key catalysts that could reverse the trend, and honest risk assessment before you commit capital to LRC.
⚡ Key Takeaways
- LRC is currently trading at approximately $0.025, roughly 99% below its all-time high of $3.75 (November 2021)
- The dominant short-term technical signal is bearish - LRC trades well below its MA50 ($0.034) and MA200 ($0.059)
- RSI(14) at ~24.6 places LRC in oversold territory, which historically precedes mean-reversion bounces but is not a buy signal on its own
- Most analyst consensus for end-2026 clusters in the $0.03-$0.08 range, with wide variance depending on macro conditions
- ⚠ Critical: Binance has announced delisting of LRC spot pairs effective April 1, 2026 - a significant liquidity risk factor
- This is not financial advice - LRC carries above-average risk for an already-volatile asset class
Last updated: March 19, 2026.
What Is Loopring (LRC)? A Quick Overview Before the Numbers
Before the charts and tables, it's worth spending a moment on what you're actually analyzing. Loopring isn't just another speculative altcoin - it's a protocol with genuine technical architecture. Whether that architecture translates to price appreciation is a different question, but understanding the project is non-negotiable for informed forecasting.
Loopring is an Ethereum Layer-2 protocol built on zkRollup technology, founded in 2017 by Daniel Wang. Its core purpose is enabling fast, low-cost decentralized exchange trading and token transfers without sacrificing Ethereum's security guarantees. At its peak in 2021, Loopring powered one of the few genuinely functional Layer-2 DEXes on Ethereum, long before the current L2 ecosystem matured. At its core, this is part of the broader ecosystem of decentralized finance (DeFi) - trustless, non-custodial, on-chain financial infrastructure.
The picture in 2026 is more complicated. Loopring's smart wallet operations were impacted following a security incident that forced the temporary suspension of Guardian and 2FA operations, and the protocol has been repositioning - a fact that's weighed heavily on sentiment and TVL. This context matters for every number in the sections that follow.
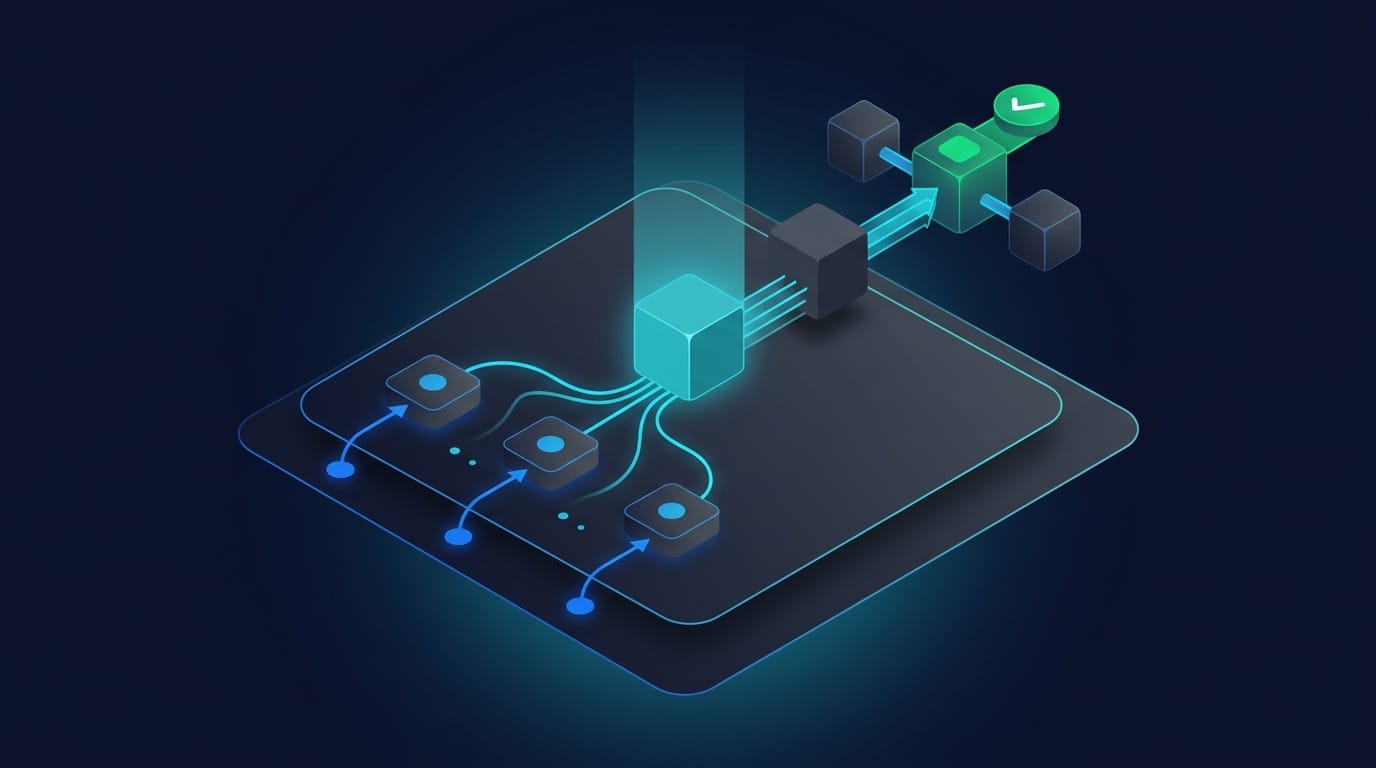
How zkRollup Technology Powers Loopring
zkRollup is the mechanism that makes Loopring technically interesting. Here's the simplified version: instead of processing each transaction individually on Ethereum mainnet (where gas fees are expensive and throughput is capped), Loopring batches hundreds of transactions off-chain, generates a cryptographic zero-knowledge proof that all those transactions are valid, and submits only that compact proof to Ethereum L1.
The result is dramatically lower fees and higher throughput while preserving Ethereum's security model. The analogy I like: it's proving you know the correct answer without revealing how you got there. The Ethereum network doesn't need to re-execute every transaction - it just verifies the proof. Notably, Vitalik Buterin himself has invested in ZK-rollup companies such as StarkWare, viewing ZK proofs and Layer-2 scaling as critical Ethereum infrastructure.
This same ZK-rollup category now powers zkSync Era, StarkNet, and Polygon zkEVM - which contextualizes both Loopring's early-mover advantage and its current competitive pressure. Ethereum's Dencun upgrade (EIP-4844 with blob transactions) reduced data availability costs for all rollups, which is a meaningful tailwind for ZK-based protocols - including Loopring, if it can recapture developer and user attention.
LRC Token Utility and Tokenomics
LRC has three core utility functions within the protocol:
- Fee payment - users pay trading fees in LRC on the Loopring DEX
- Staking for protocol insurance - LRC stakers backstop the insurance fund and earn a portion of protocol fees
- Governance - LRC holders participate in Loopring DAO decisions on protocol parameters
According to Loopring's protocol documentation, the fee split on AMM swaps runs at 0.25% total - with 0.15% going to liquidity providers and 0.1% to the L2 relayer. This creates a demand driver tied directly to platform trading volume - which is where the current problem lies. Lower DEX activity means lower fee generation, which means lower organic buying pressure for LRC.
CoinMarketCap data confirms a circulating supply of approximately 1.37 billion LRC out of a maximum supply of 1.374 billion - meaning roughly 99.6% of all LRC is already in circulation. Minimal future emission removes one common bearish catalyst. The tokenomics themselves aren't the bearish thesis - the bearish thesis is declining usage. Any meaningful recovery needs trading volume to come back first.
LRC Price Prediction 2026-2050: Year-by-Year Forecast
Price predictions for any cryptocurrency involve a baseline level of uncertainty. For LRC specifically - a token trading 99% below its all-time high of $3.75 with declining on-chain activity - the range of outcomes is exceptionally wide. The figures below represent aggregated analyst consensus patterns from models published in early 2026; treat them as scenario frameworks rather than targets.
LRC Price Prediction 2026
The 2026 LRC price prediction hinges almost entirely on two variables: whether Bitcoin's post-halving momentum flows into mid and small-cap altcoins, and whether Loopring manages to announce meaningful protocol developments that re-engage its user base.
Analyst models for 2026 generally fall into one of two camps:
Bull case ($0.06-$0.085): Bitcoin's cycle drives an altcoin rotation, ZK-rollup narrative heats up as Ethereum scaling conversations continue, and Loopring captures some of that attention. LRC breaks above its MA50 ($0.034) and reclaims the $0.05-$0.06 zone.
Bear case ($0.012-$0.020): Broader crypto enters a risk-off phase, LRC's declining TVL narrative persists, and the Binance delisting (April 1, 2026) reduces liquidity further - without a clear product catalyst, the token continues to fade against stronger L2 competitors.
LRC Price Prediction 2027 and 2028
The medium-term picture is where the ZK-rollup thesis either pays off or fades into irrelevance.
By 2027, the Ethereum ecosystem will likely have settled into a cleaner Layer-2 hierarchy. If Loopring has survived and found a differentiated niche - whether in NFT infrastructure, gaming, or a pivot application - the 2027 range of $0.020-$0.14 reflects genuine optionality. If the protocol has continued losing ground to Arbitrum, zkSync, and Optimism without a product response, the lower end of that range becomes the base case.
2028 is the year most models assign peak-cycle positioning. The historical pattern of Bitcoin halving cycles (2016, 2020, 2024) places 2028 near the tail end of the next mid-cycle bull phase. LRC's 2028 range of $0.028-$0.22 reflects that macro tailwind, but with a significant asterisk: altcoins in declining fundamental health often get left behind even in bull markets.
LRC Price Prediction 2029-2030
2030 is the most-searched long-horizon target in this space, and the forecasts here carry the widest divergence.
🐂 BULL CASE 2030
Target: $0.30-$0.45
Loopring has maintained technological relevance, DeFi has matured into a mainstream financial layer, and ZK-proof technology underpins a broader ecosystem. From current prices, hitting $0.45 would represent roughly an 18x return. Possible over a 4-year horizon - not probable.
🐻 BEAR CASE 2030
Target: $0.045-$0.08
The protocol has been eclipsed by better-funded competitors, the team has pivoted or reduced activity, and LRC trades as a legacy token with a small loyal user base. Still above current prices, but a fraction of the bull case.
Forecasting 5+ years in crypto is closer to scenario writing than analysis. That's not defeatism - it's honesty.
LRC Price Prediction 2040 and 2050 - Long-Term Scenarios
⚠ Speculative Horizon Disclaimer
- 2040 and 2050 projections → highly speculative scenarios, not analytical forecasts
- 15-year crypto modeling → no meaningful accuracy; use as scenario framework only
- All figures → past price cycles do not guarantee future performance
If Ethereum remains the dominant smart contract platform through 2040, and ZK-rollup technology becomes the standard execution layer for on-chain applications, Loopring could trade in the $0.30-$1.20 range. For 2050, a $0.55 average assumes near-continuous compound growth; the $3.00 maximum requires an entirely different protocol, market structure, and adoption environment than what exists today.
For near-term traders, the technical picture is more actionable than any 20-year forecast.
LRC Price Prediction - Complete Reference Table
ROI calculated from ~$0.025 entry price. Scenario projections only - crypto investing carries substantial risk of loss.
LRC Short-Term Price Prediction: Today, This Week, and Next 30 Days
Short-term LRC predictions are messier than the year-by-year forecasts because the signal noise is higher at daily and weekly timeframes. Right now, the dominant technical bias is bearish with a caveat: RSI at ~24.6 is historically oversold, and KDJ indicators show a nascent bullish crossover attempting to form.
Short-term predictions in this range should be treated as volatility brackets, not price targets. A token with an RSI at 24.6 and trading 27% below its MA50 can stay oversold longer than most traders expect.
30-Day LRC Price Forecast and Key Levels to Watch
The most important price levels for LRC over the next 30 days come from both classical pivot analysis and moving average positioning:
A close above $0.0275 would shift the short-term bias toward cautious neutrality. Reclaiming $0.034 (MA50) would be the first signal of trend repair. Below $0.022, the next meaningful support sits near $0.019 - the lower end of most 2026 bear case models.
How to Buy LRC - Getting Started with Loopring in 2026
If you've done your research and want exposure to LRC, the process is straightforward. Most major exchanges list the token with reasonable liquidity - though the Binance delisting effective April 1, 2026 means you'll want to verify the current exchange landscape before acting.
Step-by-step buying guide:
- Choose an exchange - check current LRC/USDT listings on Bybit, OKX, MEXC, KuCoin, and others. With Binance removing LRC spot pairs, verify liquidity depth on your preferred venue first.
- Create and verify your account - standard KYC (identity verification) is required on all centralized exchanges.
- Deposit funds - fund via bank transfer, card, or crypto transfer. USDT is the most liquid base pair.
- Search for the LRC/USDT pair - use a limit order for a specific target entry; market orders work for immediate fills.
- Place your order - decide between a spot purchase or a derivatives position depending on your strategy.
- Consider self-custody - withdrawing to a non-custodial wallet like MetaMask removes exchange counterparty risk.
Self-custody note: Loopring's native L2 wallet at loopring.io allows you to hold and transfer LRC within the Loopring ecosystem directly - keeping your assets within the protocol you're backing.
Only invest capital you can afford to lose entirely. LRC is a high-volatility asset with project-specific risks.
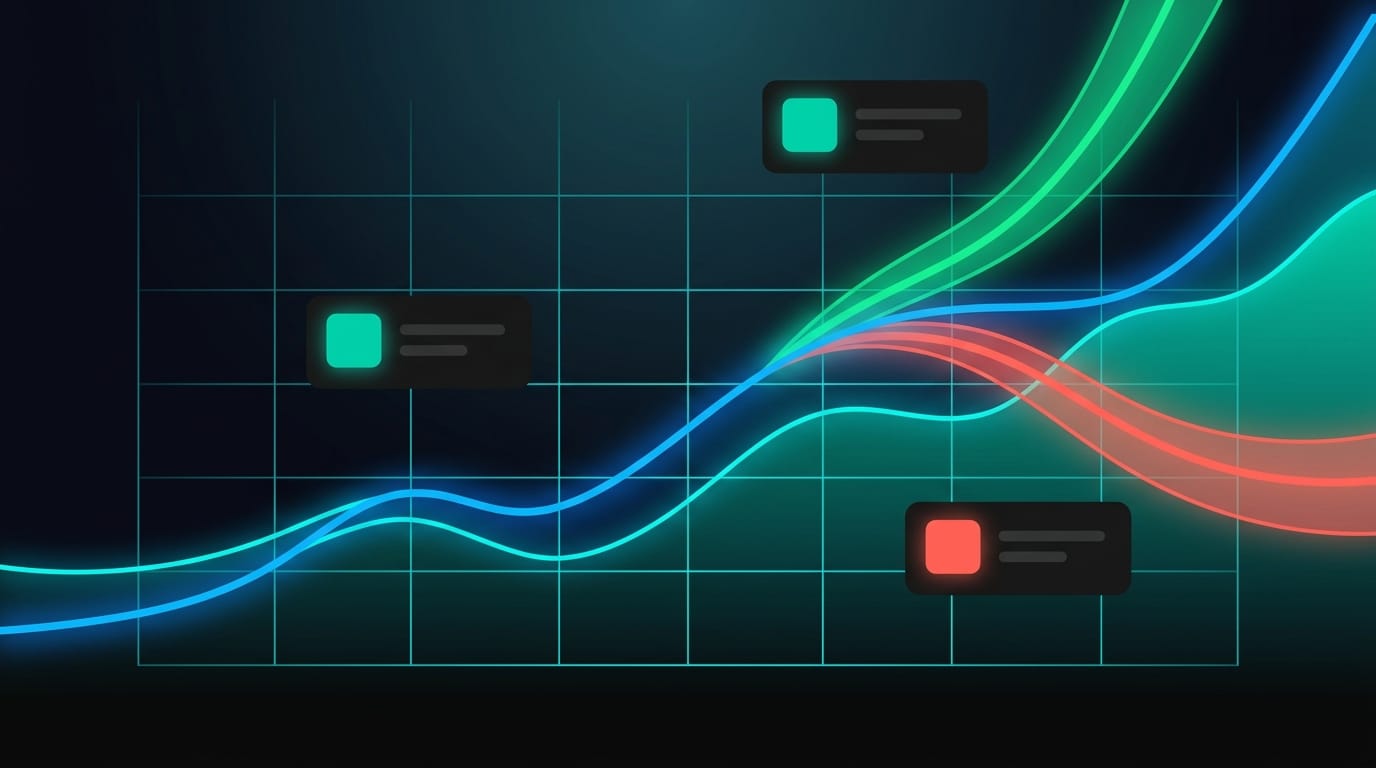
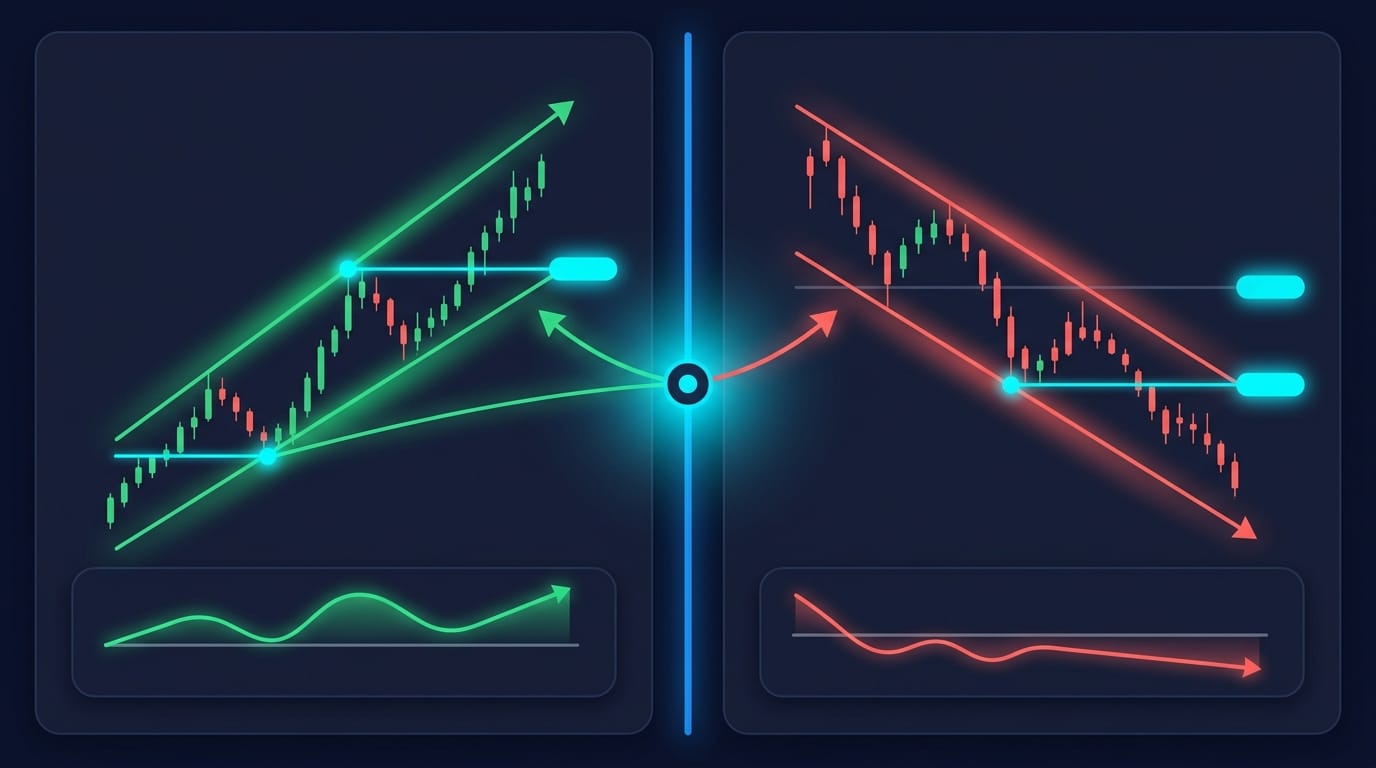
LRC Technical Analysis: What the Charts Say Right Now
The current LRC technical picture is one of the more interesting setups in the mid-cap altcoin space - not because it's bullish, but because of the divergence between trend indicators and momentum indicators. The trend is bearish. The momentum indicators are starting to hint at exhaustion of that selling pressure.
Moving Averages and Trend Analysis
LRC is trading approximately 27% below its MA50 ($0.034) and 57% below its MA200 ($0.059). Both metrics confirm a firmly bearish trend structure. Per CoinGecko's live data, LRC's short-term averages remain well above current price - a classic extended downtrend formation.
- MA50 ($0.034): Short-term trend line acting as resistance. A sustained close above this level would be the first meaningful sign of trend repair.
- MA200 ($0.059): Long-term benchmark. When price trades below the MA200, this level acts as resistance in any recovery attempt.
- EMA50 / EMA200: EMA variants give more weight to recent price action. Both remain above current price, confirming the bearish structure.
A Death Cross (MA50 crossing below MA200) has already occurred and is confirmed. The reverse - a Golden Cross - would require MA50 crossing back above MA200, which at current levels would take a significant and sustained rally.
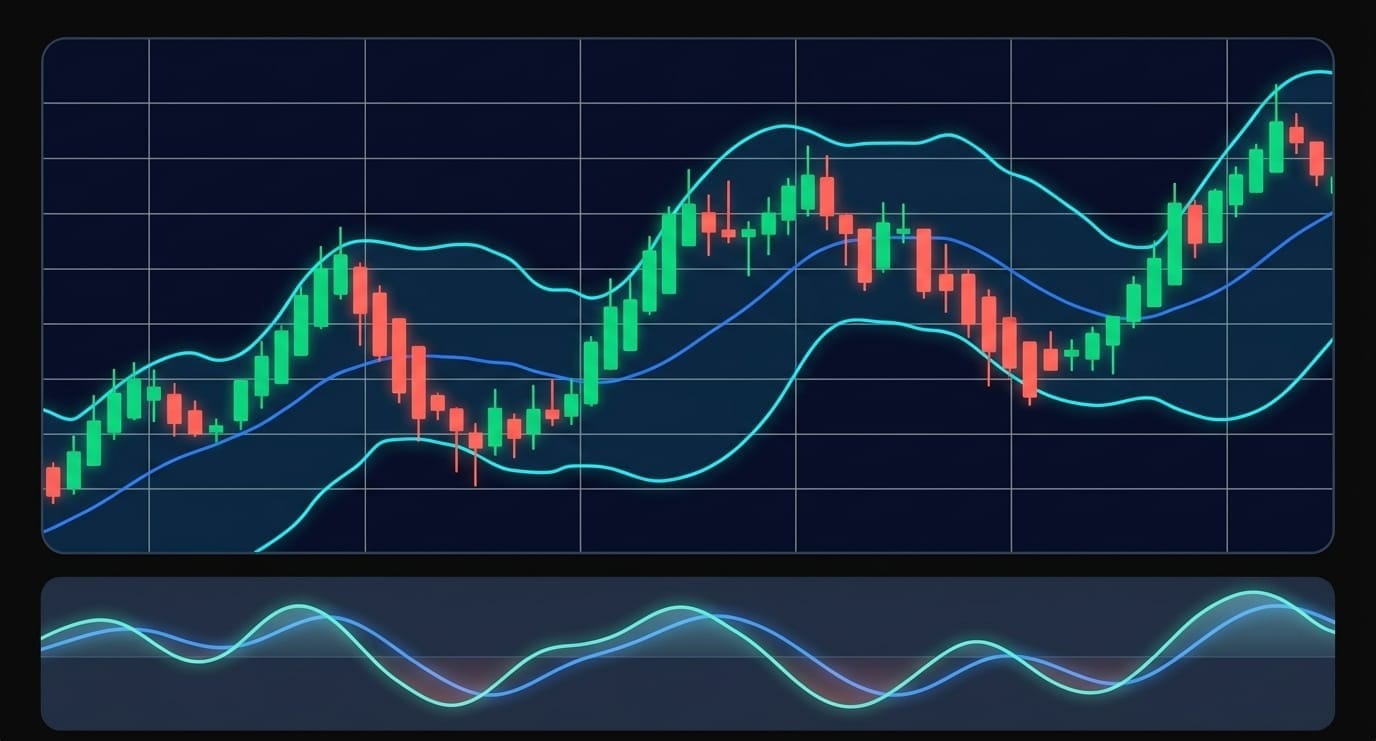
RSI, MACD, Bollinger Bands, and Momentum Indicators
Here's where the setup gets interesting - if you're a contrarian.
RSI(14) at 24.6: RSI below 30 is technically oversold. This doesn't mean a bounce is imminent, but it does mean selling pressure has been extreme. In LRC's history, RSI readings in the 20-28 range have often preceded short-term mean-reversion bounces of 20-40%. The caveat: in sustained downtrends, assets can trade oversold for extended periods.
MACD: Currently below the signal line, confirming bearish momentum. Watch for a MACD crossover - that would be more significant if combined with an RSI recovery above 35.
Bollinger Bands (20,2): LRC is trading near the lower Bollinger Band. When price hugs the lower band for multiple sessions, a mean-reversion toward the middle band (approximately MA20) is statistically common. This is a neutral-to-bullish divergence signal in an otherwise bearish setup.
KDJ (9,3,3): K=27.1, D=24.2, J=32.8. The K line crossing above D - as appears to be forming - is a bullish momentum crossover signal when it occurs from oversold levels.
StochRSI: K=14.6, D=30.3. Momentum is still fading here. The signal needs confirmation from price action.
Summary: the trend is bearish, but multiple momentum indicators are in or approaching oversold/exhaustion zones. A short-term bounce is plausible; a trend reversal requires fundamentals to back it up.
Key Factors Driving LRC Price in 2026 and Beyond
Technical analysis tells you where the price is - fundamentals tell you where it might go. For LRC specifically, the gap between those two answers is substantial. Understanding Bitcoin (BTC) as the primary macro driver for altcoin sentiment is essential context here: altcoin cycles, including any LRC recovery, tend to follow Bitcoin's lead with an amplified beta.
🚀 BULLISH CATALYSTS
- ZK-rollup narrative tailwinds from Ethereum roadmap
- Ethereum L2 adoption expansion across DeFi
- Bitcoin halving cycle altcoin rotation
- Potential new protocol partnerships or pivots
- NFT/gaming vertical applications for zkRollup
⚠ BEARISH RISKS
- Declining TVL vs. Arbitrum, zkSync, Optimism
- Smart wallet operations impacted by security incident
- Binance delisting effective April 1, 2026
- Regulatory pressure on DEX platforms
- No clear near-term product catalyst
Bullish Catalysts: What Could Drive LRC Higher
1. Layer-2 adoption on Ethereum: The broader ZK-rollup sector is still growing, and Ethereum's roadmap points toward a rollup-centric scaling future.
2. Bitcoin halving cycle effects: Post-halving altcoin rotations have historically lifted even projects with weak fundamentals. LRC's extremely low price base means even modest dollar flows could create significant percentage moves.
3. NFT and gaming pivots: Loopring's architecture is genuinely suited to high-throughput, low-fee NFT trading and on-chain gaming. The GameStop NFT marketplace partnership in 2021 demonstrated how quickly a single institutional partnership can reprice LRC. A similar catalyst would change the narrative rapidly.
4. DeFi resurgence: If decentralized exchange volumes grow across Ethereum, Loopring's fee-based tokenomics directly benefit from increased platform usage.
5. ZK technology maturation: As zero-knowledge proof generation becomes faster and cheaper, Loopring's core technology advantage becomes more defensible against optimistic rollup competitors.
Bearish Risks and Red Flags for LRC Investors
1. TVL decline vs. competitors (Risk: High)
Loopring's TVL has fallen dramatically against Arbitrum, Optimism, and zkSync Era. This isn't a temporary divergence - it reflects genuine product-market fit differences.
2. Smart wallet security incident (Risk: Medium)
Loopring Smart Wallets were compromised, forcing temporary suspension of Guardian-related and 2FA operations as reported by CoinGecko. Protocol recovery from security incidents requires rebuilding user trust - a slow process.
3. Binance delisting (April 1, 2026) (Risk: High)
Binance announced it will delist all LRC spot trading pairs effective April 1, 2026. Losing the largest exchange by volume is a significant liquidity hit that reduces accessibility and can suppress price through reduced speculative demand.
4. Regulatory pressure on DEX platforms (Risk: Medium)
Decentralized exchanges face increasing scrutiny in multiple jurisdictions. While Loopring's self-custodial structure provides some protection, regulatory uncertainty could suppress institutional interest.
5. Altcoin cycle risk (Risk: High)
Even in bull markets, capital concentrates in the highest-conviction L2 plays. LRC would need to recapture narrative relevance to compete with better-funded alternatives.
All investment in cryptocurrency carries substantial risk of loss. The above factors are informational and not financial advice.
LRC Investment Strategies: How to Approach Loopring in 2026
There's no universally correct strategy for LRC - the right approach depends entirely on your time horizon, risk tolerance, and conviction level in the project's recovery. Here's how I'd map the common frameworks given the current setup.
Popular LRC Trading Strategies Explained
HODL - Long-Term Conviction Play
LRC at $0.025 represents an asymmetric setup in percentage terms - a 10x from here still only brings it to $0.25, well below its 2021 peak. Risk profile: high volatility tolerance required; be prepared for the position to move against you by 40-60% before any recovery. Suitable for investors with a 3-5 year time horizon who treat LRC as a small, high-risk portfolio allocation.
Dollar Cost Averaging (DCA)
DCA removes the timing pressure by spreading purchases over weeks or months. Given LRC's extreme distance from its ATH and the Binance delisting creating near-term price pressure, DCA is particularly appropriate here. Practically: buy a fixed dollar amount at fixed intervals regardless of price, combined with a clear exit thesis.
Swing Trading
The current RSI at 24.6 and KDJ showing an emerging bullish crossover are exactly the type of setup swing traders look for. A swing entry near current prices, targeting mean-reversion toward the MA50 at $0.034, represents approximately a 36% potential move.
Day Trading and Scalping
LRC's current daily volume is moderate - sufficient for small-to-medium position scalping, but thin enough that large orders will move price. Prioritize the $0.022 and $0.027 levels as near-term inflection points. Scalping LRC in the current environment is only advisable if you're already experienced with high-volatility, low-liquidity altcoins.
Is LRC a Good Investment in 2026?
🔵 LONG-TERM ZK-ROLLUP BELIEVER
At $0.025 - 99% below ATH - LRC carries genuine asymmetric upside if the ZK-rollup thesis plays out. The risk is real: competitive headwinds and no near-term catalyst. Suitable as a small, speculative allocation within a diversified crypto portfolio.
🟡 ACTIVE TECHNICAL TRADER
The RSI oversold reading and KDJ crossover setup are interesting for a short-term bounce trade. The trend remains bearish - any long position should be sized small, stops placed below $0.020, and exits planned before MA50 resistance at $0.034.
🔴 NEW INVESTOR
LRC is not the right starting point. It's a distressed-fundamentals, single-project-risk token with a Binance delisting imminent, requiring above-average research to evaluate properly. Start with higher-liquidity, more broadly diversified assets first.
This section is informational only. Nothing constitutes financial advice. All crypto investments carry substantial risk of loss - including total loss of capital.

LRC Alternatives: Other L2 Tokens Worth Considering
Traders evaluating LRC should understand the broader Layer-2 landscape. Here's how four comparable tokens compare on the metrics that matter for the current cycle:
Market cap figures approximate - verify current data before making any decisions.
The ZK-rollup space specifically (where LRC competes most directly) is represented by zkSync Era and StarkNet, both of which have significantly more developer activity and TVL than Loopring today. For traders who want ZK-rollup narrative exposure without the project-specific risks of LRC's current positioning, diversifying across ZK, ARB, and OP provides broader Layer-2 coverage. For context on reading historical crypto predictions and putting them in perspective, see Zipmex's overview of cryptocurrency price prediction trends.
Each approach carries a different risk profile - the right one depends on whether your thesis is ZK-rollup technology broadly or Loopring specifically.
Conclusion: LRC Price Prediction Verdict for 2026-2030
The LRC price prediction story for 2026 is, ultimately, a story about a technically capable protocol fighting to reclaim relevance in a more competitive Layer-2 landscape - now with the added headwind of the Binance spot delisting.
LRC is currently oversold on most momentum indicators, trading 57% below its 200-day moving average, facing real competitive pressure, and navigating a significant liquidity event. The year-by-year forecasts suggest the most likely path is a gradual recovery tied to macro conditions rather than project-specific catalysts - but meaningful upside ($0.06-$0.085 in 2026, potentially higher in 2027-2028) exists if Bitcoin's cycle continues to rotate capital into altcoins.
Key variables to monitor: Ethereum upgrade timelines affecting all rollups, ZK-rollup TVL metrics across the sector, any Loopring protocol announcements or partnerships, and Bitcoin's macro direction. Also watch closely: whether liquidity migrates smoothly from Binance to alternative venues after the April 1 delisting.
LONG-TERM HOLDER
Speculative exposure makes sense only if sized as a small, high-risk allocation. Conviction in ZK technology > conviction in Loopring specifically.
ACTIVE TRADER
The RSI/KDJ setup offers a near-term bounce trade thesis, but trend remains bearish. Tight stops required. Trade the range, don't bet the cycle.
NEW INVESTOR
Start elsewhere. LRC requires deep project knowledge, tolerance for extended drawdowns, and awareness of the current liquidity risks.
Crypto trading involves substantial risk of loss. Price predictions are scenarios, not forecasts. Nothing in this article constitutes financial advice - always conduct your own research before making investment decisions.
Last updated: March 19, 2026.
Frequently Asked Questions
What is the current LRC price today?
As of March 2026, LRC is trading at approximately $0.025, with a market cap of roughly $33 million. The token has been in a prolonged downtrend since its all-time high of $3.75 in November 2021 - a decline of roughly 99% from peak. Current price sits below all major moving averages, confirming the bearish trend structure. Real-time price can be checked on Bybit, OKX, or MEXC under the LRC/USDT trading pair. Note that Binance is delisting LRC spot pairs effective April 1, 2026.
What is the LRC price prediction for 2026?
Most analyst models for the LRC price prediction in 2026 cluster between a minimum of approximately $0.012 and a maximum of $0.085, with an average projection near $0.038. The bull case requires Bitcoin's halving cycle to catalyze altcoin rotation and LRC to benefit from renewed ZK-rollup sector interest. The bear case - now amplified by the Binance delisting - reflects continued fundamental weakness and reduced liquidity. The most likely 2026 range without a major catalyst is $0.025-$0.050.
What will Loopring be worth in 2027?
Analyst projections for 2027 show a wide range: minimum $0.020, average $0.065, maximum $0.14. The 2027 forecast depends on whether Loopring announces meaningful protocol developments or partnerships that re-engage its user base, and whether the broader Layer-2 narrative continues attracting capital. Medium-term forecasts are particularly sensitive to competitive dynamics - zkSync Era and StarkNet are direct rivals for ZK-rollup attention, and Loopring needs a differentiated position to capture disproportionate upside.
What is the LRC price prediction for 2030?
The LRC price prediction for 2030 shows average projections around $0.16, with bull case estimates reaching $0.45 and bear case scenarios as low as $0.045. From current prices (~$0.025), hitting the average 2030 target would represent roughly a 6x return - possible but not assured. The 2030 bull case assumes Loopring finds a durable product niche within the Ethereum ecosystem. The bear case assumes continued protocol obsolescence as better-funded L2 alternatives dominate.
Is Loopring a good investment in 2026?
Whether LRC is a good investment depends entirely on your risk tolerance and time horizon. For long-term investors who believe ZK-rollup technology will find mainstream adoption, the current price represents speculative asymmetric upside - but carries genuine project-specific risk including declining TVL, the Binance delisting, and competitive pressure. For short-term traders, the oversold RSI and KDJ crossover offer a technical bounce thesis. For beginners or capital preservation-focused investors, LRC carries above-average risk. This does not constitute financial advice.
Why is LRC price dropping?
LRC's price decline reflects several converging factors: a security incident affecting Loopring Smart Wallet operations, declining trading volume and TVL on the Loopring DEX, broader crypto market conditions depressing small-cap altcoins, the rise of well-funded L2 competitors including Arbitrum and zkSync Era, and - most recently - Binance's announcement to delist all LRC spot pairs effective April 1, 2026. LRC's decline is more severe than most because these project-specific headwinds layer on top of macro pressure.
What is the Loopring all-time high?
LRC reached its all-time high of $3.75 in November 2021 during the broader crypto bull market, coinciding with significant attention around the Loopring-GameStop NFT marketplace partnership. Prior to that peak, LRC had also reached highs around $2.50 in early 2018. The current price (~$0.025) is approximately 99% below the 2021 ATH. While such ATH discounts often attract speculation, the distance from ATH alone is not an investment thesis - fundamentals have changed significantly since 2021.
Crypto trading involves substantial risk of loss. Price predictions are scenarios, not forecasts. Nothing in this article constitutes financial advice.
