
Market cap - short for market capitalization - is one of the most widely cited numbers in investing, yet it's frequently misunderstood. At its core, market cap is the total market value of a company's outstanding shares. Multiply the current share price by the number of shares outstanding, and you get the number every analyst, index fund, and retail investor uses to gauge company size. But knowing the formula is only the beginning.
⚡ Key Takeaways
- Formula: Market Cap = Share Price . Shares Outstanding
- Cap tiers classify companies from nano-cap (under $50M) to mega-cap ($200B+), each carrying distinct risk and return profiles
- Market cap is a sizing tool, not a valuation tool - pairing it with Enterprise Value and fundamental metrics gives a far more complete picture
Understanding how cap tiers work, how market cap is calculated, and where it breaks down as a metric will make you a sharper investor across every asset class. The same logic applies in crypto - circulating market cap for tokens follows identical principles, which we cover in the conclusion.
What Is Market Capitalization? Definition and Formula
Market capitalization is the total dollar value of a publicly traded company's outstanding common shares. The formula is straightforward:
Worked example:
If that stock price moves to $55, market cap becomes $5.5B - with no change in the company's actual operations, assets, or earnings. That sensitivity to price is exactly why market cap has limits as a standalone metric, which we'll address later.
One point that often trips up newer investors: a $500 stock isn't necessarily from a larger company than a $10 stock. A company with 1 million shares at $500 has a $500M market cap. A company with 1 billion shares at $10 has a $10B market cap - twenty times larger. Share price alone tells you nothing about company size. For a deeper look at how crypto tokens apply this same principle, see our guide on cryptocurrency predictions and market cycles.
Free-Float vs. Full Market Cap: What's the Difference?
Not every outstanding share trades on the open market. Insider-held shares, employee stock options under lockup, and shares held by strategic partners are all technically "outstanding" but aren't available for public trading. The float - sometimes called the public float - is the subset of shares that actually changes hands on exchanges.
Free-float market cap uses only the float in its calculation, typically producing a lower number than the full market cap. Most major indices, including the S&P 500, use free-float methodology specifically because it reflects the shares investors can actually buy and sell.
For a company where executives hold 40% of shares under lockup, the difference between full and free-float market cap is significant. Knowing which figure you're looking at matters when comparing index weights or assessing actual trading liquidity.
Market Cap Categories: From Mega-Cap to Nano-Cap
The absolute market cap number only becomes useful when you know where it sits relative to the full spectrum of companies. The market uses a tiered classification system - ranging from nano-cap to mega-cap - with each tier carrying its own risk profile, growth expectations, and investor suitability.
There's no single official governing body that sets these cutoffs. FINRA publishes investor education guidance with approximate ranges, and S&P Dow Jones Indices defines specific eligibility thresholds for inclusion in its major indices. Both are referenced below.
S&P Dow Jones Indices sets specific eligibility thresholds for index addition (as of 2026): the S&P 500 requires a market cap of at least $20.5B, the S&P 400 Mid-Cap ranges from $7.4B to $20.5B, and the S&P 600 Small-Cap spans $1B to $7.4B. These are addition requirements, not maintenance thresholds - a company already in the S&P 500 won't be immediately dropped if its cap dips below the entry floor.
One important nuance: these cutoff values shift over time. Inflation, population growth, and overall market expansion mean that what qualified as a "large-cap" in 2000 looks mid-cap today. The categories are relative, not fixed in nominal dollar terms.
Large-Cap vs. Mid-Cap vs. Small-Cap: Risk and Return Profiles
Most retail investors operate across these three tiers. Here's how they compare across the dimensions that actually affect portfolio construction decisions:
Large-caps tend to be mature businesses with established revenue streams - think global financials, consumer staples, or legacy tech. They're less likely to double in a year, but they're also less likely to crater 60% in a downturn.
Small-caps operate at the other end of the spectrum. Their growth runway is longer, but so is their sensitivity to economic shifts, credit conditions, and sector-specific headwinds. Many institutional investors deliberately blend all three tiers to capture the return potential of smaller companies while anchoring the portfolio with large-cap stability.
Mid-caps occupy the sweet spot many investors underweight - past their most volatile growth phase but still with meaningful expansion potential. They often get overlooked in favor of the extremes, which creates persistent pricing inefficiencies relative to large-cap equivalents.

How to Use Market Cap as an Investor
Understanding the categories is straightforward. Translating them into actual investment decisions takes more thought. Here are five concrete ways market cap informs portfolio strategy:
- Stock screening by risk appetite - Filter your watchlist by cap tier first. If you're building a conservative income portfolio, starting outside large-cap territory adds uncompensated risk. If you're running a speculative growth sleeve, targeting mid-cap and small-cap universes gives you the most surface area.
- Portfolio construction across tiers - Intentional cap diversification smooths volatility. A 60/30/10 blend across large/mid/small exposure, for example, captures different growth cycles that don't always move in lockstep.
- Index fund and ETF selection - Most passive funds are implicitly market-cap-weighted: the larger the company, the higher its weight in the fund. Knowing this means knowing that buying the S&P 500 is, by construction, a heavy bet on the current largest U.S. companies by market value. Factor-based ETFs weight differently, which is worth understanding before assuming all index funds behave similarly.
- Risk calibration - Market cap is a rough but useful proxy for volatility. Smaller companies have less analyst coverage, thinner trading volumes, and higher sensitivity to liquidity crunches. Sizing positions smaller in the micro-cap and nano-cap tiers reflects that reality, not timidity. This same logic applies when evaluating crypto tokens - platforms like Polygon illustrate how a project's market cap relative to its total value locked can signal whether a token is fairly priced.
- Sector and thematic analysis - Within a sector, the cap distribution tells you about the industry's maturity. A sector dominated by mega-caps is mature and consolidating. A sector skewed toward small and micro-caps is early-stage and fragmented - higher return potential, but with correspondingly higher failure rates across individual names.
Market cap doesn't work in isolation, though. A high market cap doesn't mean a company is cheap, fundamentally sound, or growing. It must be paired with earnings metrics, revenue growth, debt levels, and for a complete picture - Enterprise Value.
Market Cap vs. Enterprise Value: What's the Real Difference?
This distinction separates investors who understand company valuation from those who only look at size. Market cap measures equity value - what shareholders collectively own. Enterprise Value (EV) measures the total cost to acquire the entire business, including its debt obligations and net of its cash holdings.
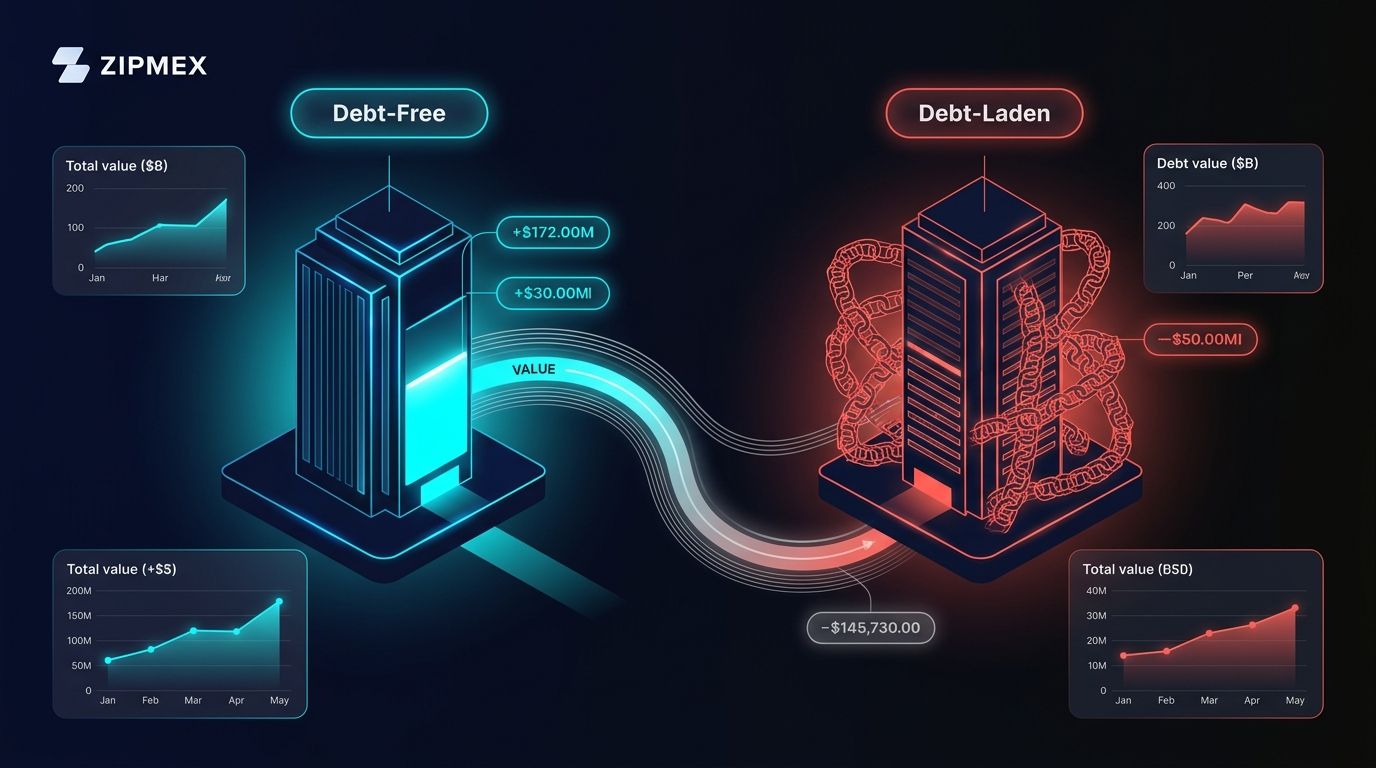
Why does this matter? Consider two companies with identical $5B market caps:
Company B carries nearly 75% more total firm value despite the same headline market cap. An acquirer buying Company B isn't paying $5B - they're effectively absorbing $7.8B in total obligations. Using market cap alone to compare these two companies leads to a meaningfully wrong conclusion.
EV matters most in three scenarios:
- Comparing companies with different capital structures
- M&A analysis where the acquiring party inherits debt
- Calculating valuation multiples like EV/EBITDA, which is more apples-to-apples than price-to-earnings across heavily leveraged vs. debt-free companies.
Market cap is the starting point. Enterprise Value is where serious fundamental analysis begins.
Limitations of Market Cap: What It Doesn't Tell You
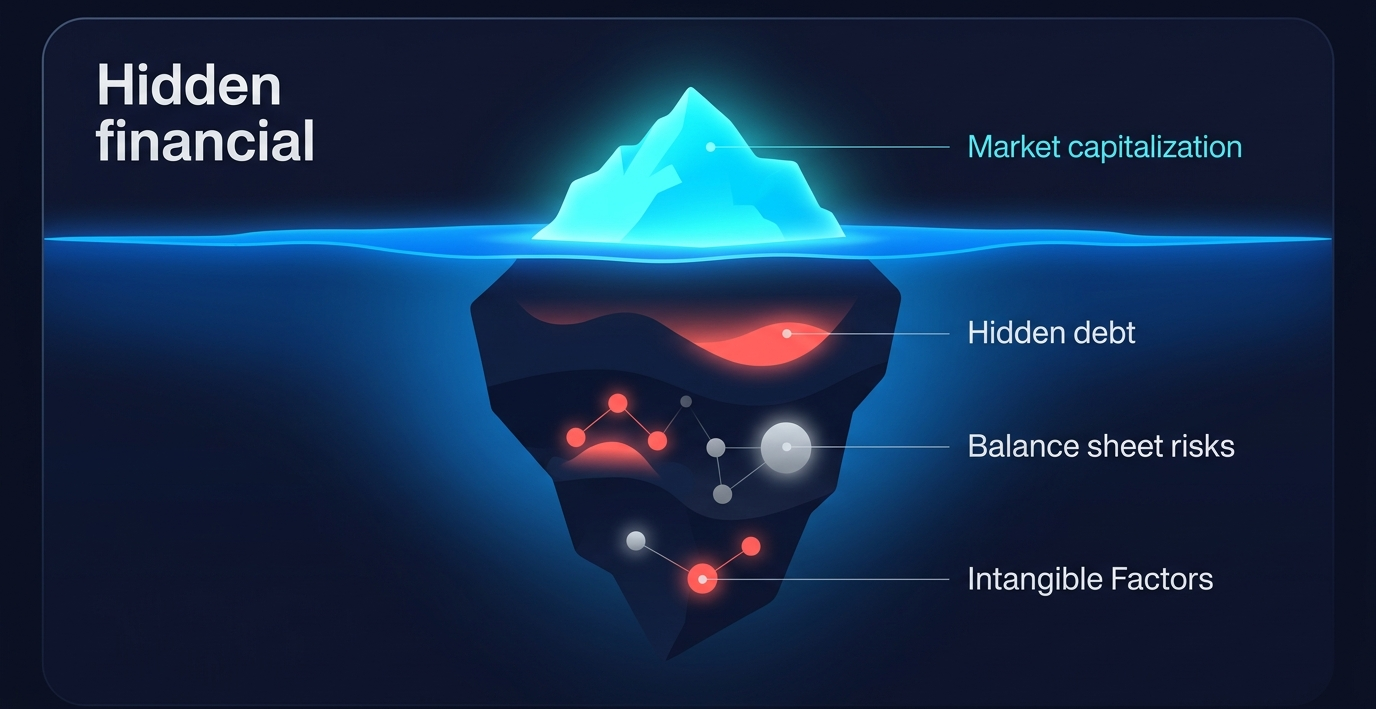
Market cap gets treated as a proxy for quality, safety, and stability - none of which it actually measures. Being clear-eyed about what it misses makes you harder to mislead.
⚠ What Market Cap Does NOT Tell You
- Whether a stock is cheap or expensive → A $2T market cap doesn't mean the stock is overpriced, and a $200M market cap doesn't mean it's a bargain. Valuation requires earnings, cash flow, and growth context.
- The company's actual financial health → Market cap reflects market sentiment, not balance sheet quality. A company can carry a massive cap alongside unsustainable debt loads.
- Management quality or competitive moat → Two companies with the same market cap can have radically different durable advantages.
- Liquidity of individual trades → High overall market cap doesn't guarantee you can exit a large position without moving the price, especially in smaller large-caps with concentrated institutional ownership.
- Intrinsic value → Market cap is what the market currently believes a company is worth. Intrinsic value is what it's actually worth based on fundamentals. The gap between those two numbers is where opportunity (and risk) lives.
One macro-level tool that uses total market capitalization is the Buffett Indicator - the ratio of total U.S. stock market cap to U.S. GDP. When the ratio climbs significantly above 100%, it historically has signaled broad market overvaluation. It's not a trading signal, but it's a useful sanity check on whether equity markets are pricing in a lot of optimism relative to underlying economic output.
Market cap can also be gamed. Share buybacks reduce the float without changing the business, mechanically increasing the cap metric per remaining share. Splits and reverse splits alter share count without changing total market value. None of these corporate actions change what the underlying business produces - but all of them affect how market cap is reported and interpreted. The same dynamic exists in crypto: understanding how circulating supply differs from total supply is essential when evaluating any token's market cap figure.
Conclusion
Market cap is a foundational metric - the entry point for classifying companies, constructing diversified portfolios, and navigating the full spectrum from nano-cap speculation to mega-cap stability. Master the formula, understand the tier distinctions, and you have a working framework for any market.
But treat it as the complete picture and you'll make predictable mistakes. Market cap doesn't capture debt, doesn't reflect intrinsic value, and doesn't tell you whether a company's size reflects genuine business quality or inflated sentiment. Pair it with Enterprise Value for capital structure context and fundamental metrics for actual valuation, and it becomes genuinely powerful.
The broader crypto and DeFi space has introduced its own version of this metric - circulating market cap for tokens, fully diluted valuation for total token supply. The same logic applies: size isn't the same as value, and the float distinction matters even more when token unlocks can dramatically shift circulating supply. Platforms built on verifiable on-chain mechanics, like those prioritizing transparent fee structures and self-custodial models, reflect a broader market trend toward metrics that can be independently verified - not just reported. For a practical look at how these dynamics play out with specific crypto assets, our guide on XRP price prediction and market analysis is a useful companion read.
Crypto trading and DeFi activities involve substantial risk of loss. Market cap analysis does not constitute investment advice. Always conduct independent research before making any financial decisions.
Last updated: March 2026.
Frequently Asked Questions
What is market cap in simple terms?
Market cap - short for market capitalization - is the total market value of a company's outstanding shares. Calculate it by multiplying the current share price by the total number of shares outstanding. If a company has 50 million shares trading at $40 each, its market cap is $2 billion. The number gives investors a standardized way to measure and compare company size across industries and sectors. It's a sizing metric, not a valuation one - knowing a company's market cap tells you how large it is by market consensus, not whether it's cheap or worth owning.
How do you calculate market cap?
The formula is: Market Cap = Share Price . Shares Outstanding. For example, if a company has 200 million shares outstanding and its current stock price is $75, the market cap is $15 billion. This calculation uses the total number of outstanding shares, not just the publicly tradeable float. Most financial data platforms display market cap automatically, but understanding the underlying formula matters - because when a stock price rises 10%, the market cap increases by exactly 10% even if nothing about the underlying business has changed.
What is considered a large-cap stock?
Large-cap stocks generally carry market caps between $10 billion and $200 billion, though exact definitions vary by index provider. For S&P 500 inclusion, companies must have a market cap of at least $20.5 billion as of 2026. FINRA's investor education materials place the large-cap range at $10B-$200B. Companies at this scale are typically mature, well-covered by analysts, and often pay dividends. They carry lower volatility than smaller-cap peers, though "large" doesn't inherently mean safe - leverage, sector headwinds, and overvaluation can affect large-caps as severely as any other tier.
What is the difference between large-cap and small-cap stocks?
Large-cap and small-cap stocks sit at opposite ends of the market cap spectrum and behave very differently. Large-caps - generally $10B and above - are mature companies with stable revenues, broad analyst coverage, and higher liquidity. Small-caps - typically $250M to $2B - are earlier-stage businesses with higher growth potential but significantly more volatility. During bull markets, small-caps often outperform; during downturns, they tend to fall harder and recover more slowly. Diversifying across both tiers lets investors balance the return upside of smaller companies against the stability and income of established large-cap names.
Does a higher market cap mean a better investment?
No - market cap measures size, not quality or value. A company with a $500 billion market cap can be dramatically overpriced while a $300 million small-cap can trade at a significant discount to its intrinsic value. Higher market cap typically means more liquidity, more analyst coverage, and lower short-term volatility - but it says nothing about whether the current share price reflects fair value. Investors confuse size with safety, particularly during bull markets when large-cap stocks benefit from passive index inflows regardless of underlying business performance. Always pair market cap analysis with valuation metrics before drawing investment conclusions.
What is the difference between market cap and enterprise value?
Enterprise Value (EV) is the total theoretical acquisition cost of a company - it adds total debt and preferred stock to market cap, then subtracts cash and cash equivalents. The formula: EV = Market Cap + Debt + Preferred Stock - Cash. While market cap measures only equity value, EV captures the full capital structure. Two companies with the same $5B market cap can have dramatically different enterprise values if one carries $3B in debt and the other is debt-free. EV is the preferred metric for M&A analysis and for calculating multiples like EV/EBITDA, which produce more comparable results across companies with different financing structures.
What is the Buffett Indicator?
The Buffett Indicator is the ratio of total U.S. stock market capitalization to U.S. gross domestic product (GDP), expressed as a percentage. When it climbs well above 100% - meaning the market is worth more than annual economic output - it has historically preceded periods of below-average equity returns. Warren Buffett publicly referenced this ratio as his preferred single gauge of market valuation. It's a macro-level signal, not a precise timing tool - markets can stay above the 100% threshold for extended periods. But as a calibration check on whether broad equity valuations have run ahead of economic reality, it remains widely watched.
