
The shiba inu price currently sits around $0.0000061 as of March 2026, with the broader sentiment tilting bearish-to-neutral amid subdued memecoin activity and a Fear & Greed Index reading deep in Extreme Fear territory. The question on every SHIB holder's mind is whether this represents a temporary floor or the early stage of a prolonged drawdown.
This analysis draws on technical indicators, on-chain tokenomics, and multi-year modeling to offer a structured view of where SHIB could head — from short-term 2026 monthly targets all the way through long-term 2030 scenarios. Whether you're evaluating an entry, managing an existing position, or simply researching Shiba Inu as a crypto asset, the following sections cover everything from burn mechanics to trading strategy.
⚡ Key Takeaways
- Current SHIB price (March 2026): ~$0.0000061
- 2026 price prediction range: $0.00000513 (bear case) — $0.000035 (bull case)
- 2030 price prediction range: $0.0000025 (algorithmic bear) — $0.0001 (optimistic bull)
- Current market sentiment: Bearish-to-neutral; RSI at 35.42, both SMAs above price
- Fear & Greed Index: 10 — Extreme Fear
What Is Shiba Inu (SHIB)? Origins, Ecosystem & Tokenomics
Shiba Inu (SHIB) launched in August 2020 as an anonymous Ethereum-based experiment by a pseudonymous creator known only as "Ryoshi." Branded as the "Dogecoin killer," SHIB leaned into meme culture from the start — deploying on Ethereum rather than its own chain, and releasing a colossal initial supply of 1 quadrillion tokens. What began as a tongue-in-cheek challenge to Dogecoin's dominance quickly snowballed into a genuine cultural phenomenon: the "SHIB Army" grew into one of crypto's most passionate and organized communities, driving adoption through sheer social force.
The token's pivotal moment came in 2021, when Vitalik Buterin — who had received ~50% of the total supply as an unsolicited donation — burned approximately 41% of all SHIB in existence and donated the remainder to COVID-19 relief efforts in India. That single event reshaped SHIB's supply dynamics permanently and sent the token on an explosive run to its all-time high of $0.00008845 in October 2021.
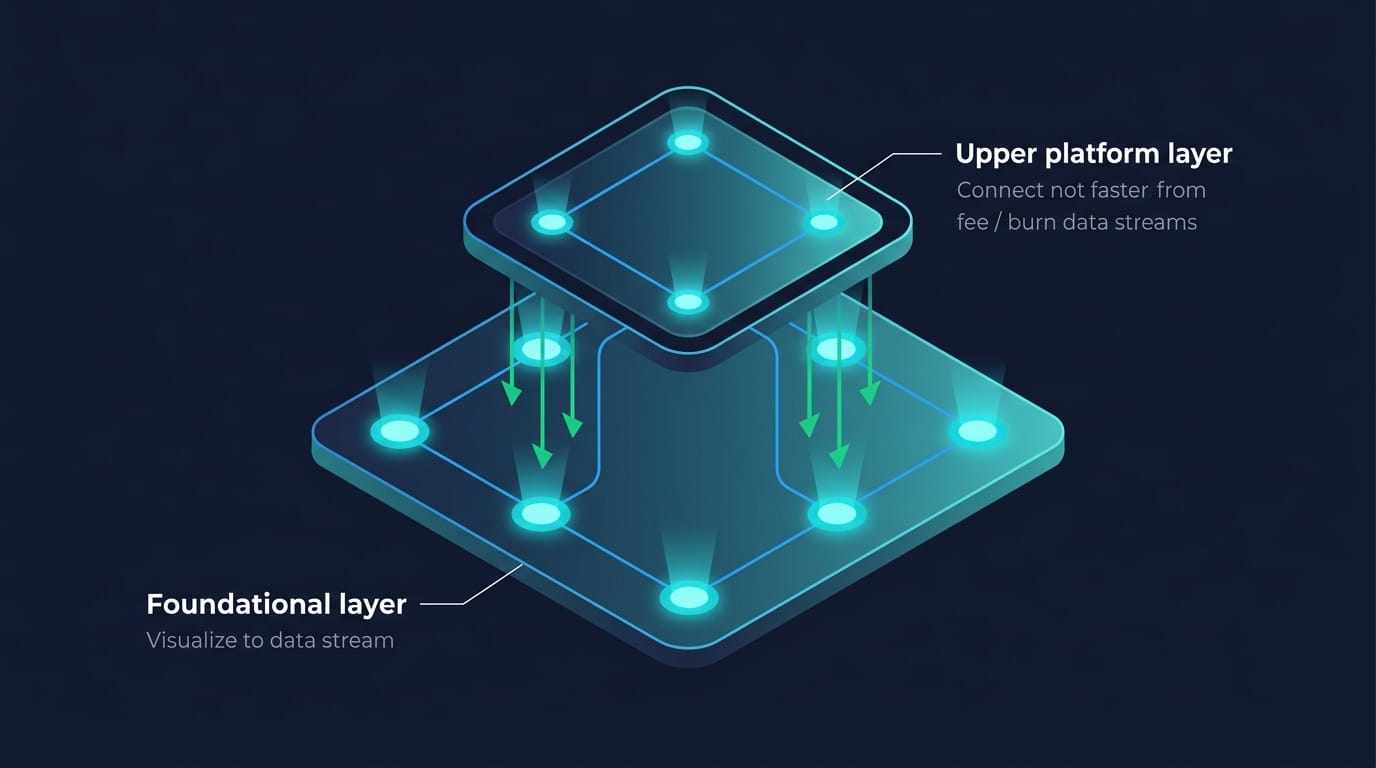
Since then, the Shiba Inu ecosystem has expanded well beyond a single meme token. ShibaSwap — the protocol's native decentralized exchange — enables trading, staking, and liquidity provision. Shibarium, the Layer-2 blockchain built on Ethereum that launched its mainnet in August 2023, processes transactions at lower cost and feeds a portion of its fees back into an automated token burn mechanism. The ecosystem also includes BONE (the governance and gas token for Shibarium) and LEASH (a scarce, higher-value companion token). Understanding this ecosystem is essential context before interpreting any price prediction.
SHIB Ecosystem Timeline
SHIB ECOSYSTEM TIMELINE
August 2020
SHIB launches on Ethereum; 1 quadrillion token supply minted by pseudonymous creator "Ryoshi."
May 2021 — KEY EVENT
Vitalik Buterin burns ~41% of total supply; price surges toward all-time high.
October 2021
SHIB hits all-time high of $0.00008845 during peak memecoin mania cycle.
2022
Shibarium Layer-2 announced; burn mechanism development begins in earnest.
August 2023
Shibarium mainnet launches on Ethereum, introducing automatic fee-based token burns.
2024–2026
Shibarium TVL grows; ongoing ecosystem development continues; burn wallet accumulates.
SHIB Tokenomics: Supply, Burns & Market Cap Explained
SHIB's initial supply of 1 quadrillion tokens was by design — the team intended that abundance to keep per-token prices low enough for everyday users to hold millions or billions of tokens. A "burn" in crypto means sending tokens to an unspendable wallet address, permanently removing them from circulation and reducing the total supply.
The Vitalik Buterin burn of May 2021 was the largest single deflationary event in SHIB's history, removing roughly 410 trillion tokens in one transaction. Since then, a community-driven voluntary burn mechanism allows holders to send SHIB to a designated dead address in exchange for burn rewards. Shibarium amplifies this: every transaction on the Layer-2 generates fees that are partially converted to SHIB burns automatically — an embedded deflationary pressure tied directly to network usage.
That said, even with ongoing burns, the math requires perspective. With hundreds of trillions of tokens still in circulation, burn rate alone is unlikely to move the price dramatically in the near term. The market cap figure tells the real story — at approximately $3.3 billion as of March 2026, SHIB ranks among the top 20 cryptocurrencies, a position that reflects genuine community depth despite the speculative stigma.
With SHIB's supply dynamics clear, the next question is what the actual price forecast looks like across 2026 and beyond.
Shiba Inu Price Prediction 2026-2030: Year-by-Year Forecasts
The shiba inu price prediction landscape for 2026 through 2030 is wide and contested - which is itself important information. Unlike established assets where analyst ranges tend to converge, SHIB forecasts span multiple orders of magnitude depending on the model's assumptions. That divergence reflects genuine uncertainty about whether Shibarium will achieve real adoption and whether the memecoin narrative can sustain relevance through multiple Bitcoin halving cycles.
All price predictions are inherently speculative and do not constitute investment advice. SHIB is a high-volatility asset, and any forecast carries substantial uncertainty. What follows is a synthesis of technical models, algorithmic tools, and fundamental analysis - not a projection of guaranteed outcomes.
The current technical setup sets the base for all near-term forecasts: RSI at 35.42 (approaching oversold but not confirmed), the 50-day SMA sitting above price at $0.0000070, and the 200-day SMA even higher at $0.0000095 - both acting as overhead resistance. Downward momentum remains dominant in March 2026, and the Fear & Greed Index reading of 10 (Extreme Fear) reflects market-wide risk-off sentiment.
SHIB Monthly Price Forecast for 2026
With the 14-day RSI at approximately 35 - sitting in neutral-to-approaching-oversold territory - and the 50-day SMA firmly above the current price, the technical structure for early 2026 is bearish. The SHIB/USDT daily chart shows a descending channel pattern, with the Fear & Greed Index at 10 acting as a contrarian signal for some analysts: historically, extreme fear readings in established assets have preceded sentiment reversals, though memecoins with high retail exposure can remain in fear territory for extended periods.
Moving averages are doing important work here. The 50-day SMA ($0.0000070) represents near-term resistance - a sustained close above it would shift short-term structure from bearish to neutral. The 200-day SMA ($0.0000095) represents the major structural trend line; a recovery through that level would mark a true bull thesis restoration.
For Q1-Q2 2026, pressure persists. Q3-Q4 may see early recovery signals if the broader crypto market finds a floor and Bitcoin stabilizes.
Algorithmic models such as CoinCodex project a bearish year-end 2026 figure near $0.00000513 - consistent with continued downward pressure absent a major macro catalyst. More optimistic views from analysts referencing Shibarium adoption momentum cite a range of $0.000020-$0.000035 as achievable if altcoin season arrives in Q3-Q4. The realistic base case for most of 2026 is consolidation in the $0.0000050-$0.0000075 corridor, with directional conviction requiring confirmation from the technical signals described above.
SHIB Price Prediction 2027, 2028, 2029 & 2030
Multi-year SHIB projections are inseparable from Bitcoin halving cycle theory. Bitcoin's most recent halving occurred in April 2024, and historically, altcoin outperformance has followed 6-18 months post-halving. That places 2025-2026 as the expected altcoin season window - though delayed market dynamics could push meaningful altcoin momentum into 2027.
2027: This year could represent either a post-halving altcoin cycle peak or a mid-cycle cooling period, depending on where Bitcoin's price stands. If Bitcoin sustains price strength above its 2024 ATH, SHIB and broader memecoins typically outperform on the upside. Bear case: a broader market correction drags SHIB back toward $0.0000025-$0.0000035. Bull case: SHIB approaches $0.000050 in a momentum-driven altcoin phase.
2028: The next Bitcoin halving is projected for April 2028. Historical patterns show altcoin rallies typically begin 6-12 months after the halving event, placing the early stages of the next cycle in late 2028. Ethereum-based assets, including SHIB, tend to benefit from post-halving rotation as capital flows from Bitcoin into higher-beta assets. Shibarium adoption metrics will be a critical variable by this point.
2029: If Shibarium achieves meaningful total value locked (TVL) and a developing dApp ecosystem, the utility argument for SHIB strengthens beyond pure speculation. Recovery through $0.000075-$0.0001 becomes a credible bull case. However, if Shibarium adoption stalls and the broader memecoin narrative fades in favor of newer ecosystem tokens, the bear case (~$0.0000030) becomes equally plausible.
2030: The most widely searched target, and the one with the widest divergence. Algorithmic bear models project approximately $0.0000025 by 2030 - essentially continued supply dilution and relevance decay. Optimistic analysts citing Shibarium mass adoption and sustained burn acceleration project toward $0.0001. The range between these two scenarios reflects deep, genuine uncertainty.
Long-Term SHIB Price Prediction 2040 & 2050
By 2040, the most credible analyst estimates cluster around $0.00003-$0.0001 - a wide range, but one that depends almost entirely on whether the token burn mechanism has meaningfully compressed the circulating supply and whether Shibarium becomes a genuine Layer-2 competitor by that point.
The math for higher price targets deserves direct treatment. For SHIB to reach $0.001, the token's market cap would need to exceed roughly $590 billion - approaching the size of gold's entire market cap at today's prices. For SHIB to reach $0.01, that market cap requirement climbs above $5.9 trillion, larger than the entire cryptocurrency market as of early 2026.
While theoretically possible for extreme long-term targets under extraordinary circumstances, SHIB reaching $1 would require market conditions with no historical precedent in any asset class. Token burns are the only realistic mechanism that could structurally support dramatically higher per-token valuations - and their current pace, while meaningful, would need to accelerate by orders of magnitude.
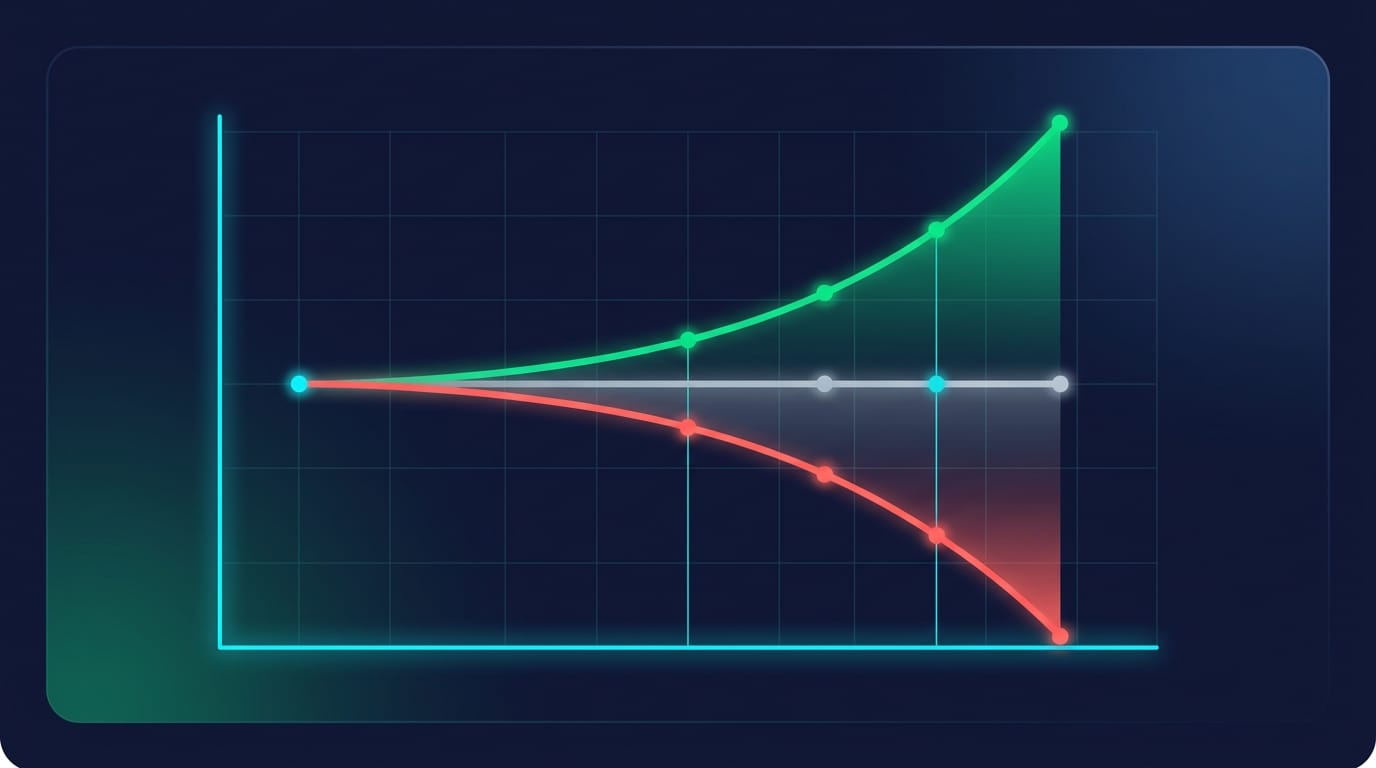
Bull Case vs. Bear Case - SHIB Price Scenarios Compared
The structured comparison below contrasts the three core scenarios across the forecast horizon. Santiment data from early 2026 shows declining social engagement around SHIB relative to 2021 and 2024 peaks - a factor that weighs meaningfully in the bear case.
How to Buy Shiba Inu (SHIB): Step-by-Step for Beginners
If the SHIB price forecast aligns with your strategy, here's how to get started. There are two primary pathways for purchasing SHIB: through a centralized exchange (CEX) for ease of onboarding, or through a decentralized exchange (DEX) such as ShibaSwap for on-chain, self-custody access. Both approaches are straightforward for users familiar with crypto basics.
SHIB is listed on virtually every major exchange - Binance, Coinbase, Kraken, MEXC, and others - making it one of the most accessible tokens by trading volume. CoinMarketCap's exchange listings page provides a real-time view of where SHIB pairs trade and their relative liquidity depth. Before choosing an exchange, verify its regulatory standing in your jurisdiction and check its fee structure for spot trading.
Note: Crypto trading carries substantial risk of loss. The steps below are informational only and do not constitute investment advice.
Step-by-Step: Buying SHIB on a Centralized Exchange
- Choose a regulated exchange. Select a platform operating in your jurisdiction with a verified track record. Check for proof-of-reserves and regulatory licensing.
- Create and verify your account. Most exchanges require KYC (Know Your Customer) verification - typically a government-issued ID and selfie. Verification typically takes minutes to a few hours.
- Fund your account. Deposit fiat currency via bank transfer, debit card, or stablecoin transfer. Bank transfers offer lower fees; card deposits offer speed.
- Search for the SHIB/USDT or SHIB/USD pair. Use the exchange's search function to locate SHIB. Place a market order for immediate execution or a limit order at your target price.
- Confirm your purchase. Review the fee summary before confirming. You'll receive SHIB in your exchange wallet.
📊 Beginner Tip
A $10 investment in SHIB at $0.0000061 buys approximately 1.6 billion tokens. The ultra-low per-token price is a structural feature of SHIB's economics, not an indicator of value. Measure your position by dollar amount, not token count.
- Transfer to a private wallet for long-term holding. If you plan to hold SHIB beyond the short term, move it off the exchange to a self-custody wallet.
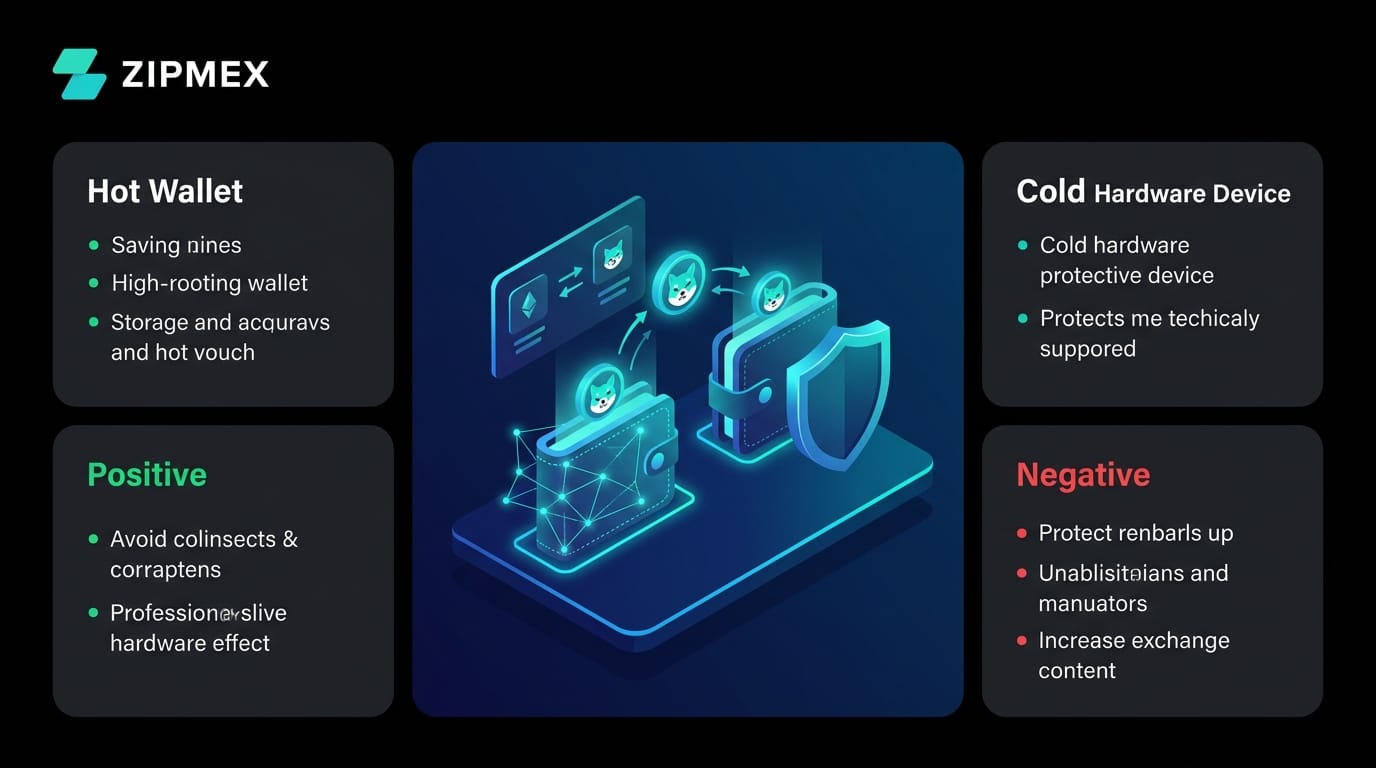
How to Store SHIB Safely (Wallet Guide)
SHIB is an ERC-20 token deployed on Ethereum, which means any Ethereum-compatible wallet supports it natively. There are two primary storage approaches depending on your activity level.
Hot Wallets (MetaMask, Trust Wallet) connect directly to the internet and are best suited for active traders or DeFi participants who need quick access to funds for ShibaSwap staking or DEX trading. Setup is straightforward, but they carry inherent security risks related to internet exposure.
Cold Wallets (Ledger, Trezor) store private keys offline, making them the most secure option for long-term holders. Hardware wallets are the recommended standard for any position you're not actively trading.
ShibaSwap also offers staking functionality for SHIB holders who want to put idle tokens to work - relevant for users interested in participating in the ecosystem while holding.
SHIB Technical Analysis: How Price Predictions Are Made
Technical analysis matters for SHIB price prediction credibility because it replaces intuition with observable, repeatable signals. Rather than relying on community sentiment or influencer narratives alone, technical indicators give traders a structured framework for evaluating when to engage, when to wait, and when to exit. The current SHIB/USDT chart, as of March 2026, paints a consistently bearish picture across multiple indicators - one that directly informs the bearish scenarios described in the prediction sections above.
The key data points as of March 2026: RSI at 35.42, 50-day SMA at $0.0000070, 200-day SMA at $0.0000095, and Fear & Greed Index at 10 (Extreme Fear). Each of these indicators tells part of the same story - SHIB is trading in a downtrend, with price below both major moving averages and momentum indicators reflecting seller dominance.
RSI, MACD & Moving Averages: Reading SHIB's Momentum
Three momentum-based indicators dominate professional SHIB analysis: RSI, MACD, and Moving Averages. No single indicator should be used in isolation - confluence across at least two or three provides substantially stronger signals.
These are the same inputs used by major algorithmic forecast tools. During altcoin season, all these signals are amplified - both to the upside and downside - which is why macro context always supplements technical chart reading.
Bollinger Bands, CMF & Key Support/Resistance Levels
Bollinger Bands around the SHIB daily chart are squeezing as of March 2026 - the distance between the upper and lower bands is narrowing, which historically precedes a volatility expansion. The critical unknown is direction: a breakout above the upper band would signal bullish momentum, while a breakdown below the lower band would confirm the bearish case. The CMF indicator remains in negative territory, meaning capital is flowing out of SHIB rather than into it - a bearish confirmation that aligns with the RSI and moving average picture.
Fibonacci Retracement from SHIB's 2024 high adds additional structural context, mapping key retracement zones that analysts use to identify where price may stabilize or reverse.
Free vs. Paid vs. AI-Based SHIB Price Prediction Models
Understanding where price forecast numbers originate is as important as the numbers themselves.
Most free tools use RSI and moving averages as core inputs - the same indicators discussed above. The honest conclusion: no model reliably predicts memecoin price action with precision. Use them as directional inputs, not authoritative forecasts.
Red Flags: How to Spot Misleading Shiba Inu Price Predictions
The SHIB ecosystem attracts a disproportionate share of low-quality, financially motivated price predictions - a direct consequence of its memecoin nature and the large retail audience it commands. SHIB's social-media-driven price history makes it uniquely vulnerable to coordinated narrative manipulation, and Santiment data shows recurring spikes in inorganic social engagement around SHIB that don't correspond to genuine on-chain activity.
Before trusting any SHIB price prediction, evaluate the source against the following checklist:
⚠ Red Flag Checklist - Spot a Misleading SHIB Forecast
- Specific rally date with no methodology disclosed → prediction is fabricated
- Extreme targets ($1 SHIB) → presented without market cap math
- Referral/affiliate links → paid promotion disguised as analysis
- No risk disclaimers → non-compliant with responsible publishing standards
- Single analyst cited → without corroborating sources
- Published during coordinated social push → on Twitter/Telegram
- Emotional framing → "SHIB is about to explode - don't miss it"
Common Deceptive Tactics in Crypto Price Prediction Content
Five deceptive patterns appear most frequently in low-quality SHIB prediction content:
⚠ Warning Signs in a SHIB Price Prediction Article
- Algorithmic outputs as expert opinions - automated numbers repackaged with authoritative language
- Selective timeframe cherry-picking - showing only the bullish periods in a model's output
- Outdated data for a predetermined conclusion - using 2021 ATH momentum data to support a 2026 rally thesis
- Undisclosed paid promotions - exchange partnerships or token team arrangements driving editorial direction
- FOMO framing - countdown timers or "closing window" language designed to trigger impulsive decisions
These tactics are more effective against memecoin audiences precisely because SHIB's price history contains genuinely extraordinary past performance - it's easy to construct a narrative around the possibility of that repeating.
How to Trade SHIB Strategically: Risk Management & Execution
Understanding the price forecast is step one - knowing when and how to act on it is step two. Even the best technical setup cannot guarantee outcomes with SHIB. The memecoin's price is disproportionately influenced by news events, social media cycles, and macro sentiment shifts that can temporarily override any technical signal in the chart.
Popular Trading Strategies for Shiba Inu (SHIB)
Risk Management Basics for SHIB Traders
The single most important principle for SHIB exposure is position sizing. Given its memecoin nature and extreme historical volatility, SHIB should represent a small speculative allocation within a diversified crypto portfolio - not a core position. Many experienced DeFi participants cap memecoin exposure at 5-10% of their total portfolio, regardless of conviction level.
⚠ Risk Management Checklist - Before Entering a SHIB Position
- Is my total SHIB allocation within my speculative risk budget?
- Have I defined a stop-loss level (e.g., close below $0.0000050)?
- Do I have a take-profit target (e.g., $0.0000075 near-term resistance)?
- Have I confirmed the entry with at least 2 technical signals (not just one)?
- Am I entering based on analysis, not social media hype?
- Am I prepared to lose this entire position without it affecting my financial stability?
When to Enter and Exit a SHIB Position
Shiba Inu Alternatives: Other Memecoins & Crypto Assets to Consider
For investors who have researched Shiba Inu price prediction data thoroughly but want to compare alternatives before committing, the memecoin and broader crypto landscape offers a range of options across different risk profiles.
Conclusion: Is Shiba Inu Worth Buying in 2026?
The shiba inu price environment in March 2026 tells a consistent story: bearish technical structure (RSI 35, price below both the 50-day and 200-day SMAs), low market sentiment, and a Fear & Greed Index at Extreme Fear. Whether that represents a buying opportunity or a warning depends significantly on your time horizon and risk tolerance.
⚡ Who Is SHIB For?
- Short-Term Trader: Current technical structure (RSI 35, price below both SMAs, negative CMF) suggests caution. Wait for a confirmed breakout above $0.0000070 before considering a momentum entry.
- Long-Term Holder: The SHIB investment thesis depends on Shibarium adoption and burn rate acceleration over a 2-4 year horizon. Monitor ecosystem metrics - TVL, dApp activity, burn wallet accumulation - rather than daily price moves.
- Crypto Beginner: SHIB is a high-volatility speculative asset with no guarantee of future performance. Limit exposure to an amount you could lose entirely without financial consequence.
The two structural factors that will determine SHIB's long-term trajectory are Shibarium's adoption curve and the token burn mechanism's compounding effect on circulating supply. Neither operates on a short timeline. For H2 2026, the key catalysts to watch are: any sustained move above $0.0000070 (50-day SMA resistance), Shibarium transaction volume metrics, and broader Bitcoin cycle positioning.
For those comparing SHIB to established alternatives, Dogecoin's own price trajectory in 2026 illustrates how even more established memecoins face similar structural headwinds absent catalysts. Platforms built on self-custody and on-chain verifiability - where all outcomes and fee structures are visible and auditable by anyone - reflect where the entire on-chain finance ecosystem is heading.
Crypto trading involves substantial risk of loss. SHIB is a speculative asset and this article does not constitute financial or investment advice. Always conduct your own research and consider consulting a qualified financial advisor before making investment decisions.
Last updated: March 2026.
Frequently Asked Questions
What is the current price of Shiba Inu (SHIB)?
As of March 2026, the Shiba Inu price is approximately $0.0000061, placing its market cap at around $3.3 billion. SHIB remains one of the top 20 cryptocurrencies by market capitalization despite the bearish near-term environment. The price has declined from its 2024 highs alongside broader crypto market weakness, with technical indicators including the RSI at 35.42 and both the 50-day and 200-day SMAs sitting above the current price - confirming the downtrend structure. Always verify on CoinMarketCap for the most current reading.
What is the Shiba Inu price prediction for 2026?
The Shiba Inu price prediction for 2026 ranges widely depending on the model. Algorithmic tools like CoinCodex project a bearish year-end 2026 price near $0.00000513, reflecting continued technical pressure absent a macro catalyst. More optimistic analysts cite a range of $0.000020-$0.000035 as achievable if a broad altcoin season materializes in Q3-Q4 and Shibarium activity increases meaningfully. The base case for most of 2026 is consolidation between $0.0000050 and $0.0000075. All 2026 predictions are speculative and not financial advice.
Will Shiba Inu go up in 2026?
A meaningful SHIB price increase in 2026 depends on two primary catalysts: a Bitcoin-led broader market recovery that triggers altcoin season, and continued Shibarium network growth that generates automatic token burns. Without at least one of these, the current bearish technical structure - RSI near 35, price below both major SMAs, CMF in negative territory - suggests more consolidation than rally. Santiment social data as of early 2026 shows fading engagement, which tempers the near-term bull case.
What will SHIB be worth in 2030?
SHIB's 2030 price target represents the widest divergence of any forecast in this analysis. Algorithmic bear models project approximately $0.0000025, reflecting continued supply overhang and potential relevance decay. Optimistic analysts citing sustained Shibarium adoption and compounding burn rates project toward $0.0001 - approximately a 16x gain from current prices. The base case sits around $0.0000080. The range between bear and bull scenarios reflects deep uncertainty about Shibarium's adoption curve and the memecoin sector's long-term viability.
Can Shiba Inu reach $0.0001?
SHIB reaching $0.0001 is within the scope of bullish analyst forecasts for 2029-2030, and would represent approximately a 16x gain from current prices. At that price level, SHIB's market cap would be approximately $59 billion - a high but historically precedented figure for top crypto assets during bull cycles. The path to $0.0001 requires meaningful Shibarium adoption that accelerates burn rates, continued community engagement, and at least one more sustained Bitcoin halving cycle driving alt season activity. It's a plausible bull scenario, not a certainty.
Will Shiba Inu ever reach $1?
Reaching $1 per SHIB would require a market capitalization of approximately $590 trillion - more than six times the value of all global equities, bonds, and real estate combined. This is not a realistic outcome under any credible forecast model. The math simply doesn't support it without supply reduction so extreme it has no historical parallel. Even the most optimistic long-term SHIB forecasts stop well below $0.001. The answer deserves directness: $1 SHIB is not a mathematically credible target.
What is Shibarium and how does it affect SHIB price?
Shibarium is a Layer-2 blockchain built on top of Ethereum, designed specifically for the Shiba Inu ecosystem. It launched its mainnet in August 2023. Its key relevance to SHIB price is mechanical: transaction fees processed on Shibarium generate automatic token burns - SHIB is converted and sent to the dead address, permanently reducing circulating supply. Higher Shibarium adoption means more transactions, more fees, and more burns. This creates a deflationary feedback loop where ecosystem growth and token price pressure are directly connected. Beyond burns, Shibarium supports dApps, games, and DeFi protocols that add utility reasons to hold SHIB beyond pure speculation.
What trading strategy works best for SHIB?
Swing trading is generally the best structural fit for SHIB's behavioral pattern - holding positions for 3-30 days and targeting the bounces between key support and resistance levels. Bollinger Band squeeze breakouts at major support zones provide well-defined entry signals, while resistance levels ($0.0000070, $0.0000075) serve as natural take-profit targets. For longer-horizon participants, trend following aligned with Bitcoin's halving cycle captures the structural alpha in memecoins without requiring active daily monitoring. Day trading and scalping are viable but require significant experience and discipline. For more on crypto staking opportunities within the SHIB ecosystem, see Zipmex's staking guide.
