A crypto fear and greed index turns market data into one sentiment score from 0 to 100. Readings near 0 mean extreme fear and readings near 100 mean extreme greed. There is no single official index. Several publishers build their own from different inputs, so on the same day they can show different numbers. On Oct. 25, 2026, CFGI's daily Bitcoin reading was 37 (Fear), Alternative.me showed 54 (Neutral) and CoinMarketCap showed 45 out of 100. A figure only means something when you know who published it, which timeframe it covers and when it was taken.

Where three indexes stood on Oct. 25, 2026
| Publisher | Reading | Label | As of |
|---|---|---|---|
| CFGI (Bitcoin), daily | 37 | Fear | Oct. 25, 2026, 17:20 UTC |
| CFGI (Bitcoin), 4-hour | 38 | Fear | Oct. 25, 2026, 17:20 UTC |
| CFGI (Bitcoin), 1-hour | 49 | Neutral | Oct. 25, 2026, 17:20 UTC |
| CFGI (Bitcoin), 15-minute | 60 | Greed | Oct. 25, 2026, 17:20 UTC |
| Alternative.me | 54 | Neutral | Oct. 25, 2026 |
| CoinMarketCap | 45/100 | — | Oct. 25, 2026 |
All three are sentiment gauges. The readings differ because the inputs differ. Even one publisher's numbers vary by timeframe: in a single update, CFGI's four views ran from 37 to 60 and covered three labels, from Fear to Greed.
How each index is built
Alternative.me: six weighted factors
Alternative.me runs the best-known crypto version. Its page lists these inputs and weights:
- Volatility, 25%: current volatility and maximum drawdowns compared with 30-day and 90-day averages.
- Market momentum and volume, 25%: current volume and momentum compared with 30-day and 90-day averages.
- Social media, 15%: the Twitter analysis is live. Reddit analysis is not in the live index.
- Surveys, 15%: the page marks these as "currently paused."
- Dominance, 10%: Bitcoin's share of total crypto market capitalisation.
- Trends, 10%: Google Trends data for Bitcoin-related searches.
The index updates daily. The page names 0 as "Extreme Fear" and 100 as "Extreme Greed" but publishes no numeric cut-offs for the bands in between. It rests on "two simple assumptions": extreme fear can show investors are too worried, which "could be a buying opportunity", and too much greed means the market is "due for a correction". It also says the index "does not constitute investment advice."
CFGI: ten indicators, two carrying most of the weight
CFGI's Bitcoin index uses ten indicators. Two of them carry 60% of the score: price (30%) and impulse (30%). The other eight get 5% each: volatility, volume, technical analysis, social, dominance, search, whale activity and order book. The last of these is covered in our guide to [how a crypto order book matches trades](/blog/what-is-an-order-book-in-crypto-and-how-does-it-match-trades/).
CFGI updates every 15 minutes and gives daily, 4-hour, 1-hour and 15-minute readings. Its FAQ sets these bands:
- 0 to 39: fear, with extreme fear below 25.
- 60 to 100: greed, with extreme greed above 75.
- Neutral: the range between the two bands.
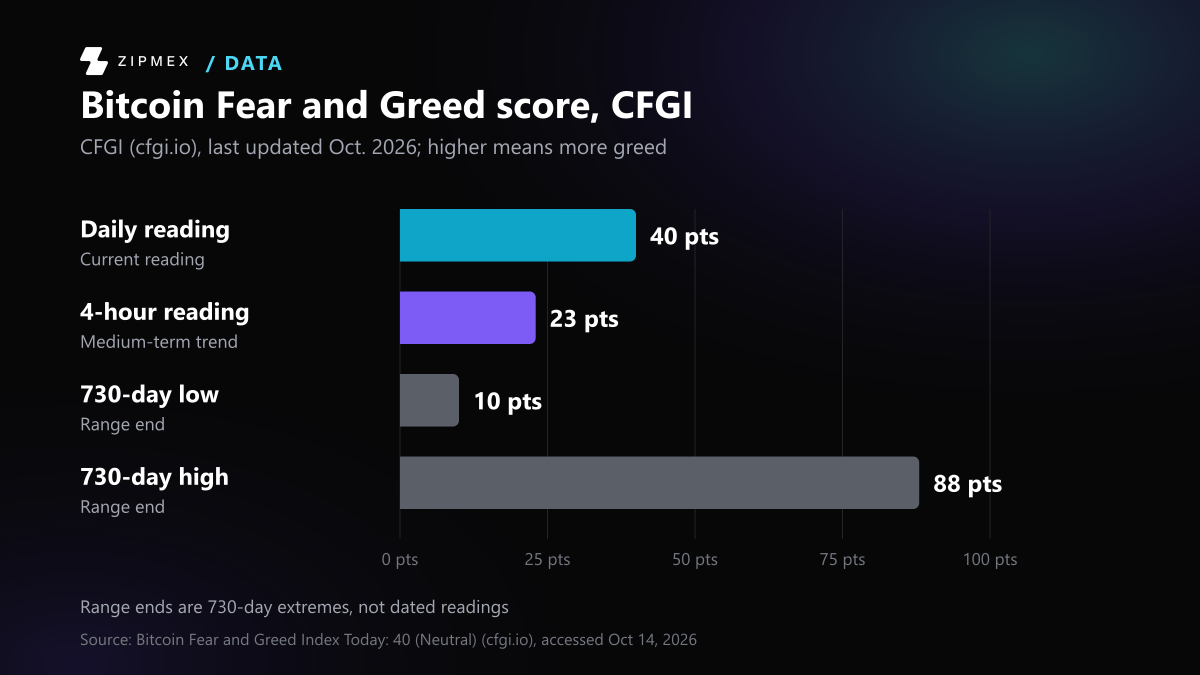
Over the last 730 days, the page says, its Bitcoin reading ranged from 10 (Extreme Fear) to 88 (Extreme Greed).
CoinMarketCap: five components, including derivatives
CoinMarketCap's index also runs from 0 to 100, with lower values for fear. Its five components:
- Price momentum: performance of the top 10 non-stablecoin cryptocurrencies by market capitalisation.
- Volatility: the Volmex implied volatility indices BVIV and EVIV. They measure expected 30-day volatility for BTC and ETH.
- Derivatives market: the put/call ratio in BTC and ETH options. A higher ratio means more fear.
- Market composition: the Stablecoin Supply Ratio (SSR), which compares BTC's market capitalisation with major stablecoins.
- CMC proprietary data: social trend keyword searches and user engagement metrics.
The launch article says the idea comes from "a well-known equities market analytical tool" that had "no cryptocurrency counterpart." It does not name that tool. Like Alternative.me, CoinMarketCap publishes no numeric cut-offs for its sentiment bands.
What does the fear and greed number you saw mean?
Answer a few questions about a reading you've seen to find out what it can and can't tell you.
Do you know which publisher produced the reading?
- Yes → next question
- No, I only saw a number → The number alone means little
Which publisher was it?
- CFGI → next question
- Alternative.me → Alternative.me: only the ends of the scale are named
- CoinMarketCap → CoinMarketCap: no published band cut-offs
Do you know which CFGI timeframe it was: daily, 4-hour, 1-hour or 15-minute?
- Yes → next question
- No → Check the timeframe first
Where does the reading fall on CFGI's 0 to 100 scale?
- Below 25 → CFGI: extreme fear
- 25 to 39 → CFGI: fear
- Between the fear and greed bands → CFGI: neutral
- 60 to 75 → CFGI: greed
- Above 75 → CFGI: extreme greed
There is no single official index, and publishers build theirs from different inputs. On Oct. 24–25, 2026, readings ranged from 35 to 51 depending on the publisher. Find out who published the figure, which timeframe it covers and when it was taken.
Alternative.me calls 0 Extreme Fear and 100 Extreme Greed but publishes no numeric cut-offs for the bands in between. It updates daily, so compare a reading with its own history rather than with CFGI's band edges.
CoinMarketCap's index runs from 0 to 100, with lower values for fear, but it publishes no numeric cut-offs for its bands. Its five components include BTC and ETH options data, so its score is not on the same scale as other indexes.
CFGI gives daily, 4-hour, 1-hour and 15-minute readings, and they can carry different labels. In one update on Oct. 24, 2026 its four views ran from 35 to 42, which is Fear on three of them and Neutral on the 15-minute one.
CFGI labels readings below 25 extreme fear. Its Bitcoin reading has ranged from 10 to 88 over the last 730 days, so compare with that range. CFGI says the index reads sentiment and is not a standalone buy or sell signal.
CFGI's fear band runs from 0 to 39. Compare the reading with the index's own 730-day range of 10 to 88. CFGI says the index reads sentiment accurately but predicts price poorly.
CFGI calls the range between its fear band (0 to 39) and its greed band (60 to 100) neutral. Fast timeframes swing more, so a 15-minute reading can sit in this band while the daily view shows fear.
CFGI's greed band runs from 60 to 100. Compare the reading with the index's own 730-day range of 10 to 88. CFGI says the index is a market sentiment indicator, not a standalone buy or sell signal.
CFGI labels readings above 75 extreme greed. Over the last 730 days its Bitcoin reading peaked at 88. Treat the reading as a measure of crowd mood, not a forecast: CFGI says the index predicts price poorly.
This explains how to read a score using only the publishers' own bands and history. It cannot tell you where prices will go, and it does not cover the numeric bands Alternative.me and CoinMarketCap don't publish.
How the three methods differ in practice
- Coverage: Alternative.me and CFGI's Bitcoin page focus on Bitcoin. CoinMarketCap uses the top 10 non-stablecoin assets, plus BTC and ETH options and volatility data.
- What drives the score: In CFGI, price and impulse make up 60% of the score. In Alternative.me, volatility and momentum/volume make up 50%, and a paused survey component still holds a 15% weight. CoinMarketCap is the only one of the three that uses options data.
- Speed: CFGI refreshes every 15 minutes. Alternative.me refreshes daily. Fast timeframes swing more, as CFGI's own four views show.
How to read a score
- Name the source and the timeframe. "The index is at 40" means little without them. A daily and a 15-minute reading from the same publisher can carry different labels.
- Compare a reading with that index's own history. CFGI's 730-day range of 10 to 88 shows how far its own score usually moves. Comparing one publisher's score with another's band edges mixes two different scales.
- Treat it as a measure of crowd mood, not a forecast. CFGI calls its index "a market sentiment indicator, not a standalone buy or sell signal." It also says the index reads sentiment accurately and "predicts price poorly."
- Expect the publishers to disagree on how to use it. Alternative.me treats extreme fear as a possible buying opportunity. CFGI warns against using the score alone as a signal.
The readings in the table are a snapshot from Oct. 25, 2026. CFGI moves every 15 minutes and the others daily, so today's numbers will differ.