
The BNB price prediction picture for 2026 is genuinely complicated - and anyone telling you otherwise isn't being straight with you. Binance Coin hit an all-time high of $1,369.99 in October 2025, then shed roughly 57% to trade between $570 and $630 by Q1 2026. That's not a subtle pullback. Yet the on-chain fundamentals - 15 million daily transactions, 34 consecutive quarterly burns, a $1.27 billion token destruction in January alone - tell a completely different story from the price chart.
This guide breaks down where BNB actually stands: year-by-year forecasts through 2030, an honest technical read, the burn mechanics that bulls cite as their core thesis, the regulatory overhang that bears won't let go, and practical frameworks for approaching BNB in the current environment.
⚡ Key Takeaways
- Current Price: BNB is trading in the $570-$630 range as of April 2026, approximately 57% below its October 2025 ATH of $1,369.99
- 2026 Base Case: Most analyst consensus clusters between $650-$900, with a bullish scenario reaching $1,000-$1,375 by year-end
- Burn Status: The 34th quarterly burn (January 2026) destroyed 1,371,703 BNB worth $1.277 billion - the largest by dollar value in recent quarters; 65.6 million BNB burned in total
- Key Risk: Ongoing Binance regulatory scrutiny, including a Senate inquiry letter dated April 1, 2026, creates meaningful downside event risk
- Bottom Line: BNB's trajectory in 2026 hinges on whether the $600 support level holds and whether Binance resolves its compliance narrative
What Is BNB and How Does Its Price Work?
BNB launched in July 2017 as an ERC-20 token during Binance's ICO at roughly $0.15 per token. Its original purpose was straightforward: pay trading fees on Binance at a 25% discount. By 2019 it had migrated to Binance's own chain, and by 2022 the ecosystem had expanded so dramatically that BNB had become something much more layered - simultaneously an exchange utility token, the native gas token for BNB Smart Chain, and a key asset within a sprawling DeFi and gaming ecosystem.
What makes BNB's price mechanics distinct from most Layer 1 assets is the structural linkage between token demand and exchange activity. When Binance processes high trading volume, demand for BNB rises across multiple vectors simultaneously - fee payments, margin, liquidation mechanisms. That creates a correlation with Binance's fortunes that no amount of ecosystem diversification has fully severed. Circulating supply currently sits at approximately 136.36 million tokens, down substantially from the original 202 million, thanks to 34 consecutive quarterly burns.
The BNB Auto-Burn Mechanism Explained
Four times a year, BNB is permanently destroyed through the Auto-Burn mechanism. The formula accounts for two variables: the current BNB price and the total number of BSC blocks produced during the quarter. Higher network activity (more blocks) means more BNB gets burned. A higher BNB price, counterintuitively, means fewer tokens burned by count - because the dollar-value threshold is reached with fewer tokens.
The 34th quarterly burn, completed in January 2026, removed 1,371,703 BNB from circulation - equivalent to $1.277 billion at prevailing prices, the largest dollar-value burn on record. More than 65.6 million tokens have been destroyed in total, pushing the supply well below the original 202 million. The long-term target is 100 million tokens total - meaning another ~36 million BNB are scheduled for destruction over coming years.

BNB Price History and Current Technical Picture (2025-2026)
BNB's 2025-2026 arc follows a pattern crypto veterans will recognize immediately. After recovering through 2024 - aided substantially by the $4.3 billion DOJ settlement that resolved Binance's largest legal overhang - BNB built momentum into an explosive Q3/Q4 2025 rally. The October 2025 all-time high of $1,369.99 was driven by a confluence of market-wide optimism, BNB Chain's Maxwell Upgrade catalyzing developer activity, and global bull sentiment building since the 2024 Bitcoin halving cycle.
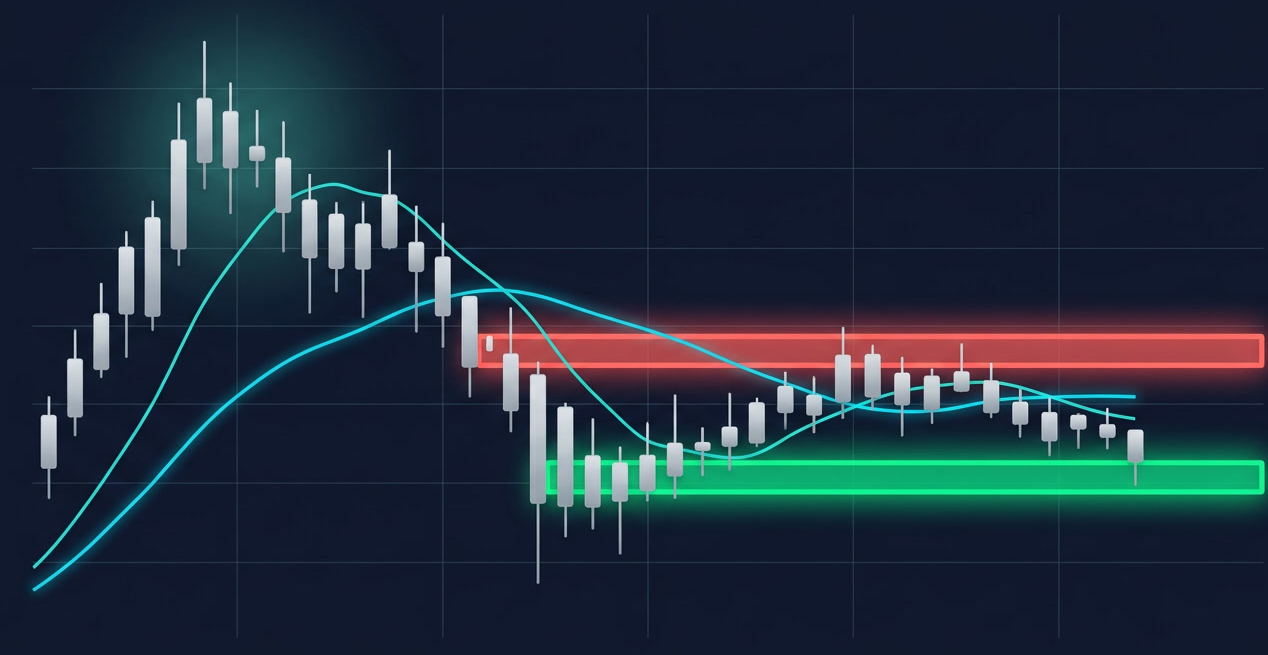
What followed was a textbook post-ATH correction. By Q1 2026, BNB had retraced to the $570-$630 zone - almost exactly where it was trading before the entire October 2025 rally began. The 200-day simple moving average, which had been acting as dynamic support throughout the run-up, flipped to resistance at approximately $696. That's the clearest technical warning sign in the current setup.
BNB PRICE MILESTONES - KEY TIMELINE
June 2022
Cycle low at ~$183 - bear market bottom after 2021 bull run
Late 2023
Base building phase at $200-$210; DOJ settlement removes key overhang
H1 2024
Recovery to $300-$500 post-settlement; institutional confidence returns
Q3 2025
Pre-ATH accumulation at $750-$900; Maxwell Upgrade activates developer interest
October 2025
All-time high of $1,369.99 - strongest BNB price ever recorded
Q1-Q2 2026 (Current)
Post-ATH correction to $570-$630 range - 57% drawdown, critical support test
The bulls' argument is that BNB is in accumulation, not distribution. Each pullback into the $570-$600 zone gets absorbed without extended selling pressure - a behavioral signature of buyers defending a level strategically. The bears counter that a 57% decline from ATH with the 200-day SMA overhead is a structural downtrend until proven otherwise. Both readings are technically defensible.
Key Technical Levels to Watch in 2026
The RSI is reading between 34 and 44 on various timeframes - firmly in neutral-to-bearish territory, but not yet in oversold conditions that historically precede sharp reversals. The MACD presents a more cautionary picture: the histogram has been negative for weeks, confirming bearish momentum, though the rate of decline has slowed. One risk technically oriented traders are watching: if the 50-day SMA crosses below the 200-day SMA (a "death cross"), it typically accelerates selling pressure. The Fear & Greed Index scoring 9-15 (Extreme Fear) is one contrarian signal bulls point to - but Extreme Fear in a downtrend is not a buy signal on its own.
BNB Price Prediction 2026 - Analyst Forecasts and Scenarios
The honest reality of any BNB price prediction for 2026 is that the analyst range is enormous. You'll find credible sources projecting everything from $400 to $1,375 for the same calendar year - a spread that reflects genuine uncertainty rather than analytical incompetence. The three-scenario framework below separates the forecasts by the conditions required for each to materialize.
✕ BEAR CASE
$400-$580
Regulatory enforcement action against Binance; broader crypto market correction; BTC breaks below key support. Requires a negative macro or regulatory catalyst.
◎ BASE CASE
$650-$900
$600 support holds; burn mechanics provide floor; gradual macro recovery through H2 2026. Consensus among most technical analysts including InvestingHaven and Changelly.
✓ BULL CASE
$1,000-$1,375
Full macro recovery; BNB Chain 20,000 TPS roadmap execution; regulatory clarity; volume recovery. Requires BNB reclaiming 200-day SMA with sustained volume expansion.
All price predictions are speculative. Past price performance does not guarantee future results.
The bear case doesn't require a catastrophe - just a regulatory enforcement action combined with a broader market correction. The $400 floor represents the major demand band that held during the 2022-2023 bear cycle.
The base case is where most technical analysts land. CoinCodex places the annual range at $823-$1,374, InvestingHaven projects an average around $740, and Changelly's month-by-month model shows progressive recovery through the year, peaking near $984 in December 2026.
The bull case centers on Fibonacci extension targets. A breakout above the 200-day SMA zone at $696 with volume expansion would be the first credible signal. Analysts working off the October 2025 correction use the $570-$1,369 range to project retracement levels at approximately $870 (0.618 retracement) and $970 (0.786 retracement). The $1,000 psychological level carries disproportionate weight - multiple forecasters treat it as the threshold that separates a "recovery" narrative from a "continuation" narrative.
For a broader sense of how similar large-cap predictions play out, our XRP price prediction analysis covers the same three-scenario framework and is worth reading alongside this guide.
Monthly BNB Price Forecast Q1-Q4 2026
Breaking these annual forecasts down quarter by quarter helps investors set realistic expectations. The drivers shift meaningfully each period.
Q1 2026 played out largely as the consolidation scenario predicted. Q2 is where the first real directional signal should emerge - the opBNB Fourier Hard Fork (January 7, 2026), which halved L2 block time to 250ms, is beginning to show measurable effects in developer activity and transaction throughput. If those metrics translate to exchange volume growth through Q2, the $670-$750 range becomes achievable. Q4 is where most analyst consensus targets converge at the $900-$984 range, driven by seasonal patterns and the structural argument that burn mechanics gradually reduce available supply.
BNB Price Prediction 2027-2030 - Long-Term Outlook
Long-term BNB price predictions should come with a prominent caveat: the variance between credible analyst models widens dramatically past 24 months. These aren't predictions - they're scenarios built on different assumptions about regulatory outcomes, ecosystem competition, and macro crypto adoption.
These are illustrative scenarios based on aggregated analyst research. All figures are speculative.
The 2027 outlook depends heavily on regulatory stabilization. InvestingHaven projects BNB reaching approximately $1,500 by 2028 if clarity materializes. The Binance users' consensus tool forecasts roughly $976 by 2030 - a conservative number implying modest compounding from current levels. CoinPedia's more aggressive $2,000+ territory by 2030 requires BNB Chain to successfully execute its 20,000 TPS target and retain DeFi market share against intensifying Layer 2 competition.
What I'd push back on: the $10,000 BNB by 2030 projections that occasionally appear on prediction aggregators. At $10,000, BNB's market cap would need to reach approximately $1.3 trillion - roughly equivalent to the entire crypto market cap as of early 2026. Serious analysts uniformly dismiss this.
Key Factors That Will Drive BNB Price in 2026 and Beyond
Five structural forces will determine which of the 2026 scenarios plays out. Each deserves honest treatment - including those that cut against the bull thesis.
BNB Chain Technical Roadmap 2026 - Upgrades and Catalysts
The Q1 2026 on-chain metrics confirm these upgrades are translating to real usage: 15 million daily transactions and approximately 800 million unique addresses. For context, that daily transaction figure places BSC among the most actively used blockchains globally.
BNB CHAIN UPGRADE TIMELINE 2025-2026
April 2025
Lorentz Hard Fork - Reduced block times specifically for latency-sensitive DeFi and gaming applications. Measurable performance improvements confirmed by developer metrics.
June 30, 2025
Maxwell Upgrade - Main block time reduced from 0.75s to 0.45s. Final phase of Short Block Interval Roadmap. Five Binance Enhancement Proposals (BEPs) for validator coordination.
January 7, 2026
opBNB Fourier Hard Fork - L2 block time halved to 250ms, doubling throughput. Positions opBNB as a direct competitor to Base and Arbitrum for low-fee, high-speed applications.
2026 Target
20,000 TPS + Sub-Second Finality - Enterprise and high-frequency application viability. The headline goal of BNB Chain's public 2026 roadmap.
Regulatory Risks and the Binance Compliance Story
Regulatory risk is the variable that most BNB prediction models underweight - so it deserves direct treatment. The $4.3 billion DOJ settlement completed in 2024 resolved Binance's most significant legal exposure without criminal charges. Markets reacted positively: the resolution enabled BNB's Q3-Q4 2025 rally.
What markets are navigating now is the next chapter. On April 1, 2026, Senator Richard Blumenthal sent a follow-up inquiry to Binance's CEO demanding clarification on alleged discrepancies regarding transactions linked to Iran. This escalates regulatory uncertainty in a specific and meaningful way.
✓ REGULATORY BULLS
- DOJ settlement established a compliance precedent
- Multiple jurisdictions developing clearer crypto frameworks in 2026
- Binance proactively investing in compliance infrastructure
- Clearer rules in major markets would unlock institutional BNB demand
- Post-settlement leadership focused on regulatory posture
✕ REGULATORY BEARS
- April 2026 Senate inquiry reopens political scrutiny
- BSC uses only 21 PoSA validators - centralization criticism persists
- Historical regulatory history creates reputational friction
- Any new enforcement action could trigger a rapid sell-off
- U.S. regulatory environment for crypto remains complex

How to Evaluate BNB as an Investment - Key Criteria
A structured evaluation framework beats gut instinct when assessing any large-cap crypto asset. These five dimensions matter most for BNB specifically - not a buy/sell recommendation, but a methodology for forming your own informed view.
BNB vs. Competitors - Fair Comparison for 2026 Investors
For a deeper read on what makes Solana a different risk-reward proposition versus BNB, our Solana overview covers the key technical differentiators. The honest read on BNB versus its competitors: BNB Chain wins on fees and EVM compatibility among established chains, but the field has narrowed significantly since 2022.
Risks, Red Flags, and BNB Scam Warnings for 2026
BNB carries real risks that deserve serious attention - and the BNB content ecosystem has a specific scam problem worth addressing directly.
The three structural risks: regulatory event risk (a negative Binance enforcement action has historically produced rapid 15-30% BNB sell-offs), exchange dependency risk (BNB's value is structurally intertwined with Binance's trading volume and reputation), and centralization risk (21 PoSA validators is a meaningful concentration that institutional allocators and self-custody advocates consistently flag).
⚠ Warning Signs in BNB-Related Content
- Price predictions of $100,000+ → Mathematically inconsistent with market cap constraints
- Articles pivoting to presale tokens → "100x-300x returns" and "confirmed Binance listing" claims exploiting BNB's credibility
- Fixed APY staking offers above 50-100% → No legitimate explanation of yield source
- "Guaranteed" price targets → All crypto price predictions are speculative by nature
- BNB Chain affiliation as primary legitimacy signal → Requires audits and verifiable on-chain presence
- Content that ignores regulatory risk entirely → Signals incomplete or biased analysis
- Urgency language around "limited windows" → Classic pressure tactic, not analytical insight
- Leveraged positions framed as low-risk → Leverage amplifies losses just as it amplifies gains
BNB Investment Strategies - How to Approach BNB in 2026
Different investors have legitimate reasons to approach BNB differently in 2026's corrective environment. These are frameworks for thinking, not financial recommendations - crypto trading involves substantial risk of loss.
BNB Trading Strategies - Approaches for Active Traders
These are educational patterns based on standard technical analysis methodology - not trading recommendations.
Past performance does not guarantee future results. These patterns carry substantial risk of loss.
Conclusion - Who Should Consider BNB in 2026?
Based on the technical analysis and fundamental factors examined in this guide, BNB in 2026 isn't a single investment thesis - it's several different theses depending on your horizon, risk tolerance, and what you think resolves first between the regulatory uncertainty and the ecosystem momentum.
Long-term believers in BNB Chain's technical roadmap have the strongest structural case. The burn mechanics are on-chain and verifiable - they don't depend on company promises. If $600 support holds and the regulatory story doesn't deteriorate significantly, $900-$1,000 by Q4 2026 is a defensible base case.
Short-term traders working with defined technical levels have a functional range to work with. The $570-$700 band has offered multiple swing opportunities in 2026 already, and the setup remains intact as long as $550 holds on the downside.
Risk-averse investors should be clear-eyed about what they're accepting with BNB: exposure to Binance's regulatory trajectory, a 21-validator consensus mechanism, and an $86B market cap that limits explosive upside while still carrying crypto-level downside risk.
For a comparison of how other prediction market assets behave in similar post-ATH correction environments, our cryptocurrency predictions overview provides useful historical context. Platforms built around on-chain transparency, self-custody, and verifiable mechanics reflect where serious crypto infrastructure is heading - and BNB Chain's push toward trustless, verifiable outcomes is directionally aligned with that trajectory.
Crypto trading involves substantial risk of loss. BNB price predictions are speculative and should not be treated as financial advice. Always conduct independent research and consult a qualified financial advisor before making any investment decisions.
Last updated: April 2026.
Frequently Asked Questions
What is the BNB price prediction for 2026?
Based on current technical analysis and analyst forecasts, the 2026 BNB price prediction spans a wide range reflecting genuine market uncertainty. The base case consensus sits between $650 and $900 for most of the year, with Q4 targets clustering around $900-$984. The bull case reaches $1,000-$1,375 if BNB reclaims its 200-day SMA with volume expansion. The bear case - triggered by regulatory pressure or broader market collapse - puts BNB in the $400-$580 range. All predictions are speculative; BNB's actual trajectory depends heavily on whether the $600 support level holds through H1 2026 and how Binance's regulatory situation develops.
Will BNB reach $1,000 in 2026?
Reaching $1,000 in 2026 is possible but requires a specific set of conditions to align. Based on current technical analysis and analyst forecasts, BNB would need to reclaim the 200-day SMA (~$696), break through the $820-$900 resistance zone, and sustain volume expansion - a sequence that typically requires either a catalyst event or a broad crypto market recovery. Multiple forecasters place $1,000 within their bull scenarios: CoinCodex projects up to $1,374, Changelly targets $984 for December 2026. The $1,000 psychological threshold is widely treated as the key marker separating a "recovery" narrative from a "continuation" one. Achievable under the right conditions, but not the base case from current price action.
Why did BNB drop from its all-time high?
BNB's 57% decline from the October 2025 ATH of $1,369.99 reflects multiple converging factors rather than a single event. Post-ATH corrections of this magnitude are common in crypto after extended bull cycles - BNB followed a similar pattern after its 2021 ATH. Specific drivers include the broader market entering a post-cycle consolidation phase, renewed regulatory scrutiny of Binance through the April 2026 Senate inquiry, and natural profit-taking from investors who accumulated during the 2024 recovery. The $600 level is technically significant because it represents BNB's price before the entire October rally - making the correction a near-complete round trip on a price basis, which is why bulls treat this zone as structurally important.
What is the BNB Auto-Burn and how often does it happen?
The BNB Auto-Burn mechanism permanently destroys tokens four times per year using a formula based on the current BNB price and the number of BSC blocks produced in the quarter. Higher network activity means more tokens burned; higher BNB prices mean fewer tokens burned by count but larger dollar value destroyed. The 34th burn (January 2026) removed 1,371,703 BNB worth $1.277 billion - the largest by dollar value in BNB's history. Over 65.6 million BNB have been burned in total since the mechanism began, reducing circulating supply from 202 million toward the long-term 100 million target. The entire process is verifiable on-chain and executes automatically, independent of Binance management discretion.
What are the biggest risks for BNB in 2026?
Three risks stand out above the rest. First, regulatory event risk: the April 2026 Senate inquiry represents ongoing oversight attention that could escalate into enforcement action - Binance regulatory news has historically produced rapid BNB price movements in either direction. Second, exchange dependency risk: BNB's price is structurally tied to Binance's trading volume and reputation; sustained market share loss to decentralized or competitor exchanges erodes the core demand thesis. Third, centralization risk: BSC's 21 Proof of Staked Authority validators create a risk profile that institutional allocators consistently flag, differing meaningfully from more decentralized alternatives and limiting appeal to compliance-sensitive capital.
How does BNB compare to Ethereum and Solana as an investment in 2026?
BNB, Ethereum, and Solana represent meaningfully different risk-return profiles from the same large-cap category. BNB at ~$86B market cap offers predictable demand mechanics via exchange volume correlation and quarterly burns, plus a large established DeFi ecosystem - but carries Binance regulatory risk and centralization concerns. Ethereum dominates on developer ecosystem depth and security, with L2s like Base and Arbitrum addressing its fee problem. Solana leads on raw throughput and ultra-low fees, dominating high-frequency applications. From a pure investment standpoint, none is objectively superior - each suit different portfolio strategies and risk tolerances. BNB's specific counter-arguments are its EVM compatibility, established BSC ecosystem, and the mechanical supply reduction from burns.
Is BNB a good investment for beginners in 2026?
BNB is not an ideal first crypto investment for complete beginners. The asset carries meaningful regulatory complexity tied to Binance's ongoing compliance journey, an $86B market cap that requires understanding crypto market cap math to evaluate realistically, and a price structure currently in a post-ATH corrective phase that demands more than basic analysis to navigate. Beginners are better served starting with more straightforward assets before adding position-specific complexity. For those with intermediate crypto knowledge who understand self-custody wallets, DeFi mechanics, and the difference between fundamental and technical analysis, BNB offers a legitimate - if higher-complexity - investment thesis centered on the burn mechanics and BNB Chain's technical roadmap. Always start with research, and never invest more than you can afford to lose entirely.
