
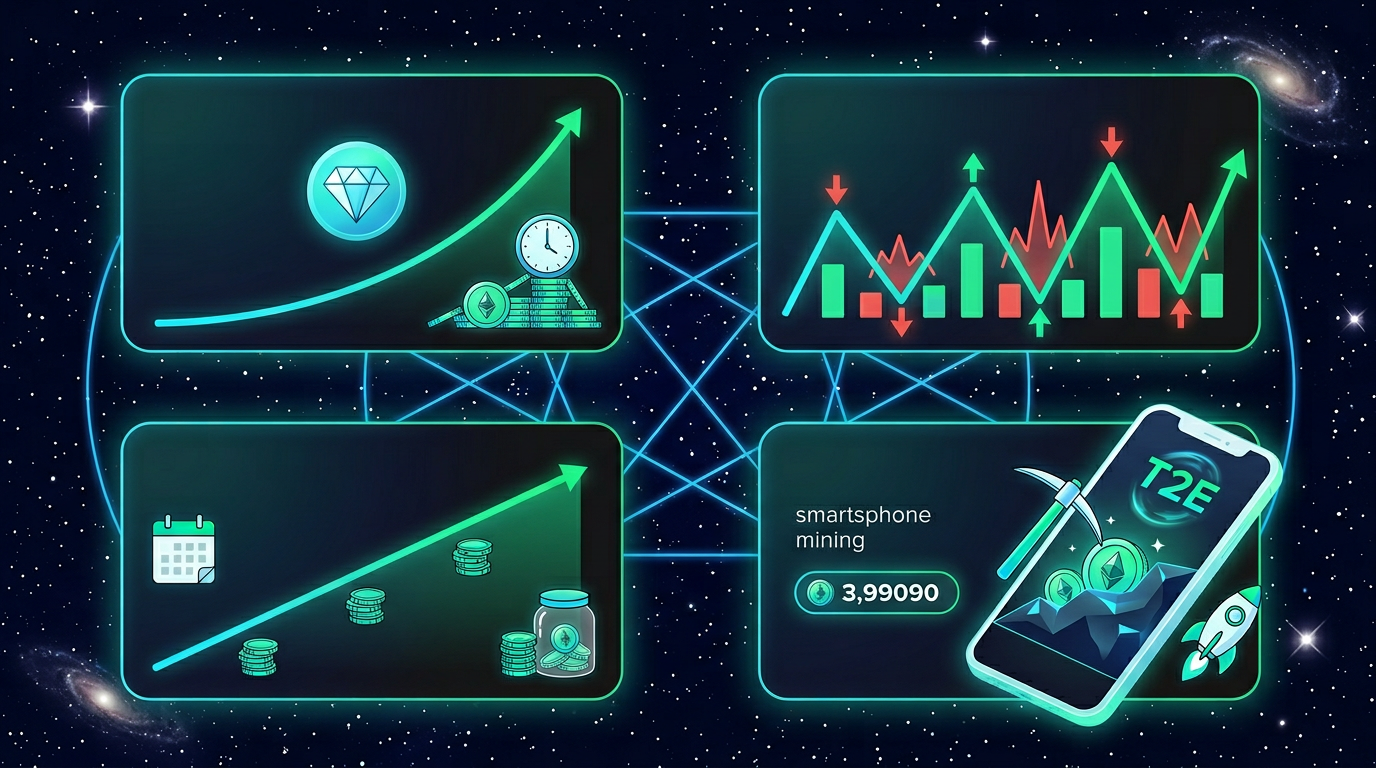
The ant price prediction question has become one of the more searched queries in the T2E (Time-to-Earn) niche since ANTTIME launched on MEXC and PancakeSwap in August 2026. This guide covers everything that actually matters: short- and long-term price forecasts backed by algorithmic models, a full technical indicator breakdown, the key drivers behind ANT's price action, and an honest risk assessment that most prediction articles skip entirely.
ANTTIME isn't just another speculative micro-cap. It's a Web3 ecosystem built around the idea that time - the one resource distributed equally to every person on earth - can be converted into a tradable digital asset. Whether the token's price reflects that vision depends on a lot of moving parts. Here's what the data currently shows.
⚡ Key Takeaways
- Current ANT price: approximately $0.000158-$0.000294 (ranges vary by exchange; verify on MEXC for live data)
- Technical sentiment: 15 bullish vs. 4 bearish indicators per CoinCodex; RSI ~57 (neutral)
- 2026 bull target: ~$0.000344 (CoinCodex algorithmic model, end-2026)
- 2030 bull target: ~$0.001082 (CoinCodex peak scenario, October 2030)
- Forecast disclaimer: All price predictions carry substantial uncertainty. ANT is a high-volatility micro-cap token. This article is for informational purposes only and does not constitute financial advice.
What Is ANTTIME (ANT)? Understanding the Project Behind the Token
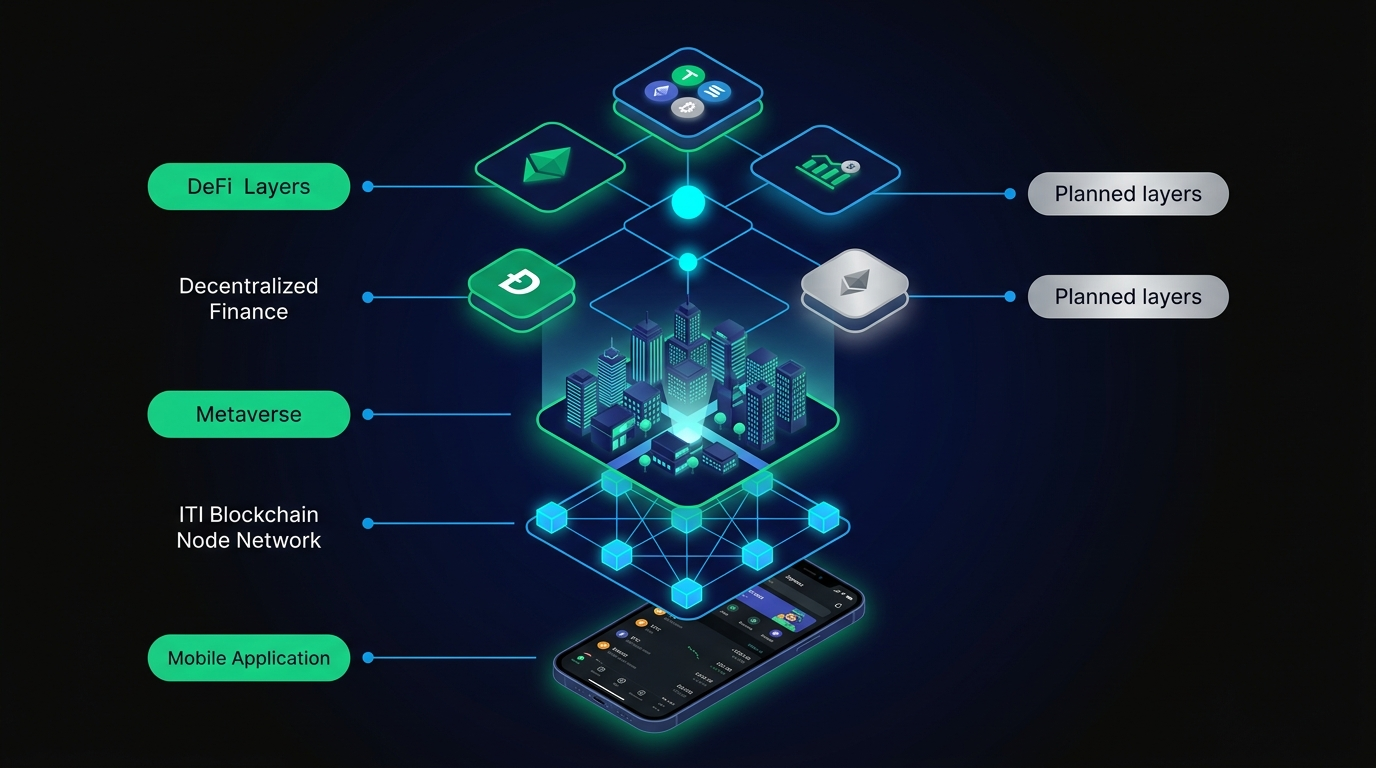
ANTTIME is a Time-to-Earn (T2E) Web3 ecosystem that merges Game-Fi and Social-Fi mechanics into a single mobile-first platform. The premise is unusually accessible: users download the app, tap once per hour to "mine" TIME Coins, and grow their earnings by referring friends who each boost the mining rate. No upfront capital required.
That's an important distinction in a space where most yield-generating protocols demand you put money in first. ANTTIME inverts the model - your time is the input, tokens are the output. The ANT token (BEP-20 standard, running on Binance Smart Chain) serves as the central currency connecting every layer of the ecosystem: the mobile app, the upcoming metaverse layer (ANTTAVERSE), and the planned DeFi and real-world asset (RWA) integrations on the TIME Blockchain. If you're new to how blockchain-based gaming ecosystems are structured, our guide to the future of blockchain gaming covers the foundational mechanics well.
The TIME Blockchain uses a Proof of Authority (PoA) consensus mechanism with 1-second block generation. It's designed for throughput over decentralization - a deliberate trade-off given the high-frequency, micro-transaction nature of T2E mining activity. Node validator status requires holding at least 10 million TIME Coins, with the network capped at 1,000 validators.
The TGE (Token Generation Event) occurred on August 7, 2026, alongside simultaneous listings on MEXC and PancakeSwap. The ANTSWAP DEX also launched on that date, providing native liquidity for the token within the ecosystem itself.
ANTTIME Tokenomics: Supply, Distribution & Utility
The ANT token's economic architecture is designed for a long-term ecosystem play. According to ANTTIME's official whitepaper, ANT (BEP-20) is the central ecosystem currency that will eventually migrate to native TIME Coin on the TIME Chain mainnet - but only for KYC-verified holders. That KYC gate is worth noting. Unverified holders face uncertainty around the migration, which creates a structural risk discussed in detail in the Red Flags section below.
Future utility drivers include ANTSWAP (the native DEX already operational), a cross-chain bridge connecting TIME Chain to external networks, DeFi services utilizing TIME Chain assets, and RWA integration linking TIME-based assets to tangible physical assets. Each of those milestones, if executed, expands the addressable demand for ANT tokens meaningfully.
ANTTIME Price History: From Launch to Today
ANT launched at the TGE in August 2026 and immediately hit a staggering all-time high of $1.9004 - a figure that reflects the speculative frenzy typical of new token launches with limited float and high social buzz. The correction that followed was equally dramatic. By early 2026, ANT was trading in the $0.000158-$0.000294 range depending on the source, representing a decline of more than 99% from the ATH.
That ATH-to-current ratio is jarring, but not unusual for early-stage T2E tokens. The pattern - explosive launch, deep correction, potential recovery tied to ecosystem development - has played out across multiple Web3 gaming and play-to-earn blockchain game projects. Whether ANTTIME follows a recovery arc or continues declining depends almost entirely on the factors covered in the next sections.
The 90-day price trend has been flat to slightly negative, but the most recent 7-day window showed a +13% move, suggesting some renewed buying pressure. With ANT ranked #4741 on CoinMarketCap, volume remains thin. Against this historical backdrop, here is what forecast models currently project for ANT.
ANTTIME (ANT) Price Prediction 2026-2030: Short & Long-Term Forecasts
Multiple forecast models exist for ANT, and they diverge significantly - which is itself informative. Algorithmic models like CoinCodex incorporate historical price data, Bitcoin halving cycle patterns, and technical indicators. User-input calculators on MEXC, Bitget, and Coinbase are simply extrapolations of whatever annual growth rate you feed them. Neither type is a prophecy. For broader context on how to evaluate crypto price forecast methodologies, see our XRP Price Prediction guide, which covers framework differences in depth.
What follows synthesizes the most credible available data across both model types. All figures should be verified at the time of reading - micro-cap crypto prices move fast.
⚠ Risk Disclaimer
- Crypto trading involves substantial risk of loss. The forecasts below are based on algorithmic models and historical patterns.
- They are not financial advice and should not drive investment decisions independently.
- ANT is a high-volatility micro-cap token - past price action does not predict future results.
Sources: CoinCodex algorithmic model (primary), MEXC 5% base growth model (conservative baseline). Data as of April 2026.
ANT Price Prediction 2026 (Short-Term Outlook)
For the remainder of 2026, CoinCodex's algorithm projects ANT trading between approximately $0.000206 (minimum) and $0.000344 (December peak), with an average hovering around $0.000234. That's a relatively compressed range given the token's history.
The technical picture supports cautious optimism. CoinCodex currently shows 15 bullish technical indicators against just 4 bearish signals. The RSI sits at approximately 57 - comfortably in neutral territory, neither overbought nor in distress. The 50-day SMA is around $0.000294, which roughly aligns with the current price zone and acts as a near-term equilibrium point. Moving averages confirm the sideways-to-slightly-upward trend without strong conviction in either direction.
One contrarian note: the Crypto Fear & Greed Index was reading at 14 - Extreme Fear - at the time of analysis. Historically, extreme fear readings in broadly correlated assets tend to precede recoveries. Whether that translates to ANT specifically depends on market-wide conditions, not just ANT's on-chain activity.
Short-term micro-cap forecasts carry extremely high uncertainty - treat any specific 2026 target as a directional probability, not a price ceiling.
ANT Price Prediction 2027-2029 (Mid-Term Outlook)
The most interesting signal in the mid-term forecast is the projected price spike in January 2027: CoinCodex models ANT ranging from $0.000364 to $0.000806 during that month, which would represent a 174% return from current levels at the high end. That's a notable outlier compared to the subdued 2026 range.
The likeliest driver? Bitcoin's market cycle. BTC underwent its fourth halving in April 2024, and the lag between halving and peak bull market sentiment typically runs 12-18 months - placing the expected bullish momentum squarely in late 2026 through early 2027. ANTTIME, like most altcoins with low market cap, tends to outperform BTC in macro bull conditions and underperform sharply in contractions. Bollinger Bands on ANT currently show very high volatility (11.15% per CoinCodex), confirming that when ANT moves, it moves hard in both directions.
After the projected 2027 peak, the model shows a meaningful correction in 2028 (prices falling back toward the $0.000280-$0.000415 range) as post-bull profit-taking and broader market cooling take effect. Support and resistance zones in the $0.000200-$0.000300 range would likely define the floor during that period. 2029 then shows a stabilization and recovery, with averages returning to the $0.000365 area.
ANT Price Prediction 2030 & Beyond (Long-Term Vision)
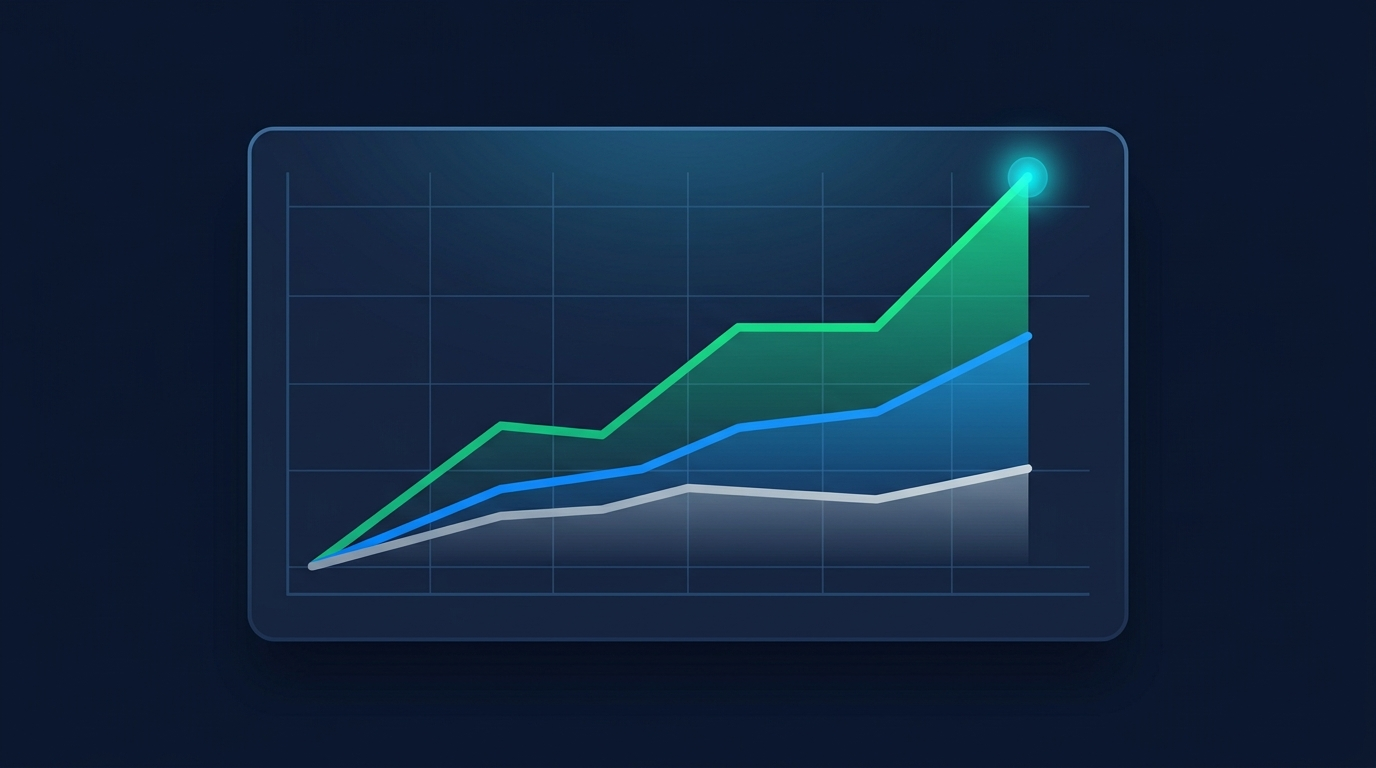
By 2030, the forecast range widens dramatically - as it should for any speculative asset five years out. CoinCodex's bull scenario places ANT at $0.001082 in October 2030, with the base case around $0.000702. MEXC's conservative model comes in at $0.000192 at 5% annual growth. For 2040, CoinCodex projects $0.001926; for 2050, $0.005531.
The bull case rests on a specific set of catalysts: TIME Chain mainnet launch, ANTSWAP growing into a credible DEX with genuine liquidity, a cross-chain bridge opening TIME Chain assets to broader DeFi participation, RWA integration creating real-world demand, and new CEX listings for TIME Coin. The bear case is simpler: competition from established T2E projects, sustained token emission pressure, and weak roadmap execution.
Understanding the forecasts is only half the picture - let's examine what actually drives ANT price movements.
Key Factors That Drive the ANT Price
No forecast model captures the full complexity of what moves a micro-cap token's price. These are the dominant variables to track for ANT specifically:
Bitcoin correlation deserves emphasis. Tokens in the T2E and GameFi category historically amplify BTC's directional moves - positive and negative. When BTC runs, small-cap project tokens often outperform on percentage terms. When BTC corrects sharply, micro-caps like ANT typically take disproportionately large drawdowns. ANTTIME's price trajectory cannot be analyzed in isolation from the broader crypto market cycle. For a detailed look at how Bitcoin's halving cycle affects altcoin valuations, see our Bitcoin price prediction guide.
The referral mechanic is an underappreciated demand driver. Every new user who joins through a referral link increases the referring user's mining rate - which in turn incentivizes holding ANT rather than immediately selling. That holding incentive creates organic demand pressure that standard price models don't capture.
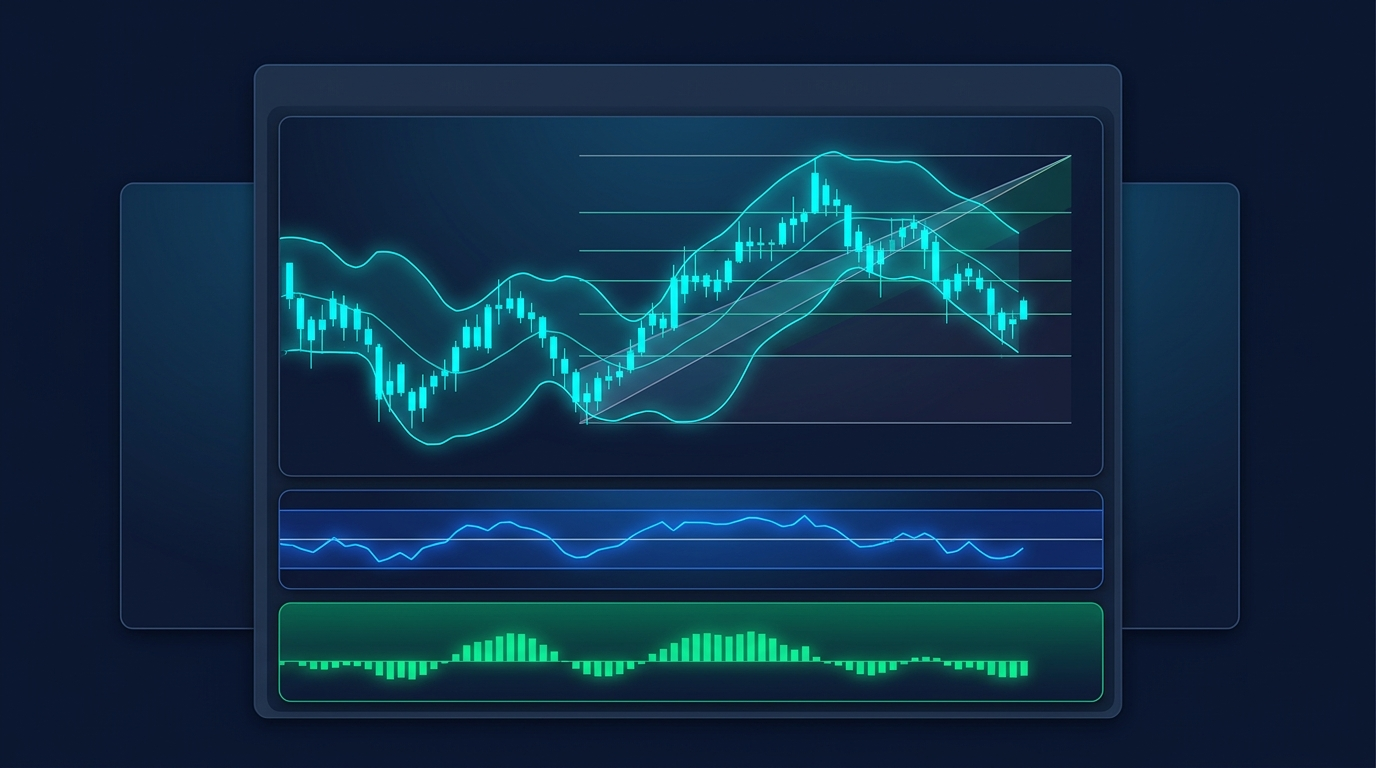
Technical Analysis: Reading ANT Price Charts
Technical analysis is particularly relevant for high-volatility micro-cap tokens like ANT. When a token moves 11.15% in a single day (ANT's current volatility rating per CoinCodex: "Very High"), chart patterns and momentum indicators can identify turning points that fundamental analysis alone can't time. For a foundational primer on how to use these tools, our guide to reading cryptocurrency charts covers candlesticks, moving averages, and support/resistance from first principles.
RSI (Relative Strength Index): At approximately 57, ANT's RSI sits in neutral territory. Values above 70 indicate overbought conditions; values below 30 suggest oversold and potentially attractive entry points for contrarian traders. The current 57 reading means there's room to move higher before hitting overbought pressure.
Moving Averages: The 50-day SMA sitting at roughly $0.000294 acts as a near-term reference point. When ANT trades above this level, that's generally a bullish signal; below it suggests bearish momentum. ANT is currently trading close to that level, confirming the sideways consolidation visible in recent price action.
Bollinger Bands: Extremely wide bands relative to price indicate high volatility - exactly what 11.15% daily volatility suggests. When Bollinger Bands contract (squeeze), they often precede sharp directional moves. Traders watching ANT for breakout setups should monitor for a band contraction as a potential setup signal.
MACD (Moving Average Convergence Divergence): The MACD histogram shows slight positive momentum following the recent +13% weekly move. A confirmed MACD signal-line crossover above zero would strengthen the bullish case for 2026.
Fibonacci Retracement: Measured from the $1.90 ATH to the current trading range, Fibonacci levels place the 0.786 retracement in the $0.000150-$0.000160 zone - which aligns closely with current price action, suggesting genuine support at these levels.
How to Buy ANTTIME (ANT): Step-by-Step Guide
ANT is available through two primary routes. Always verify the correct contract address before any transaction - token impersonation is a common scam in the micro-cap space.
Route 1: Buy ANT on MEXC (Centralized Exchange)
- Create a MEXC account and complete KYC verification.
- Deposit USDT via bank transfer, card, or crypto transfer from another wallet.
- Navigate to Spot trading and search for the ANT/USDT pair.
- Set your order type (market for instant fill, limit for price control) and execute.
- Transfer ANT to a self-custody BEP-20 wallet (MetaMask, Trust Wallet) for secure storage.
Route 2: Buy ANT on PancakeSwap or ANTSWAP (Decentralized)
- Set up a BEP-20-compatible wallet (MetaMask with BSC network, or Trust Wallet).
- Acquire BNB for transaction gas fees via any exchange.
- Transfer BNB to your wallet.
- Visit PancakeSwap or ANTSWAP (ANTTIME's native DEX, launched August 2026) and connect your wallet.
- Paste the verified ANT contract address from ANTTIME's official website and swap BNB or USDT for ANT.
- Confirm the transaction in your wallet. ANT will appear once confirmed on BSC.
⚠ Critical: Verify Contract Address
- Always copy the ANT contract address directly from ANTTIME's official website or MEXC's official token page.
- Never use a contract address from social media, Telegram groups, or community messages.
- Impersonation tokens exist on BSC - always double-check before transacting.
ANT is stored in any BEP-20 compatible wallet. Self-custody is the more secure option for holdings you don't intend to trade actively.
Is ANTTIME a Good Investment? How to Evaluate ANT
Before making any investment decision regarding ANT, evaluate several key metrics that separate informed risk-taking from speculation. This isn't a recommendation to buy or sell - it's an analytical framework for assessing the token on its own merits.
The liquidity figure deserves direct attention. A daily trading volume of $9,000-$14,000 means that a moderately sized buy or sell order can move the price significantly. Anyone entering with a five-figure position in USD would face material slippage and struggle to exit quickly if conditions deteriorated. CoinMarketCap ranks ANT at #4741 - this is a project where market cap and volume depth are at the very low end of the spectrum.
Free vs. Paid vs. Algorithmic ANT Price Prediction Tools Compared
Three distinct prediction tool types exist for ANT, each suited to a different user profile:
None of these tools constitute financial advice. The most analytically rigorous option - CoinCodex's algorithmic model - still relies on pattern recognition from a very short price history (ANT launched in August 2026), which limits output reliability. Treat all forecasts as directional indicators, not price targets.

ANTTIME Red Flags & Risk Warnings: What Investors Should Know
ANTTIME has genuine potential as a novel T2E model with a clear ecosystem vision. It also carries specific risks that deserve honest treatment.
⚠ ANT Risk Checklist - Know These Before Investing
- Ultra-thin liquidity: $9K-$14K daily volume means high slippage and manipulation risk on larger positions
- KYC-gated token migration: ANT → TIME Coin swap requires KYC verification - non-compliant holders face uncertain outcomes
- Token emission pressure: Ongoing T2E mining continuously creates new tokens; demand must outpace supply growth to support price
- Contract address scams: Always verify the official ANT BEP-20 contract address - impersonation tokens exist on BSC
- Whale concentration risk: Team and early-miner wallet holdings are not publicly disclosed; concentrated selling could suppress price
- Regulatory risk: GameFi and SocialFi token models face evolving regulatory frameworks in multiple jurisdictions
The KYC migration requirement is worth specific attention. When ANTTIME transitions from BEP-20 ANT to native TIME Coin on the TIME Chain mainnet, only KYC-verified holders qualify for the swap. The project hasn't clearly communicated what happens to ANT tokens held by unverified wallets post-migration - a meaningful risk for holders who acquired ANT through DEX routes without completing identity verification.
T2E model sustainability is also an open question. According to ANTTIME's whitepaper, 91% of TIME Coin supply (10 billion out of 11 billion) is allocated for ecosystem mining rewards. The inflationary pressure from ongoing mining needs to be offset by genuine ecosystem demand growth to sustain the token price. Conduct your own research (DYOR) before committing capital.
ANTTIME Investment Strategies: Maximizing Value from ANT
Understanding the forecasts matters less than knowing how to act on them responsibly. Four approaches are worth examining for ANT specifically:
Popular Trading Strategies for ANT
Swing Trading aligns best with ANT's actual price behavior. With volatility regularly exceeding 10% in a week, entries at Fibonacci support zones (particularly the $0.000150-$0.000160 area) combined with RSI readings below 40 create the stronger setups. Target resistance levels around $0.000294-$0.000344.
Trend Following is viable during confirmed macro bull phases. As covered in the technical analysis section above, the MACD provides the clearest signal - a confirmed crossover above zero, combined with the 50-day SMA pointing upward, creates a higher-conviction entry aligned with CoinCodex's bullish 2027 scenario. For a parallel approach on how to apply trend-following analysis across altcoin cycles, see our EOS price prediction for a comparable mid-cap case study.
Day Trading ANT is not recommended. With only $9,000-$14,000 in daily volume, bid-ask spreads are wide, order execution at intended prices is unreliable, and even modest position sizes can move the market against you.
HODL is the simplest strategy for a speculative micro-cap position - but requires the clearest-eyed risk acceptance. The thesis: TIME Chain mainnet launches, ANTSWAP grows into a liquid DEX, RWA integration creates real-world demand, and CEX listings for TIME Coin follow. Treat any HODL position in ANT as capital you could afford to lose entirely.
### Risk Management Essentials for ANT Investors📋 Risk Management Checklist for ANT
- Position sizing: Limit ANT to 1-5% of total crypto portfolio - never a core holding
- Stop-loss placement: Set stop levels below the $0.000150 Fibonacci support zone; use MEXC's stop-loss order feature
- Diversification: Hold ANT alongside larger-cap assets; don't concentrate speculative exposure in one micro-cap
- KYC completion: Complete identity verification now if planning to hold through the TIME Coin migration
- DYOR mandate: Re-evaluate your thesis at each major roadmap milestone - don't set and forget
Stop-loss discipline matters more for ANT than for larger tokens precisely because the liquidity is thin. Set stop-loss orders on MEXC rather than relying on manual monitoring for any active position. Portfolio diversification isn't a generic disclaimer here - it's a practical necessity given ANT's negligible market cap.
ANTTIME Alternatives: Similar Tokens Worth Considering
No single T2E project has established itself as the dominant player in the category. If ANTTIME's specific model doesn't align with your risk tolerance or investment thesis, these comparable projects offer different profiles:
Note: Market cap and volume figures are approximate and change rapidly. Verify current data on CoinMarketCap before making comparisons.
The contrast between ANTTIME and these alternatives is largely a risk/return trade-off. STEPN, Notcoin, and Pi Network have significantly higher liquidity, broader exchange coverage, and more established track records - but at correspondingly lower speculative upside potential given their larger existing market caps.
Conclusion: Is ANT Worth Watching in 2026?
ANTTIME occupies a genuinely interesting position in the crypto ecosystem. The Time-to-Earn model is conceptually differentiated - time as a universal asset is a compelling framing - and the roadmap toward TIME Chain mainnet, DeFi integration, and RWA utility is more substantive than many comparable micro-cap projects present.
The token's price reality, however, is that it's currently a high-risk, thinly-traded micro-cap asset that lost 99%+ from its ATH and is in an early rebuilding phase. Whether the ant price prediction models pointing toward $0.000344 by end-2026 or $0.001082 by 2030 prove accurate depends on execution factors that are unknowable today.
The platforms shaping the next phase of on-chain finance share a common trait with what ANTTIME is attempting to build: verifiable mechanics, user-controlled assets, and yield that comes from real economic activity rather than inflationary token printing. Whether ANTTIME's execution over the next 24 months backs its stated vision is the only question that ultimately matters for the ANT price.
For current price data, check ANT/USDT on MEXC. For the full project roadmap and tokenomics, read the official ANTTIME whitepaper. Conduct your own research before committing capital.
Crypto trading and investment carries substantial risk of loss. This article is for informational purposes only and does not constitute financial advice. Past price movements and forecast models are not reliable indicators of future performance.
Last updated: April 2026.
Frequently Asked Questions
What is the ANT price prediction for 2026?
Based on CoinCodex's algorithmic model, ANTTIME (ANT) is projected to trade between approximately $0.000206 and $0.000344 in 2026, with an average around $0.000234. The more conservative MEXC 5% growth model places ANT in the $0.000158-$0.000174 range. Technical indicators currently show 15 bullish vs. 4 bearish signals, with the RSI at approximately 57 (neutral). These figures should be treated as directional probabilities. The actual outcome depends heavily on Bitcoin's market cycle, ANTTIME's roadmap execution, and broader crypto market conditions - all forecasts carry substantial uncertainty.
What is ANTTIME (ANT) token?
ANTTIME (ANT) is the native BEP-20 utility token of the ANTTIME ecosystem - a Web3 project that blends Game-Fi and Social-Fi into a Time-to-Earn (T2E) model. The token functions as the central currency connecting the ANTTIME mobile app, the ANTTAVERSE metaverse layer, ANTSWAP (the native DEX), and future DeFi and RWA integrations on the TIME Blockchain. ANT was listed on MEXC and PancakeSwap following its Token Generation Event on August 7, 2026. It will eventually migrate to TIME Coin - the native asset of the TIME Chain mainnet - for KYC-verified holders.
What is the ANT price prediction for 2030?
CoinCodex models ANT reaching approximately $0.001082 in October 2030 under a bull scenario, with a base case around $0.000702 and a conservative scenario of $0.000192. The bull case assumes TIME Chain mainnet delivery, ANTSWAP growing into a liquid DEX, a cross-chain bridge enabling broader DeFi participation, RWA integration creating real-world demand, and new CEX listings for TIME Coin. The bear case assumes competition from established T2E projects, sustained token emission pressure, and weak roadmap execution. The wide 2030 range reflects genuine uncertainty for a five-year forecast on a sub-$1M market cap project.
What risks should I know before investing in ANTTIME?
The primary risks for ANTTIME are: ultra-thin liquidity ($9K-$14K daily volume makes large trades difficult without slippage), the KYC-gated token migration (non-verified holders face uncertain outcomes when ANT transitions to TIME Coin), continuous token emission from mining activity creating sell pressure, smart contract exposure on BEP-20 (always verify the official contract address), unknown whale and team wallet concentration, and regulatory risk for GameFi/SocialFi tokens in major jurisdictions. Beyond project-specific risks, ANT's extreme micro-cap status means it can move 20-50% in either direction on low volume events. Only allocate capital you're fully prepared to lose.
How does the ANTTIME Time-to-Earn model work?
Users download the ANTTIME mobile app and tap once per hour to "mine" TIME Coins. The mining rate increases proportionally with the number of active referrals a user has brought into the platform. No upfront capital investment is required - your time is the input, tokens are the output. Earned tokens can be held, traded on MEXC or PancakeSwap, or used within the ANTTIME ecosystem. The referral mechanic also creates a built-in growth incentive: more users in your network means faster token accumulation for all participants, creating organic demand pressure that standard price models don't fully capture.
What is the 50-day SMA for ANTTIME and what does it mean?
The 50-day Simple Moving Average (SMA) for ANTTIME is approximately $0.000294. The 50-day SMA is calculated by averaging the closing prices over the past 50 trading days and is one of the most widely monitored trend indicators in crypto markets. When price trades above the 50-day SMA, that's generally considered a bullish signal; trading below it suggests bearish momentum. ANT is currently trading close to this level, indicating sideways consolidation around the medium-term average. A sustained break and close above $0.000294 would typically be interpreted as a positive momentum shift for the short-term outlook.
Where can I buy ANTTIME (ANT)?
ANTTIME (ANT) is available on MEXC (ANT/USDT spot pair), PancakeSwap (DEX - requires BNB for gas), and ANTSWAP (ANTTIME's own native DEX, launched August 2026). On MEXC, the process involves account creation, KYC verification, depositing USDT, and executing a spot trade. On PancakeSwap or ANTSWAP, you connect a BEP-20 wallet, bridge in BNB or USDT, and swap for ANT. Always verify the official ANT contract address from ANTTIME's official website or MEXC's token page before transacting - impersonation tokens exist on BSC.
