
DigiByte has always been the blockchain that serious on-chain participants keep in the back of their minds. While it doesn't dominate headlines the way Bitcoin or Ethereum do, DGB's technical architecture is genuinely impressive - and its current price, sitting more than 97% below its 2021 all-time high of $0.1825, makes every DGB price prediction worth examining carefully.
This guide breaks down the short-term and long-term forecast for DigiByte, covers the technical indicators shaping near-term price action, and honestly assesses whether DGB is worth a position in a crypto portfolio right now.
⚡ Key Takeaways
- DGB is currently trading well below its May 2021 all-time high of $0.1825, offering a speculative asymmetric setup for risk-tolerant traders
- Year-by-year price forecasts from multiple analyst aggregators project gradual upside through 2030, with significant variance between bull and bear scenarios
- DigiByte's five-algorithm proof-of-work system remains one of the most unique security models in crypto - and the DigiDollar stablecoin whitepaper adds a new utility catalyst to watch
- As with any micro-cap altcoin, thin trading volume and high volatility mean position sizing and risk management are non-negotiable
DigiByte (DGB) Overview: Key Stats and Market Data
Before diving into forecasts, a quick snapshot of where DigiByte stands right now puts the numbers in context.
That gap between the current price and the ATH is the single most important context for any DGB price discussion. According to CoinMarketCap, the all-time high of $0.1825 was reached on May 1, 2021 - meaning the current price sits approximately 97% below that peak. Recovering even a fraction of that distance would represent multiple hundreds of percent in returns, which is precisely why DigiByte attracts the attention it does despite being a relatively quiet corner of the crypto market.
Current sentiment reads bearish. The Fear & Greed Index sits in Extreme Fear territory, which historically has preceded recovery phases - though "historically" in crypto means a sample size of a few cycles, so treat that pattern as a data point, not a certainty.

What Is DigiByte? The Technology Behind DGB
DigiByte launched in January 2014 as a fork of Bitcoin, developed by Jared Tate with a specific focus on making transactions faster, more secure, and more decentralized than its parent chain. A decade later, the project has seen sustained community development under the DigiByte Foundation and remains one of the longest-running proof-of-work blockchains in existence.
The architecture is three-layered: a public ledger for transparent record-keeping, a smart contract and application layer for protocol-level functionality, and a core protocol that handles consensus and security. That core protocol is where DigiByte genuinely differentiates itself from legacy PoW chains.
5 things that make DigiByte technically distinct:
- Five simultaneous mining algorithms (Sha256, Scrypt, Skein, Qubit, Odocrypt)
- 15-second block times - blocks confirm roughly 40x faster than Bitcoin
- 1.5-minute average transaction finality
- DigiShield difficulty adjustment - real-time across all five algorithms
- Maximum supply of 21 billion DGB
DigiByte's Multi-Algorithm Proof-of-Work Security Model
The five-algorithm mining system is the architecture detail that most analysts underweight when evaluating DGB. Each algorithm - Sha256, Scrypt, Skein, Qubit, and Odocrypt - operates independently. A successful 51% attack on DigiByte would require an attacker to simultaneously dominate the hash rate on all five, which is astronomically more expensive and complex than attacking a single-algorithm chain.
DigiShield works alongside this by adjusting mining difficulty for each algorithm independently in real time. When a large mining pool exits one algorithm, DigiShield prevents the remaining blocks from being mined abnormally fast or slow - the kind of instability that has caused other chains to stall after miner exodus events. From an investor's perspective, this translates to network reliability: a chain that doesn't fall apart under variable mining conditions is a chain that functions as a reliable asset. You can read more about how proof-of-work mining works and why the halving cycle matters for PoW-based assets.
DigiDollar and Recent DigiByte Developments
The most significant recent development in the DigiByte ecosystem is the official whitepaper release for DigiDollar - a proposed decentralized USD-pegged stablecoin built entirely on DigiByte's base layer.
The mechanism is straightforward: users lock DGB tokens as collateral, mint DigiDollar stablecoins pegged to USD, and can redeem them without any third-party intermediary. No custodian, no bridge risk, no centralized oracle dependency. The system leverages DigiByte's 15-second block times for near-instant stablecoin transactions and its five-algorithm security model for trustless collateral management.
📊 Why DigiDollar Matters for DGB Price
If DigiDollar gains adoption, DGB tokens get locked as collateral - directly reducing circulating supply. Reduced supply combined with increased utility demand is a straightforward demand-side catalyst. This is whitepaper-stage as of April 2026, so weight it as a potential catalyst rather than a confirmed fundamental shift. Understanding how decentralized finance protocols work helps contextualize why a trustless stablecoin built on a PoW chain is architecturally significant.
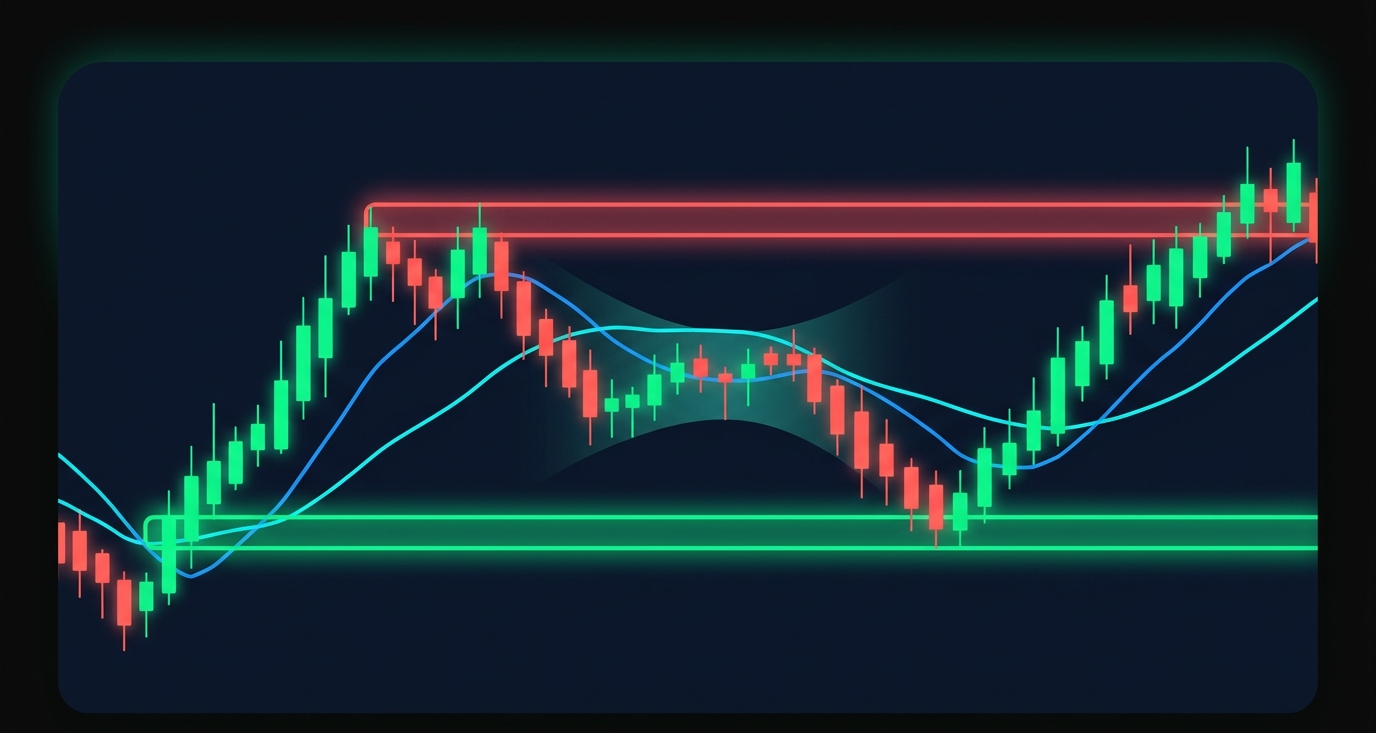
DigiByte (DGB) Technical Analysis: Indicators and Market Signals
The current technical picture for DGB is mixed. Short-term timeframes show some consolidation after a bearish run, while longer-term charts remain under pressure from declining moving averages. Understanding how Bitcoin market cycles work helps contextualize where DGB sits within the broader macro structure.
Moving Averages - Short-Term and Long-Term Trend Analysis
The relationship between the 50-day and 200-day Simple Moving Averages tells the clearest trend story for DGB. A death cross - when the 50-day MA crosses below the 200-day - signals a sustained downtrend, and DGB has been in that configuration since mid-to-late 2025. The 200-day MA has been declining since September 2025 on the weekly chart, confirming long-term trend weakness.
For a bullish reversal signal to emerge, traders will want to see the 50-day SMA begin rising and ultimately cross back above the 200-day - a golden cross event. Based on current price structure, that's not imminent on the daily chart. However, the four-hour chart shows the 50-day MA beginning to rise, suggesting early-stage short-term momentum building below the surface.
Practically: the daily and weekly MAs are acting as resistance overhead, not support below. Any rally toward the 200-day SMA (~$0.0090-$0.0095 zone) would represent a significant technical event and a likely supply zone for swing traders.
RSI and MACD - Momentum and Divergence Signals
The 14-period RSI has spent extended time near or below 30 - the traditionally oversold zone - without producing a sustained bounce. RSI sitting persistently below 40 despite no aggressive new lows suggests sellers are dominant but aren't accelerating the decline. A move above 40 on the RSI would be the first signal of genuine momentum shift worth monitoring.
The MACD tells a similar story. With the MACD line below the signal line and the histogram showing negative (though slightly contracting) values, downside momentum remains the primary thesis. A bullish MACD crossover - the line crossing above the signal line - would be the most reliable short-term buy signal for DGB in the current environment.
Bollinger Bands have compressed meaningfully, indicating a volatility squeeze. Historically, extended low-volatility compression periods in DGB have preceded sharp directional moves. Direction isn't confirmed by compression alone - but it means a significant price move in either direction may be approaching.
DigiByte (DGB) Price Prediction 2026-2030: Year-by-Year Forecast
This is the core of what most DGB investors want to know. Below are aggregated forecasts drawn from multiple analyst sources alongside macro-cycle context for each year. Understanding the Bitcoin halving cycle and its downstream effects on altcoins is essential context before interpreting these numbers.
All predictions are speculative estimates aggregated from analyst sources including Cryptopolitan and Changelly. They do not constitute financial advice. Crypto trading involves substantial risk of loss.
DGB Price Prediction 2026
2026 is the first year where the 2024 Bitcoin halving cycle effects start materializing across altcoins. Historically, Bitcoin's halving-driven bull runs have preceded altcoin appreciation by 12-18 months - placing the peak altcoin cycle somewhere in the 2025-2026 window under historical patterns.
For DGB to reach the upper end of 2026 forecasts (~$0.0228), it would need to break the major resistance zone around $0.0083 and sustain a move through the prior consolidation range. The DigiDollar development timeline could act as a catalyst, particularly if the stablecoin moves from whitepaper to testnet during this period. Bearish scenario: if Bitcoin stalls and the broader market remains in contraction, DGB could remain range-bound between $0.0042 and $0.0072.
DGB Price Prediction 2027 and 2028
By 2027-2028, the crypto market macro cycle typically favors altcoins. If Bitcoin reaches new ATHs during this window - consistent with historical four-year cycle timing - altcoin season tends to produce disproportionate gains in lower-cap assets with strong communities.
DGB's position in this scenario is interesting: a 10+ year proof-of-work chain with active development, a pending stablecoin product, and a price point well below ATH. The 2028 maximum forecast from Cryptopolitan (~$0.0475) would represent roughly a 10. return from current prices - plausible in a favorable macro cycle, but far from certain given liquidity constraints and competition from larger ecosystems.
DGB Price Prediction 2029 and 2030
2030 is the most-searched long-horizon DGB forecast, and the market cap math is worth understanding concretely.
Reaching $0.10 by 2030 would require DigiByte to grow its market cap roughly 20-21. from current levels. In a mature crypto bull market with real DigiDollar utility and sustained community development, that's within the realm of possibility - not probability. For the full picture on how DeFi protocols and token economics drive these market cap dynamics, it's worth understanding how collateral-backed stablecoin systems work.
Can DigiByte Reach Its All-Time High Again? Historical Price Analysis
Understanding where DGB has been is the best anchor for evaluating where it might go. According to CoinMarketCap's historical data, the full price history tells a story of cyclical volatility that's typical - but extreme - even by crypto standards.
DGB PRICE HISTORY - KEY MILESTONES
2014 - Launch
Genesis block mined January 2014 as Bitcoin fork. Price near zero, minimal market interest. DigiByte had no ICO and no premine beyond a 0.5% development allocation.
2017-2018 - First Bull Run
DGB reached ~$0.13 in January 2018 with a $1.2B total market capitalization. The Paytomat payment platform added DGB support, driving early adoption momentum.
2020 - Bear Market Low
Price declined to ~$0.004 during the extended bear cycle - the same price range we see today. Network development continued throughout without interruption.
May 2021 - All-Time High: $0.1825
DGB peaked at $0.1825 on May 1, 2021 during the DeFi boom. Market cap reached ~$3.5-4B at peak. This remains the reference point for all current price prediction models.
2021-2023 - Post-ATH Decline
Extended 95%+ decline followed the ATH. Price consolidated in the $0.007-$0.022 range through 2023 as broader crypto markets corrected.
2024 - Range Consolidation
Price stabilized around $0.006-$0.010. The Bitcoin halving in April 2024 reduced block rewards to 3.125 BTC, setting up the next macro cycle.
April 2026 - Current
DGB trades near ~$0.0047, approximately 97% below ATH. Bearish technical configuration with oversold RSI and Extreme Fear sentiment - conditions that have historically preceded recovery phases.
Returning to $0.1825 from the current ~$0.0047 level would require approximately a 38. increase. That's not categorically impossible - it happened once before - but it would require a combination of a generational crypto bull market, DigiDollar adoption, and no catastrophic competition from larger Layer 1 ecosystems. Most analyst models don't put DGB back at ATH levels within the 2026-2030 window.
The honest answer to "can DGB reach its ATH again?" is: not soon, and not without exceptional macro conditions. But the path from $0.0047 to $0.04-$0.05 is far more defensible, and that alone would represent significant returns for early accumulators.
Is DigiByte (DGB) a Good Investment? Risk and Opportunity Assessment
Let's be direct about this, because vague answers serve no one.
✓ INVESTMENT PROS
- 10+ year blockchain - not a new project with unproven tech
- Five-algorithm PoW - among the most attack-resistant designs
- Active community and ongoing DigiByte Foundation development
- DigiDollar stablecoin as a potential new utility catalyst
- 15-second block times offer real transaction utility
- 95%+ ATH discount creates asymmetric upside in a bull cycle
✕ INVESTMENT CONS
- Very low daily trading volume (~$1.5-2M) - significant slippage risk on larger orders
- Limited exchange listings vs. top-tier assets
- DigiDollar is whitepaper-stage - no guarantee of deployment
- Competition from Ethereum, Solana, and other L1s is intense
- Large circulating supply (~21B DGB) creates structural price headwinds
- Sustained downtrend with no confirmed reversal catalyst yet
DGB isn't a broken project. It's a technically credible, community-sustained blockchain that happens to be small and illiquid in a market dominated by ecosystems 100. its size. For a crypto-native investor comfortable with high volatility and micro-cap risk, a small speculative allocation in DGB is defensible as a bet on the halving cycle and DigiDollar development.
Crypto trading and investing involves substantial risk of loss. The above is not financial advice. Always conduct your own research and consult a qualified advisor before making investment decisions.
DigiByte vs Competitors: Litecoin, Dash, and Ravencoin Compared
DGB wins on raw speed and security architecture. Litecoin wins on liquidity and exchange coverage by a massive margin - which matters when you're trying to enter or exit a position. The practical conclusion: DGB is technically superior to most PoW peers on security design, but that technical advantage hasn't translated into market cap leadership, and the liquidity differential is real.
How to Buy DigiByte (DGB): Step-by-Step Guide for Beginners
If the DGB price forecast has your attention, here's how to acquire it without overcomplicating the process.
- Choose an exchange that lists DGB - DigiByte is available on Binance, MEXC, Changelly, and Kraken. Search for the DGB/USDT or DGB/BTC trading pair to confirm availability before creating an account.
- Create and verify your account (KYC) - Most regulated exchanges require identity verification. Have a government-issued ID ready. Verification typically takes 10-30 minutes on well-established platforms.
- Deposit funds - Deposit USDT, BTC, or supported fiat currency. USDT is usually the most direct route to a DGB trading pair.
- Locate the DGB trading pair - Search "DGB" in the exchange's market search. Select DGB/USDT for the most liquid pairing available.
- Place your order - A market order fills immediately at the current price but may experience slippage given DGB's thin liquidity. A limit order lets you set your target entry price - generally the smarter approach for a low-liquidity asset like DGB.
- Transfer to a personal wallet - Leaving DGB on a centralized exchange exposes you to counterparty risk. The DigiByte Core wallet provides full self-custody. Hardware wallets (Ledger, Trezor) with DGB support offer the most secure option for larger positions.
DigiByte Trading Strategies and Risk Management
Having a price target means nothing without a framework for actually managing the trade. DGB's volatility profile demands clear strategy.
Four approaches to DGB exposure:
- HODLing - Accumulate DGB with a multi-year thesis (2027-2030 cycle peak) and hold through volatility. Low time commitment. Requires high tolerance for 30-50% drawdowns without panic selling.
- Dollar-Cost Averaging (DCA) - Purchase a fixed USD amount of DGB at regular intervals regardless of price. Removes timing pressure, automatically buys more during dips. Particularly well-suited to DGB given its historical volatility.
- Swing Trading - Enter on oversold RSI signals (below 30) combined with MACD bullish crossover confirmation. Exit at identified resistance levels.
- Day Trading / Scalping - Significantly hampered by DGB's low daily volume. Large orders move the market. Not recommended for most traders.
Popular Trading Strategies for DGB Investors
Risk Management: Stop-Loss, Position Sizing, and Exit Planning
Position sizing: Given DGB's liquidity profile, most risk-conscious traders limit micro-cap altcoin positions to 1-5% of their total crypto portfolio. A 50% loss on a 3% allocation is painful but survivable. Exit planning: Scaling out in tranches at resistance levels is more effective than all-at-once exits for illiquid assets - ladder sells between $0.0072, $0.012, and $0.020 to capture upside while avoiding self-inflicted slippage.
Crypto trading involves substantial risk of loss. Stop-loss orders do not guarantee execution at specified levels in fast-moving or illiquid markets.
DigiByte Price Prediction 2035 and 2040: Ultra-Long-Term Outlook
⚠ Ultra-Long-Term Prediction Disclaimer
- Forecasts beyond 5 years in crypto → speculative extrapolations based on trend modeling, not verified analysis
- No model reliably predicts 10-15 year crypto prices → treat these as scenario illustrations only
Bull case (2035-2040): DigiByte achieves meaningful adoption as a secure settlement layer. DigiDollar gains traction as a decentralized stablecoin used within the broader DeFi ecosystem, creating sustained DGB collateral demand. Multiple Bitcoin halving cycles have elevated the macro market floor. Bear case: Larger smart contract ecosystems with deeper developer activity continue to dominate capital allocation, leaving PoW-focused chains like DGB in a relative value trap.
Conclusion: Is DigiByte Worth Watching in 2026 and Beyond?
After breaking down the fundamentals, technical signals, and analyst forecasts, here's the direct summary.
DigiByte is a technically credible, community-sustained blockchain with genuine differentiators - its five-algorithm PoW security, 15-second block times, and the emerging DigiDollar stablecoin development. The current price represents a deep discount from its 2021 ATH, and the macro setup (post-halving altcoin cycle, oversold RSI, compressed Bollinger Bands) creates the conditions for a meaningful recovery move.
The risks are real: thin liquidity makes large entries and exits difficult, competition from better-capitalized ecosystems is intense, and DGB has been in a sustained downtrend without a confirmed fundamental breakout catalyst - until potentially now, with DigiDollar.
For traders who value on-chain verifiability and true self-custody - principles that are increasingly central to how serious DeFi participants operate - DigiByte's architectural philosophy aligns well with where the broader industry is heading. Platforms built on trustless, transparent mechanics are the foundation the next cycle of crypto adoption is being built upon. Whether DGB is part of that story in a significant way is still being written. Platforms like Zipmex that are built on the same principles of self-custody and on-chain verifiability reflect that directional trend.
Crypto trading and investing involves substantial risk of loss. Price predictions are speculative and based on analyst estimates - they do not guarantee future results. This article is for informational purposes only and does not constitute financial advice. Always conduct thorough research before making investment decisions.
Last updated: April 2026.
Frequently Asked Questions
What is the current DGB price?
As of April 2026, DigiByte (DGB) trades at approximately $0.0047, according to CoinMarketCap, reflecting a sustained bearish period following the 2021 all-time high of $0.1825. The current price sits more than 97% below that ATH peak. Daily trading volume runs roughly $1.5-2 million, which is thin relative to larger-cap assets and means price can move meaningfully on modest order flow. Check a live price aggregator for the most current figures, as DGB can fluctuate several percent within a single session.
What is the DGB price prediction for 2026?
DGB price forecasts for 2026 range from a minimum of around $0.0067 to a maximum of approximately $0.0228, depending on the source and macro assumptions. Cryptopolitan places the 2026 maximum at $0.0228, while Changelly models a more conservative upper range near $0.0072. The average consensus sits near $0.0095. The upper end of that range would require a broad altcoin rally following Bitcoin's 2024 halving cycle plus meaningful progress on DigiDollar stablecoin development. These are speculative estimates and do not constitute financial advice.
What is the DGB price prediction for 2030?
Most analyst models put DGB's 2030 price between $0.028 and $0.048, with average forecasts around $0.040. Reaching $0.05 would require DigiByte's market cap to reach approximately $1 billion - a realistic milestone for a decade-old, actively developed blockchain in a favorable macro environment. Reaching $0.10 would require roughly $2.1 billion in market cap, comparable to where smaller legacy PoW chains have traded at cycle peaks. The 2030 outlook depends heavily on DigiDollar adoption progress and broader crypto market growth. All price predictions are speculative.
Is DigiByte a good investment in 2026?
Whether DGB suits your portfolio depends on your risk profile. The case for DGB in 2026: it's a technically credible, decade-old blockchain trading well below its historical peak, with a potential new catalyst in DigiDollar and a favorable macro setup from the 2024 Bitcoin halving cycle. The case against: thin liquidity, intense competition from larger ecosystems, and a sustained downtrend requiring confirmation of reversal. For risk-tolerant, crypto-native investors with a 2-3 year horizon, a small speculative position is defensible. This is not financial advice - always assess your own risk tolerance and financial situation before investing.
Can DigiByte reach $1?
Reaching $1 per DGB would place DigiByte's total market cap at approximately $21 billion - a figure comparable to Litecoin's historical peak market cap. While it's not theoretically impossible in the very long term, no credible analyst model puts DGB at $1 within the 2026-2030 window. The math requires extraordinary market conditions: a generational crypto bull run, widespread DigiDollar adoption driving sustained DGB demand, and significant market share gains relative to larger ecosystems. Treating $1 as a realistic near-term target would be misaligning expectations with current market fundamentals.
What technical indicators are used to predict DGB price?
The primary technical indicators applied to DGB price analysis are the Relative Strength Index (RSI), Moving Average Convergence Divergence (MACD), Simple Moving Averages (50-day and 200-day SMA), Bollinger Bands, and volume analysis. RSI identifies overbought and oversold conditions - DGB's RSI has been near or below 30 in recent weeks, signaling oversold territory. MACD crossovers signal momentum shifts. The 50/200-day MA relationship (currently a death cross configuration) indicates trend direction. These indicators are probability tools, not certainties.
How do I store DGB safely?
The most secure method for storing DGB is in a self-custody wallet where you control the private keys. The DigiByte Core wallet provides full-node self-custody. For hardware wallet storage, Ledger and Trezor both support DGB. Avoid leaving DGB on centralized exchanges for extended periods - exchange custody introduces counterparty risk that self-custody eliminates. DigiByte's network was designed around decentralization and user sovereignty from day one, making a personal wallet the philosophically aligned - and practically safer - storage choice for any meaningful position size.
