
ENJ is trading at roughly $0.019-$0.021 as of March 2026 - and if you're trying to figure out where it goes from here, you're asking the right question at the right time. Enjin Coin sits at a fascinating crossroads between gaming infrastructure and speculative crypto, which means its price trajectory depends on forces that go well beyond typical market cycles.
This guide covers everything you need to make an informed read on ENJ: short-term technical signals, year-by-year forecasts through 2030, the fundamental drivers that will actually determine the outcome, and a clear-eyed look at what could go right or wrong.
⚡ Key Takeaways
- ENJ is trading significantly below its 200-day SMA (~$0.042) - a historically bearish structural signal
- 2026 year-end models range widely: from $0.015 (bearish algorithmic) to $0.025 (linear growth scenarios)
- By 2030, forecasts diverge sharply - bear case near $0.003, bull case potentially above $0.10 if gaming NFT adoption accelerates
- The minting/melting mechanic creates real deflationary pressure on ENJ supply - something most generic price predictions ignore
- High volatility and low liquidity relative to top-10 assets make ENJ's price highly susceptible to broad market swings
What Is Enjin Coin (ENJ)? A Quick Primer
Enjin Coin isn't just another gaming token with a catchy ticker. It's the reserve currency backing a specific ecosystem where NFT assets have verifiable, redeemable value. That's a meaningful distinction - and it's central to any honest price analysis.
Founded by Enjin Network, ENJ operates on Ethereum (ERC-20) with a broader ecosystem strategy that has included development toward Polkadot-based infrastructure via Efinity. Developers building on the Enjin platform lock ENJ tokens into NFTs during the creation process, which pulls that ENJ out of circulating supply. Players who want to liquidate those NFTs can "melt" them back down to recover the underlying ENJ. The ecosystem creates a real, on-chain linkage between gaming adoption and token demand.
Understanding ENJ's utility is essential context for evaluating whether current price levels reflect the project's real-world adoption - or just speculative sentiment.
How ENJ Token Works - The Minting and Melting Mechanic
The minting/melting mechanic is the single most important thing to understand about ENJ's supply dynamics, and most price prediction articles skip right past it.
When a developer creates an NFT on the Enjin platform, they mint it by locking a chosen amount of ENJ inside the token. That ENJ is removed from circulating supply for as long as the NFT exists. A game that mints 1 million in-game swords with 0.01 ENJ each effectively removes 10,000 ENJ from the market. Players who want to liquidate those items melt the NFT, recovering the underlying ENJ and burning the game item in the process.
This creates a natural demand floor during adoption phases - but also means that declining game activity can release suppressed supply back into the market. When evaluating any ENJ price prediction, adoption rates in Enjin-integrated games matter as much as macro crypto conditions.

ENJ Price Prediction 2026 - Short-Term Outlook
The ENJ price prediction for 2026 ranges from moderately bearish to neutrally optimistic depending on which model you trust - and the spread is wide enough that you should understand the methodology behind each number before acting on it.
Algorithmic models built on historical price trend extrapolation project ENJ declining through most of 2026, with a year-end target in the $0.015-$0.017 range - roughly a 15-20% drop from current levels. Models using simpler linear growth assumptions project modest appreciation to $0.022-$0.025 by December 2026 at a 5% annual growth input.
The technical picture currently leans bearish-to-neutral. ENJ is trading well below its 200-day SMA, sentiment is firmly in Extreme Fear territory, and only about 37% of trading days in recent months have closed green. That's not a bull market signal.
These are model-derived estimates, not financial advice. Actual prices will depend on macro conditions, Bitcoin's market cycle, and Enjin ecosystem developments.
For investors with a longer time horizon, the picture shifts - here's what models suggest beyond 2026.
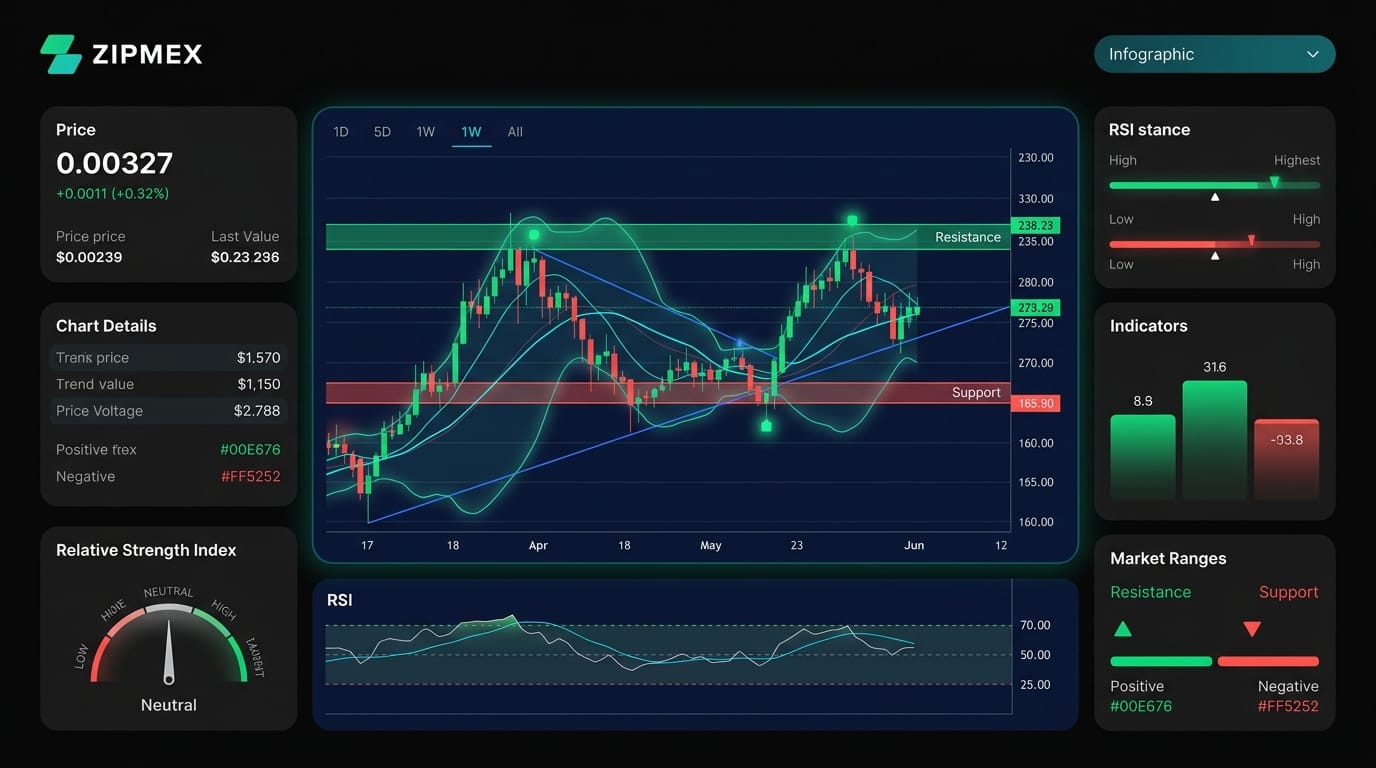
ENJ Technical Analysis - Key Indicators for 2026
Technical signals for ENJ in early 2026 paint a mixed but predominantly cautious picture. The RSI(14) is hovering in the 36-51 range - recent readings near 36 indicate neutral-to-oversold conditions without triggering a confirmed reversal signal. An RSI below 40 typically signals weak momentum; above 60, a stronger upward bias. ENJ sits in the gray zone, which means the chart isn't screaming buy or sell - it's asking you to wait for confirmation.
The MACD is the signal worth watching most closely right now. A confirmed MACD crossover above the signal line would be the first credible momentum shift toward recovery. Until that happens, rallies toward the $0.022-$0.024 range (50-day SMA zone) are likely to face selling pressure.
Bollinger Bands are compressing, which historically precedes a volatility expansion. Whether that expansion resolves upward or downward depends heavily on Bitcoin's next directional move - ENJ, as a small-cap gaming token, amplifies BTC's moves significantly.
For active traders: R1 at $0.02163 is the immediate resistance to watch on any bounce. A clean close above R2 at $0.02222 would signal short-term momentum recovery.
ENJ Price Prediction 2027-2030 - Long-Term Forecast
Long-range ENJ price prediction models diverge so dramatically that understanding why they disagree is as important as the numbers themselves.
Algorithmic models that extrapolate historical price trends forward project ENJ continuing to decline through the late 2020s - reaching approximately $0.003 by December 2030, a decline of ~84% from current levels. Calculator-based tools that apply a user-input annual growth rate project ENJ at $0.025-$0.026 by 2030. That's a factor-of-8 difference between models. One extrapolates past weakness forward; the other assumes steady growth regardless of market conditions.
Neither is definitively correct. The truth will depend on whether Enjin's gaming ecosystem sees real adoption in the next three to four years.
These ranges synthesize algorithmic models and fundamental scenarios. They are illustrative, not predictive.
Bitcoin's halving cycle matters enormously here. Historically, small-cap altcoins like ENJ have seen 3-5x amplification of BTC's bull market moves - and similar amplification of drawdowns during bear phases. If the post-2025 halving cycle triggers a bull cycle peak in late 2025 or early 2026, ENJ may have already seen its best near-term opportunity. If the cycle extends, there could be a second wave of altcoin strength before 2027.
ENJ Bull Case vs. Bear Case - What Could Change Everything
Framing ENJ's future in binary optimism or pessimism misses the point. The real question is: which specific conditions would have to materialize for each scenario to play out?
✓ BULL CASE CATALYSTS
Major game studio integrations drive millions of active players into Enjin NFTs. Efinity/Polkadot launch succeeds and attracts new developer activity. Post-halving BTC bull run extends into 2026-2027, lifting all altcoins. Crypto gaming regulation provides clarity enabling institutional adoption. Target by 2030: $0.10-$0.20+
✕ BEAR CASE RISKS
NFT gaming interest continues to fade; casual market migrates to other ecosystems. Immutable X or Polygon dominates gaming NFT market; ENJ loses developer mindshare. BTC enters prolonged bear market; small-cap alts hit hardest. NFT/gaming token regulations create legal uncertainty. Target by 2030: $0.003-$0.005
The honest position: ENJ is a high-conviction bet on a specific niche recovering. That makes it higher risk than betting on general crypto market recovery.
What Drives the ENJ Price - Key Fundamental Factors
Price predictions without fundamental context are just numbers. These are the five actual levers that will determine whether any ENJ forecast comes true.
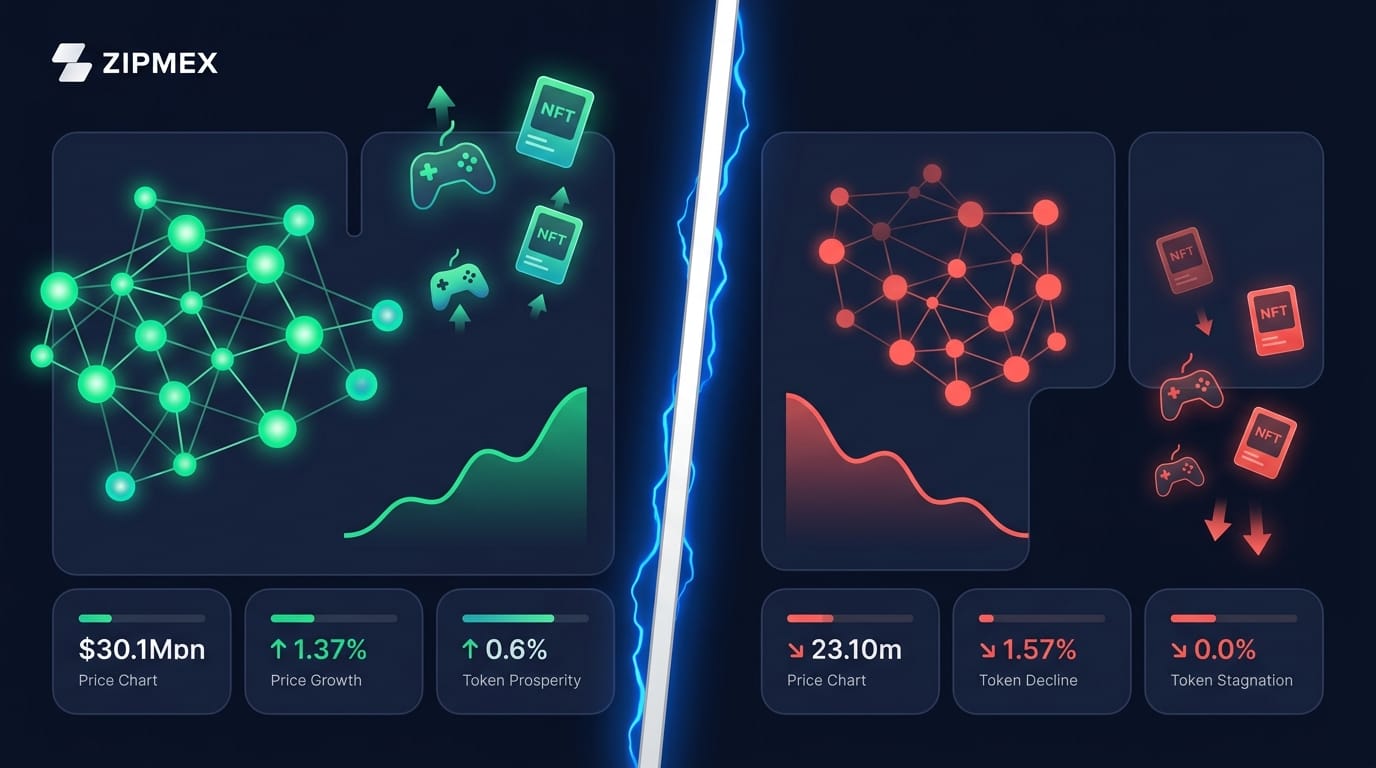
1. NFT Gaming Market Size and Trajectory
Gaming NFTs had their peak excitement in 2021-2022 and have seen sustained weakness since. ENJ's price directly reflects this: the token has dropped from its all-time high of over $4 (November 2021) to below $0.02 today - a 99%+ decline that tracks almost exactly with the NFT gaming market's collapse. Recovery in gaming NFT demand is the single largest bull catalyst available to ENJ.
2. Minting/Melting Supply Mechanics
Active game adoption reduces ENJ's circulating supply through the minting process. When popular games integrate Enjin and players accumulate item-backed NFTs, the deflationary effect is real. The inverse is also true: low gaming activity, few mints, and net supply returning to market through melting can create sustained sell pressure.
3. Bitcoin and Macro Crypto Sentiment
ENJ is a high-beta altcoin - it moves faster than BTC in both directions. During risk-on environments where BTC is trending upward, small-cap gaming tokens like ENJ tend to outperform significantly. During risk-off periods, they underperform. The Fear & Greed Index sitting at Extreme Fear in early 2026 reflects the broader market's caution, and ENJ will struggle to break out until that sentiment shifts.
4. Enjin Ecosystem Development Activity
On-chain and off-chain development metrics matter. Game launches built on Enjin, developer SDK adoption rates, GitHub commit frequency, and partnership announcements all feed into ENJ's real utility demand. A quiet development pipeline is a bear signal; accelerating adoption is a leading indicator of price recovery.
5. Competition from Other Gaming Blockchains
Enjin isn't the only infrastructure play in blockchain gaming. Immutable X offers zero gas fees for NFT gaming on Ethereum Layer 2. Ronin built a dedicated chain for Axie Infinity's ecosystem. Polygon has attracted major game studios with its EVM compatibility. If one of these competitors captures the developer mindshare Enjin needs, ENJ's growth thesis weakens.
ENJ is, ultimately, a high-beta altcoin. In a strong BTC bull market, it will likely outperform dramatically. In a prolonged bear, it will likely underperform just as dramatically. Understanding that before you size a position is more valuable than any price target.
How to Invest in ENJ - Getting Started
If you've done your analysis and want to take a position in ENJ, the process is straightforward - but worth covering step by step.
Step-by-Step: Buying ENJ
- Choose an exchange. ENJ is available on Binance (ENJ/USDT and ENJ/BTC pairs), MEXC (ENJ/USDT with solid liquidity), Coinbase (ENJ/USD), KuCoin, and Kraken. Compare fees before committing - spot trading fees typically range from 0.1% to 0.2% depending on the platform.
- Create and verify your account. Most major exchanges require KYC (identity verification) for full trading access. Complete this step before you're ready to trade - verification can take a few hours to a few days.
- Deposit funds. USDT is the most efficient deposit for ENJ trading since ENJ/USDT is the most liquid pair on most platforms. Bank transfers typically have lower fees than card purchases.
- Execute the trade. Use a limit order rather than market order for ENJ - as a lower-liquidity token, market orders can result in meaningful slippage. Set your limit at or slightly above the best ask if you want a fast fill.
- Transfer to a non-custodial wallet. For any holding you plan to keep longer than a few days, move ENJ off the exchange to a self-custodial wallet (MetaMask for ERC-20 ENJ, hardware wallet like Ledger for maximum security).
Given ENJ's volatility and the uncertainty in 2026 forecasts, dollar-cost averaging (DCA) is worth considering: instead of committing a full position at once, deploying equal amounts monthly removes timing risk and smooths your entry price over a volatile period.
⚠ Risk Disclaimer
- ENJ is a small-cap, high-volatility asset → only allocate capital you are prepared to lose entirely
- Crypto trading involves substantial risk of loss → past price performance is not indicative of future results
- This article is for informational purposes only → it should not be construed as financial advice
How to Evaluate ENJ Price Predictions - What to Look For
Not all ENJ price predictions are created equal. Knowing how to evaluate them is more valuable than knowing the numbers.
The most common mistake retail investors make is treating prediction tables as reliable forecasts rather than what they actually are: outputs of a model that makes specific assumptions about the future. Here's how to read them critically.
Technical analysis - RSI, MACD, and moving averages - is most useful for short-to-medium-term position management. Watching whether ENJ can reclaim its 50-day SMA ($0.022) tells you something about near-term momentum. Fundamental analysis - on-chain gaming activity, developer ecosystem metrics, competitive landscape - is what matters for multi-year convictions.
Three things to verify before trusting any ENJ price prediction:
- When was it last updated? A prediction from Q3 2025 doesn't reflect 2026 conditions.
- What methodology is disclosed? No methodology = no accountability.
- Does the forecast account for ENJ's specific tokenomics, or is it generic crypto price projection applied to ENJ's ticker?
Free vs. Paid vs. AI-Based Price Prediction Tools
TradingView is the de facto standard for technical ENJ analysis. Set up RSI(14), MACD, and Bollinger Bands on the ENJ/USDT daily chart and you'll have a significantly better read on momentum than any auto-generated prediction table.
Red Flags - When ENJ Predictions Are Not Trustworthy
The ENJ prediction space attracts a disproportionate amount of low-quality content. Knowing what to filter out protects you from acting on noise.
⚠ 5 Signs an ENJ Price Prediction Is Unreliable
- No methodology disclosed → if you can't find out how the forecast was generated, there's no basis for evaluating credibility
- Forecasts of 10x-100x returns without justification → ENJ reaching $1 requires a 50x gain; any prediction promising this without explaining conditions is not analysis
- Social media influencers promoting ENJ without disclosure → if the conviction comes with a referral link, treat the analysis accordingly
- Outdated predictions presented as current → a 2024 prediction recycled as a 2026 forecast is misleading even if the target looks similar
- No risk acknowledgment → any legitimate price analysis acknowledges the scenarios where it's wrong; a forecast with no downside isn't balanced
ENJ's relatively low market capitalization and liquidity compared to top-10 assets make it more susceptible to coordinated pump activity than Bitcoin or Ethereum. That doesn't mean every positive price move is manipulated - but it does mean your due diligence standards should be higher, not lower, for smaller-cap crypto tokens like ENJ.
ENJ vs. Alternatives - Other Gaming Crypto Tokens to Consider
ENJ isn't the only way to get exposure to blockchain gaming. Before committing capital, it's worth understanding the competitive landscape and where ENJ's specific value proposition stands.
Immutable X (IMX) is ENJ's most direct structural competitor. IMX offers zero gas fees for NFT transactions, has attracted partnerships with major gaming studios, and operates on Ethereum's security foundation via its Layer 2 rollup. ENJ's differentiation is its minting mechanic - game items backed by ENJ have provable, redeemable value that IMX items don't inherently share.
Investors taking a long position in gaming blockchain infrastructure might consider diversifying across multiple tokens rather than concentrating in ENJ alone, which reduces the specific execution risk tied to any one platform's adoption curve.
ENJ Price Prediction - Final Verdict and Investment Considerations
Pulling together everything covered in this analysis, here's where ENJ stands as of March 2026.
The ENJ price prediction for 2026 points to continued pressure in the near term: most algorithmic models suggest a year-end range of $0.015-$0.022, with the technical picture (trading below both the 50-day and 200-day SMAs, Extreme Fear sentiment, 37% green days) offering no clear reversal signal yet. Short-term bounces toward the $0.021-$0.024 range are possible, but they'd need to be confirmed by MACD crossover and sustained volume to mean anything structurally.
By 2030, the range of outcomes is genuinely wide. The bear case - driven by algorithmic trend extrapolation - puts ENJ near $0.003. The bull case, contingent on meaningful gaming NFT adoption recovery and a favorable Bitcoin cycle, could push ENJ to $0.10-$0.20 or beyond.
The broader shift toward self-custodial, on-chain verifiable assets aligns with where serious DeFi infrastructure is heading. Platforms that build around transparent, trustless mechanics - whether in trading, gaming, or prediction markets - are structurally better positioned than those relying on opaque centralized systems. ENJ's minting mechanic reflects that philosophy.
Whether ENJ is the right bet for you depends entirely on your conviction in gaming NFT adoption, your time horizon, and your risk tolerance. Price targets are secondary to thesis clarity.
Crypto trading involves substantial risk of loss. ENJ is a high-volatility, small-cap asset, and past price performance is not indicative of future results. This article is for informational purposes only and should not be construed as financial advice. Always conduct your own research and assess your personal risk tolerance before making any investment decision.
Last updated: March 2026.
Frequently Asked Questions
What is the ENJ price prediction for 2026?
Most algorithmic models project ENJ ending 2026 in the $0.015-$0.022 range, depending on methodology. Bearish trend-extrapolation models point toward $0.015-$0.017 by December 2026, while optimistic linear growth models suggest $0.022-$0.025 at a 5% annual growth assumption. The wide spread reflects genuine uncertainty. Technically, ENJ needs to reclaim its 50-day SMA at ~$0.022 before any sustained recovery is credible. Current sentiment indicators (Extreme Fear, 37% green days) support the cautious end of the range.
What is the Enjin Coin price prediction for 2030?
Long-term ENJ price prediction for 2030 varies from approximately $0.003 (algorithmic model extrapolating current downtrend) to $0.025 (linear growth tool) to $0.20+ in an aggressive bull scenario driven by gaming NFT adoption. The extreme divergence in 2030 forecasts reflects how much uncertainty exists at this time horizon. ENJ's 2030 price will be determined primarily by whether Enjin's gaming platform captures meaningful market share against Immutable X, Polygon, and other gaming blockchain competitors. Monitor ecosystem adoption metrics, not price action, when evaluating the long-term ENJ thesis.
Is Enjin Coin a good investment in 2026?
Whether ENJ is a suitable investment in 2026 depends on your risk tolerance and thesis conviction - not on price targets alone. The technical setup is bearish-to-neutral, sentiment is at Extreme Fear, and the NFT gaming sector hasn't recovered from its 2022-2023 collapse. These conditions often mark accumulation phases for long-term investors. If you believe in blockchain gaming adoption and Enjin's specific minting mechanic as a sustainable differentiator, 2026 might represent a favorable entry zone. ENJ carries substantial risk of further decline; size positions accordingly.
What drives the price of ENJ?
Five key factors drive ENJ's price: (1) NFT gaming market adoption - the primary bull catalyst; (2) the minting/melting mechanic, which removes ENJ from circulating supply as games grow; (3) Bitcoin's market cycle, which ENJ amplifies in both directions as a high-beta altcoin; (4) Enjin platform development activity - game launches, developer tool updates, and partnership announcements; and (5) competition from other gaming blockchains like Immutable X, Ronin, and Polygon. Of these, NFT gaming adoption and BTC cycle direction have historically been the most dominant short-to-medium-term price drivers.
Will ENJ reach $1 again?
ENJ reaching $1 from current levels (~$0.020) would require approximately a 50x gain. That's not impossible in crypto - ENJ achieved this during the 2020-2021 bull run - but it would require an exceptional combination of gaming NFT market recovery, Enjin platform success, and a sustained crypto bull market. A scenario that could change the math: a major AAA game studio integrating Enjin infrastructure and driving millions of non-crypto-native users into the ENJ ecosystem. Possible, but not something to plan a portfolio around.
What wallet should I use to store ENJ long-term?
For long-term ENJ storage, a hardware wallet like Ledger or Trezor provides maximum security - ENJ exists as an ERC-20 token on Ethereum, so any hardware wallet with Ethereum support works. For software wallet options, MetaMask is the most widely used ERC-20 compatible wallet. Avoid keeping long-term ENJ holdings on exchanges: exchange counterparty risk (platform failures, hacks, withdrawal restrictions) is unnecessary when you can self-custody at no cost. The Enjin Wallet is also an option for users specifically within the Enjin ecosystem, with native support for Enjin NFTs.
What are the biggest risks of investing in ENJ?
ENJ's main investment risks include: (1) Continued NFT gaming market weakness - the primary catalyst for ENJ's collapse since 2021; (2) Competition - Immutable X, Polygon, and Ronin are all credible alternatives with competitive advantages; (3) Execution risk - Enjin's development roadmap delays or unsuccessful platform launches; (4) Liquidity risk - ENJ's relatively small market cap makes large positions difficult to exit without meaningful price impact; (5) Macro risk - prolonged Bitcoin bear market suppresses all altcoins, ENJ included.
