
The falling wedge pattern is one of the most dependable bullish setups in technical analysis - and one of the most misread. Traders enter too early, misplace their stops, or dismiss the signal entirely because they don't wait for volume confirmation. This guide covers everything that separates a disciplined falling wedge trade from a costly mistake: anatomy, identification, entry strategy, indicator confirmation, and risk management. Before diving in, it helps to be comfortable reading cryptocurrency charts - the pattern recognition skills in that foundation apply directly here.
⚡ Key Takeaways
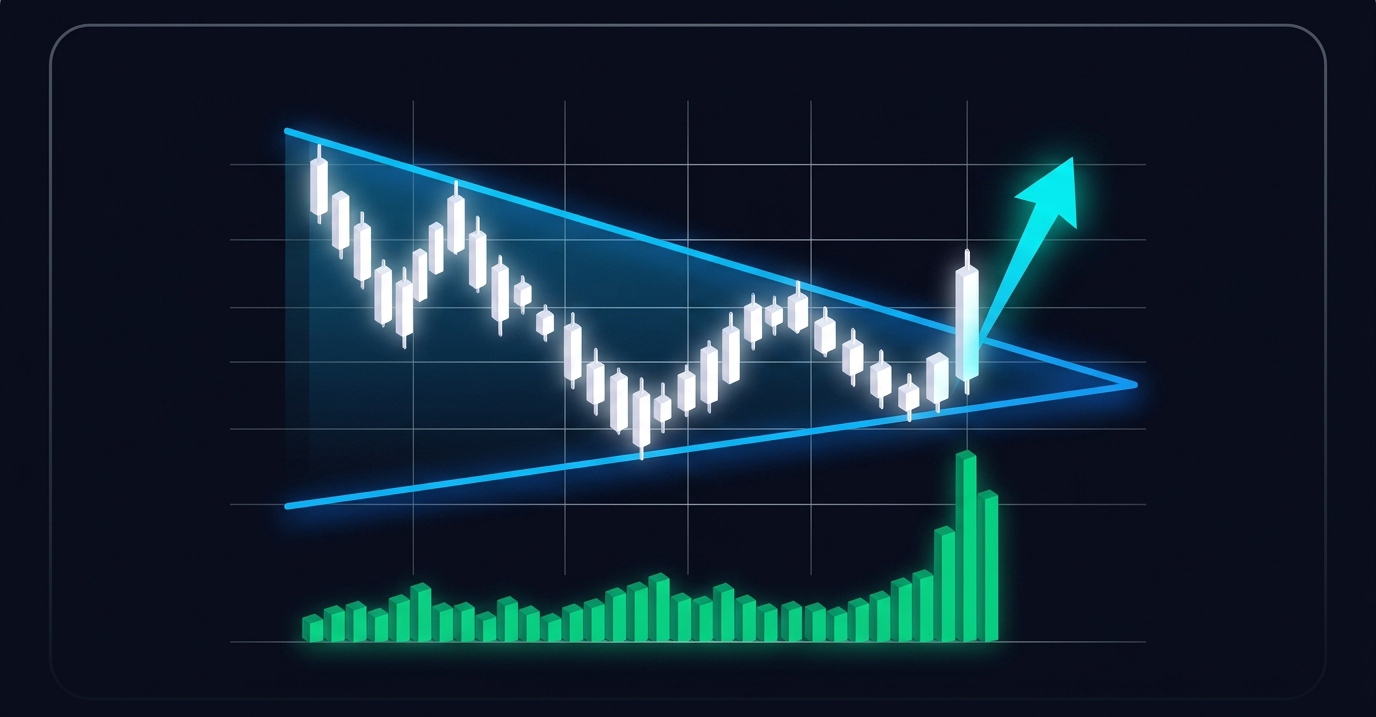
- The falling wedge is a bullish chart pattern formed by two downward-sloping, converging trendlines
- It signals weakening bearish momentum - sellers are still active, but losing their edge
- A confirmed candle close above the upper resistance line, backed by a volume surge, is the entry trigger
- The pattern functions as both a reversal (ending a downtrend) and a continuation (pause within an uptrend)
What Is a Falling Wedge Pattern?
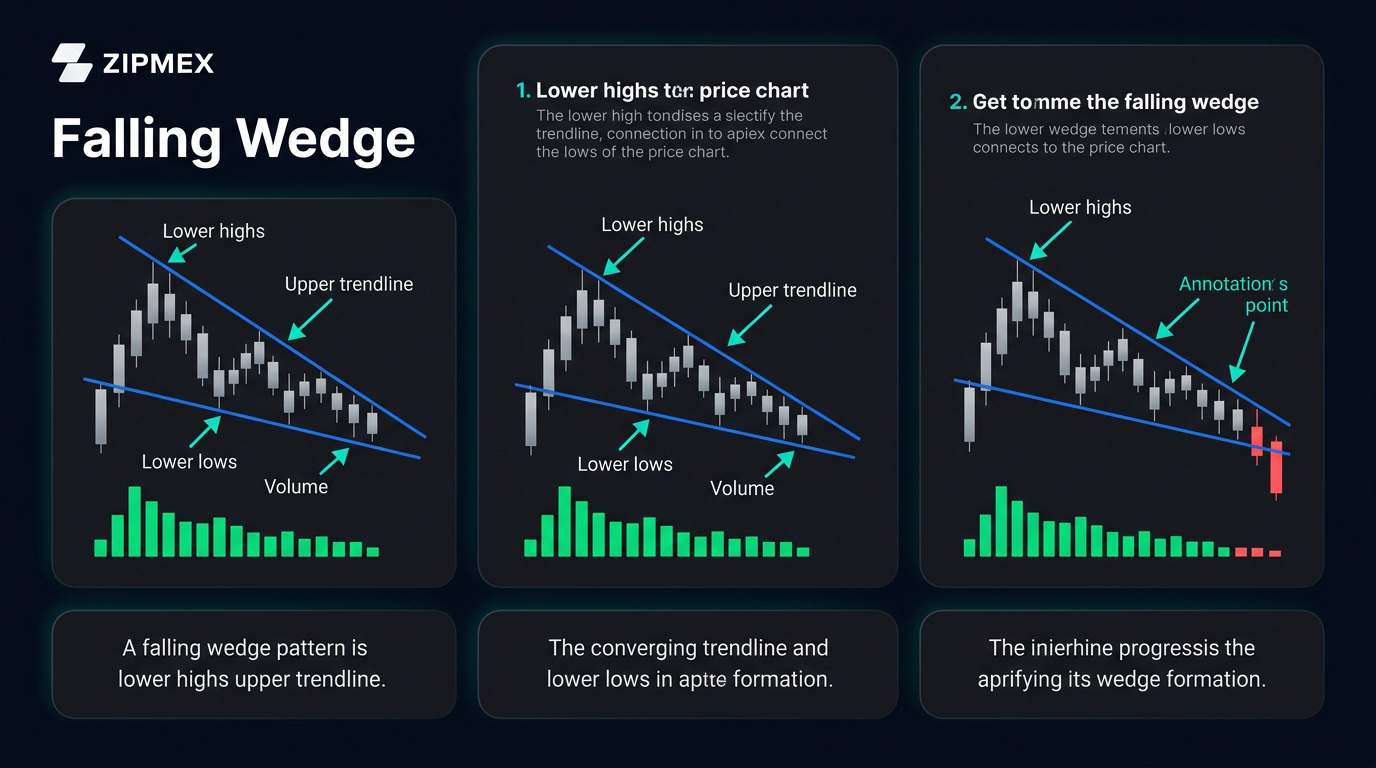
A falling wedge forms when price makes progressively lower highs AND lower lows within a narrowing price range. The key detail most explanations skip: the downward momentum is decelerating, not accelerating. Sellers are still pushing price lower, but with decreasing conviction - and that's exactly what the converging trendlines show.
The pattern goes by a second name - the descending wedge - and can appear in two distinct market contexts: as a reversal pattern at the end of a sustained downtrend, or as a continuation pattern during a brief pullback within a broader uptrend. According to StockCharts ChartSchool, the pattern ideally forms after an extended downtrend that is at least three months old. Understanding which context you're looking at changes how you weight the signal.
Anatomy of a Falling Wedge: Upper Resistance and Lower Support Lines
Two structural elements define the pattern. The upper resistance line connects a series of lower highs - you need a minimum of two touch points, but three significantly increases reliability. The lower support line connects a series of lower lows, again requiring at least two touch points for a valid draw.
The critical structural rule: the upper trendline must slope downward more steeply than the lower trendline. This asymmetric convergence is what makes it a wedge rather than a descending channel. If both lines slope at roughly the same angle, you're looking at a channel - not a wedge - and the bullish interpretation doesn't apply.
During formation, volume typically contracts. This contraction reflects dwindling seller conviction - the bears are still in control, but they're running out of energy. MACD and RSI are useful to monitor during this phase to track momentum erosion inside the wedge before the breakout arrives.
☑ Anatomy Checklist
- Upper resistance line: connects ≥2 lower highs (3 touch points = higher confidence)
- Lower support line: connects ≥2 lower lows (3 touch points = higher confidence)
- Upper line slopes steeper than lower line (asymmetric convergence)
- Volume declining during pattern formation
- RSI and MACD showing momentum erosion inside the wedge
Falling Wedge vs. Rising Wedge: Key Differences at a Glance
Both wedge patterns show tightening price ranges, but their directional implications are opposite. The one-sentence rule: a falling wedge breaks up; a rising wedge breaks down.
Both patterns require volume confirmation on breakout to be trusted - a point covered in detail in the confirmation section below.
How to Identify a Falling Wedge Pattern on Any Chart
Pattern recognition comes down to five repeatable steps:
- Confirm a prior downtrend - ideally at least three months on higher timeframes (daily or weekly). On shorter timeframes, the signal carries more noise.
- Identify at least two lower highs and draw the upper resistance line through them.
- Identify at least two lower lows and draw the lower support line through them.
- Verify asymmetric convergence - the upper line must slope more steeply than the lower line. If they're parallel, it's a channel, not a wedge.
- Wait for a confirmed candle close above the upper resistance line. An intraday poke above resistance doesn't count. A full candle close above it does.
Daily and weekly charts produce more reliable signals than intraday charts. On the 1-hour and below, noise distorts pattern structure enough that false signals become the norm rather than the exception.
Reversal vs. Continuation - Two Roles of the Falling Wedge
The reversal context is the most discussed - a falling wedge appears after a sustained downtrend, signaling that the bearish move is exhausting. Sellers have been in control for months, but the narrowing price range tells you their momentum is fading.
The continuation context gets far less attention but is equally valid: the falling wedge forms during an uptrend as a temporary pullback before price resumes higher. Think of it this way - in a downtrend, the falling wedge is a U-turn. In an uptrend, it's a pit stop.
Regardless of context, volume confirmation on the breakout is non-negotiable.
How to Trade the Falling Wedge: Entry, Stop-Loss, and Target
Three components define every falling wedge trade setup.
Entry: Buy on a confirmed candle close above the upper resistance line, ideally accompanied by a volume surge above the 20-day average volume. That volume surge is what distinguishes a genuine breakout from a fakeout.
Stop-loss: Place below the most recent swing low inside the wedge, or just below the lower support line. Either reference works - the choice depends on how much room you need relative to position size.
Take-profit: Measure the vertical height of the wedge at its widest point and project that distance upward from the breakout candle's close.
Here's how the math works in practice:
Falling wedges frequently produce 2:1 or better risk-reward ratios because the take-profit is defined by the full width of the prior consolidation - often a substantial move.
The Retest Strategy: A Lower-Risk Entry After the Breakout
Not all breakouts give you a retest - some break out and accelerate immediately. But when they do pull back, the retest entry is the patient trader's entry.
After price breaks above the upper resistance line, it sometimes pulls back to test that former resistance level as new support. Entering on this retest confirmation means a tighter stop-loss (just below the retest candle's low) and a better risk-reward ratio than the initial breakout entry.
Aggressive traders enter on the breakout close. Patient traders wait for the retest. Both approaches are valid - they carry different risk profiles, and your choice depends on how confident you are in the setup.
BREAKOUT SEQUENCE
Step 1
Breakout candle closes above upper resistance
Step 2
Price pulls back to former resistance level
Step 3 - Key Confirmation
Candle closes above resistance on the retest (confirmation that former resistance holds as new support)
Step 4 - Entry Triggered
Retest entry triggered - stop placed below retest candle's low
Confirming the Falling Wedge with Technical Indicators
The pattern itself is structural - it tells you where selling pressure is weakening. Indicators tell you how much it's weakening. Three primary confirmation tools are used:
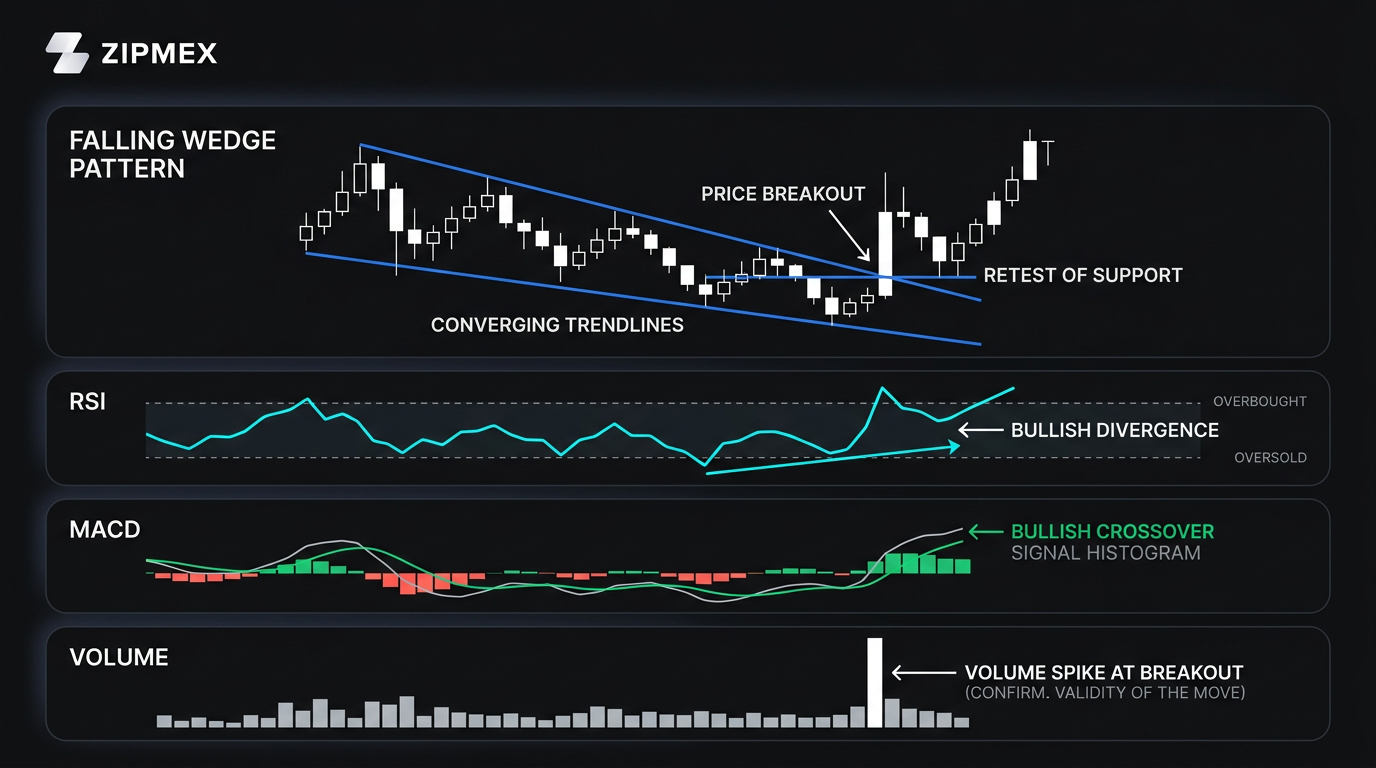
Volume is the most important. During wedge formation, volume should be declining. On the breakout candle, it should spike - ideally 1.5. to 2. the 20-day average. A breakout on thin volume is a warning, not a signal.
RSI is the second filter. Look for bullish divergence inside the wedge: price making lower lows while RSI makes higher lows. This is a direct indication that downside momentum is eroding before the breakout happens. Spot the divergence first - don't use it to confirm a breakout that's already happened.
MACD rounds out the confirmation stack. Watch for the MACD line crossing above the signal line as the breakout approaches or during the breakout candle. Combined with RSI divergence and volume surge, this creates a three-factor confluence signal that significantly increases confidence.
Fibonacci Retracement levels from the prior downswing - particularly the 38.2% and 61.8% levels - often align with wedge resistance zones. When a breakout coincides with price clearing a Fibonacci level, that confluence adds conviction to the setup.
☑ Confirmation Checklist
- Volume surge on breakout (≥1.5. 20-day average)
- RSI bullish divergence visible inside the wedge
- MACD line crossing above signal line at or near breakout
Reading RSI Bullish Divergence Inside the Wedge
Bullish divergence occurs when price makes a new low but RSI makes a higher low - signaling weakening downside momentum. Inside a falling wedge, this is the most reliable advance warning that the breakout is building pressure.
To spot it: on the price chart, mark each successive low inside the wedge. Then check the RSI panel at the same points. If RSI's lows are rising while price lows are falling, you have divergence. The wider the divergence gap, the stronger the signal.
Most analysis on falling wedges mentions RSI without explaining the divergence mechanics. This is the detail that separates traders who catch the breakout early from those who chase it.
Common Mistakes and False Breakout Risks
The falling wedge is reliable - but only when executed correctly. These are the five mistakes that cause the most losses:
False breakouts look like the real thing: price closes above resistance, and then snaps back inside the wedge within 1-2 candles. The volume filter eliminates most of them. A breakout on weak volume is almost always a false signal - let it fail, and wait for the real one.
Falling Wedge Trading Strategies: Swing, Day Trading, and Trend Following
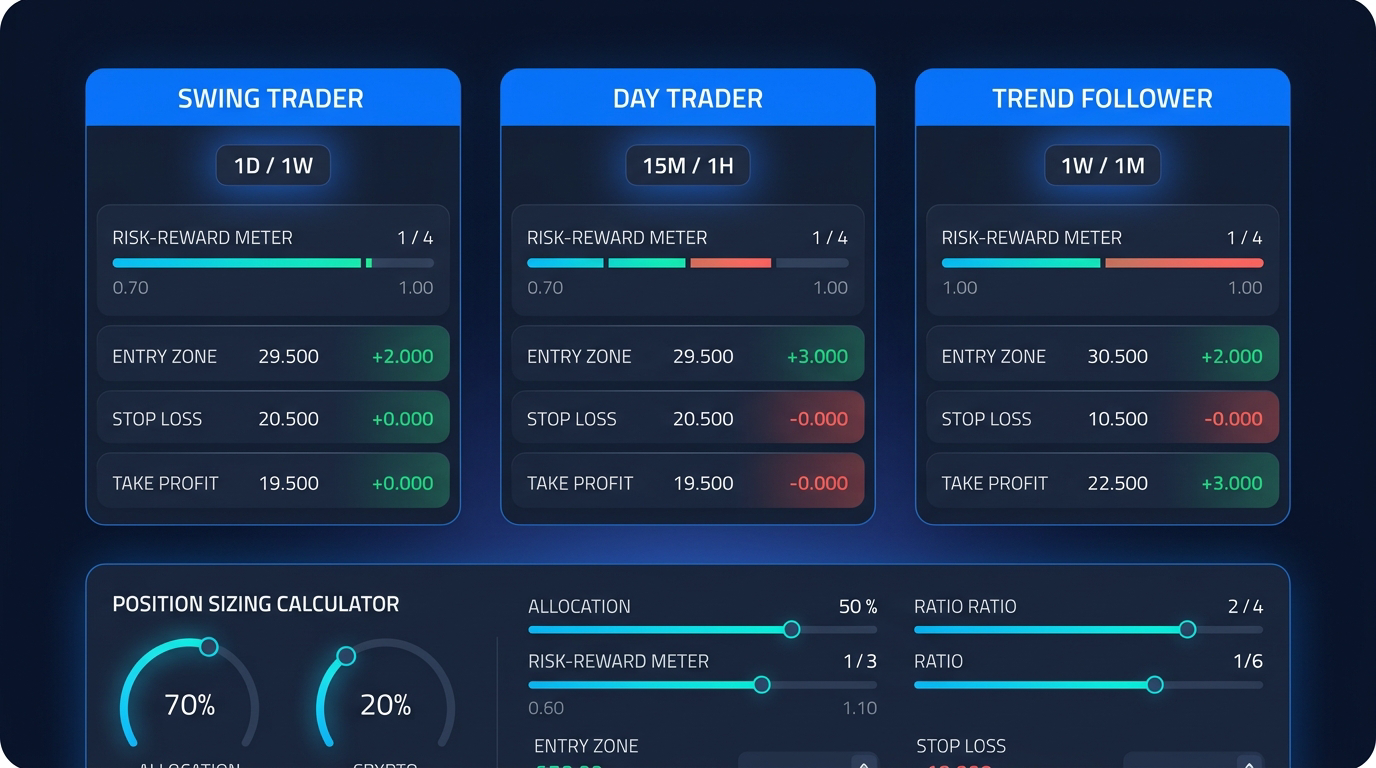
The falling wedge works across timeframes and asset classes - stocks, crypto, forex - but each trader type uses it differently. For a broader view of how these strategies fit into the current market environment, see how to navigate crypto in 2026.
Trend followers can combine the falling wedge breakout with a 50-day or 200-day moving average crossover for a powerful confluence signal - the wedge identifies the local reversal point, while the moving average confirms the broader trend is resuming.
Risk Management Rules for Every Falling Wedge Trade
No pattern is worth trading without a defined risk structure. Sound crypto risk management is the factor that determines whether a trader survives to play the next setup. These four rules apply regardless of which strategy you use:
- Risk no more than 1-2% of account capital per trade
- Position size = risk amount ÷ (entry price - stop-loss price)
- Minimum acceptable risk-reward ratio: 1.5:1 before entering
- Use the wedge height measurement as your take-profit - it creates an objective exit from the start
Here's the position sizing formula applied:
Wider wedges - those that form over longer timeframes - tend to generate larger breakout moves. A wedge that took three months to form will typically produce a more sustained directional move than one that formed over three weeks.
Alternatives to the Falling Wedge: Related Bullish Chart Patterns
The falling wedge isn't the only tool in the reversal pattern toolkit. Four related patterns are worth knowing:
- Bull Flag - similar consolidation structure but with parallel trendlines (not converging). Forms faster - typically over days rather than weeks - after a sharp directional move.
- Ascending Triangle - flat upper resistance with a rising lower support line. Also bullish, but the breakout mechanics differ from the wedge.
- Pennant - a very tight symmetrical consolidation after a sharp impulsive move. Smaller and faster than a wedge; less applicable to longer-term reversal analysis.
- Inverse Head and Shoulders - a more complex three-point reversal structure with a defined neckline. More confirmation steps required but arguably more powerful for major trend reversals.
Whether you trade the falling wedge or any of these variants, the foundation remains constant: confirmed breakout, volume validation, defined stop, objective target.
Conclusion
The falling wedge pattern earns its place in any serious trader's toolkit because it provides exactly what objective analysis demands - a measurable entry, a defined stop, and a calculated target derived from the structure itself. It's not guesswork. The pattern tells you where selling pressure is weakening; volume confirms when buyers have taken control; RSI divergence gives you early warning before the breakout develops.
Beginners: Start on daily charts. Master identifying the two trendlines and the touch-point rule before placing any live trades. Pattern recognition improves substantially with deliberate practice on historical charts.
Intermediate traders: Add the RSI bullish divergence filter and the volume confirmation requirement before every entry. These two conditions alone will eliminate most false signals.
Advanced traders: Integrate the falling wedge into a multi-timeframe strategy - identify the pattern on the daily chart, use the 4-hour for entry timing, apply the retest strategy for optimal risk-reward, and size positions using the 1-2% per-trade rule.
According to research compiled across equity and crypto markets, the falling wedge has a success rate in the 65-75% range when the pattern is correctly identified with proper trendline construction and volume confirmation. That rate drops significantly when traders skip the confirmation step.
Practice the pattern on historical data before applying it live. Identify, measure, and paper-trade 10 setups before risking capital. The edge is real - but only if the execution is disciplined.
Last updated: March 2026.
Crypto trading involves substantial risk of loss. Leveraged trading amplifies both gains and losses. Nothing in this guide constitutes financial advice. Always conduct your own research and trade only capital you can afford to lose.
Frequently Asked Questions
What is a falling wedge pattern in technical analysis?
A falling wedge is a bullish chart pattern that forms when price makes progressively lower highs and lower lows within a converging, downward-sloping range. The critical distinction: the upper resistance trendline must slope more steeply than the lower support trendline, creating an asymmetric wedge shape rather than a parallel channel. This narrowing price action signals that selling pressure is weakening - not strengthening - even though price is still declining. When price breaks above the upper resistance line with volume confirmation, it typically signals the start of a meaningful upward move.
Is the falling wedge a bullish or bearish signal?
The falling wedge is a bullish signal. Despite the downward-sloping structure, the pattern indicates that bearish momentum is fading and buyers are beginning to absorb selling pressure. The expected outcome is a breakout above the upper resistance trendline followed by upside price movement. The target is calculated by measuring the widest vertical distance between the two trendlines and projecting it upward from the breakout point. No chart pattern carries certainty - volume confirmation and indicator alignment are essential before acting on the signal.
What is the difference between a falling wedge and a rising wedge?
The two wedge patterns are mirror images with opposite directional implications. A falling wedge slopes downward and signals a bullish breakout - sellers are losing control. A rising wedge slopes upward and signals a bearish breakdown - buyers are losing conviction. Both show converging trendlines and declining volume during formation. The expected breakout direction is the key difference: up for the falling wedge, down for the rising wedge. Both patterns require volume confirmation on the breakout to be considered reliable.
What does a falling wedge breakout look like?
A valid falling wedge breakout consists of a full candle close above the upper resistance trendline, accompanied by a volume spike - typically 1.5. to 2. the 20-day average volume. An intraday poke above resistance that closes back inside the wedge is not a breakout; it's a false signal. The breakout candle should close clearly above resistance, and subsequent candles should hold above that former resistance level. Some setups produce a retest of the broken resistance as new support before continuing higher - entering on that retest provides a more favorable risk-reward than chasing the initial move.
How do I set my entry, stop-loss, and take-profit when trading a falling wedge?
Entry: buy on the breakout candle's close above the upper resistance line, with volume confirmation. Stop-loss: place below the most recent swing low inside the wedge, or just below the lower support trendline. Take-profit: measure the vertical height of the wedge at its widest point and add that distance to the breakout price. For example, if the widest point spans $15 (from $85 to $100) and the breakout occurs at $102, the take-profit target is $117. This mechanical calculation creates an objective exit level from the start - no guesswork required.
Why is volume so important when trading the falling wedge?
Volume is the single most important confirmation signal in a falling wedge trade because it distinguishes genuine breakouts from false ones. During wedge formation, declining volume reflects weakening seller conviction. When price breaks above resistance on a volume surge, it signals that buyers have stepped in with conviction - not just a momentary absence of sellers. A breakout on thin or below-average volume is a serious warning sign that the move may reverse quickly. Requiring a volume threshold of at least 1.5. average volume before entry eliminates the majority of false breakout signals.
What is RSI bullish divergence and how does it confirm a falling wedge?
RSI bullish divergence occurs when price makes a new lower low but the RSI indicator makes a higher low at the same point. Inside a falling wedge, this divergence means that even though price is still declining, downside momentum is measurably weakening - exactly what the pattern structure is signaling on the price chart. Spot the divergence by marking each successive price low inside the wedge, then checking whether RSI lows are rising at the same points. This advance indicator fires before the breakout happens, giving you early warning that the bullish move is building pressure beneath the surface.
