
With Bitcoin's funding rate averaging +0.51% (70.2% APR) in early 2026 and ETF inflows surging $840 million in January alone, understanding how to analyze funding rates in crypto has never been more critical. Whether you're paying these rates or collecting them, this mechanism directly impacts your trading profitability.
⚡ Quick Answer
Funding rates are periodic payments (every 1-8 hours) between long and short traders in perpetual futures contracts. Positive rates mean longs pay shorts (bullish sentiment), negative rates mean shorts pay longs (bearish sentiment). In January 2026, BTC funding averages +0.51%-meaning longs pay 70.2% APR to maintain positions. Track rates on CoinGlass, use them for sentiment analysis, timing entries, or capture 15-20%+ annual returns through funding rate arbitrage.

What Are Funding Rates in Crypto Trading?
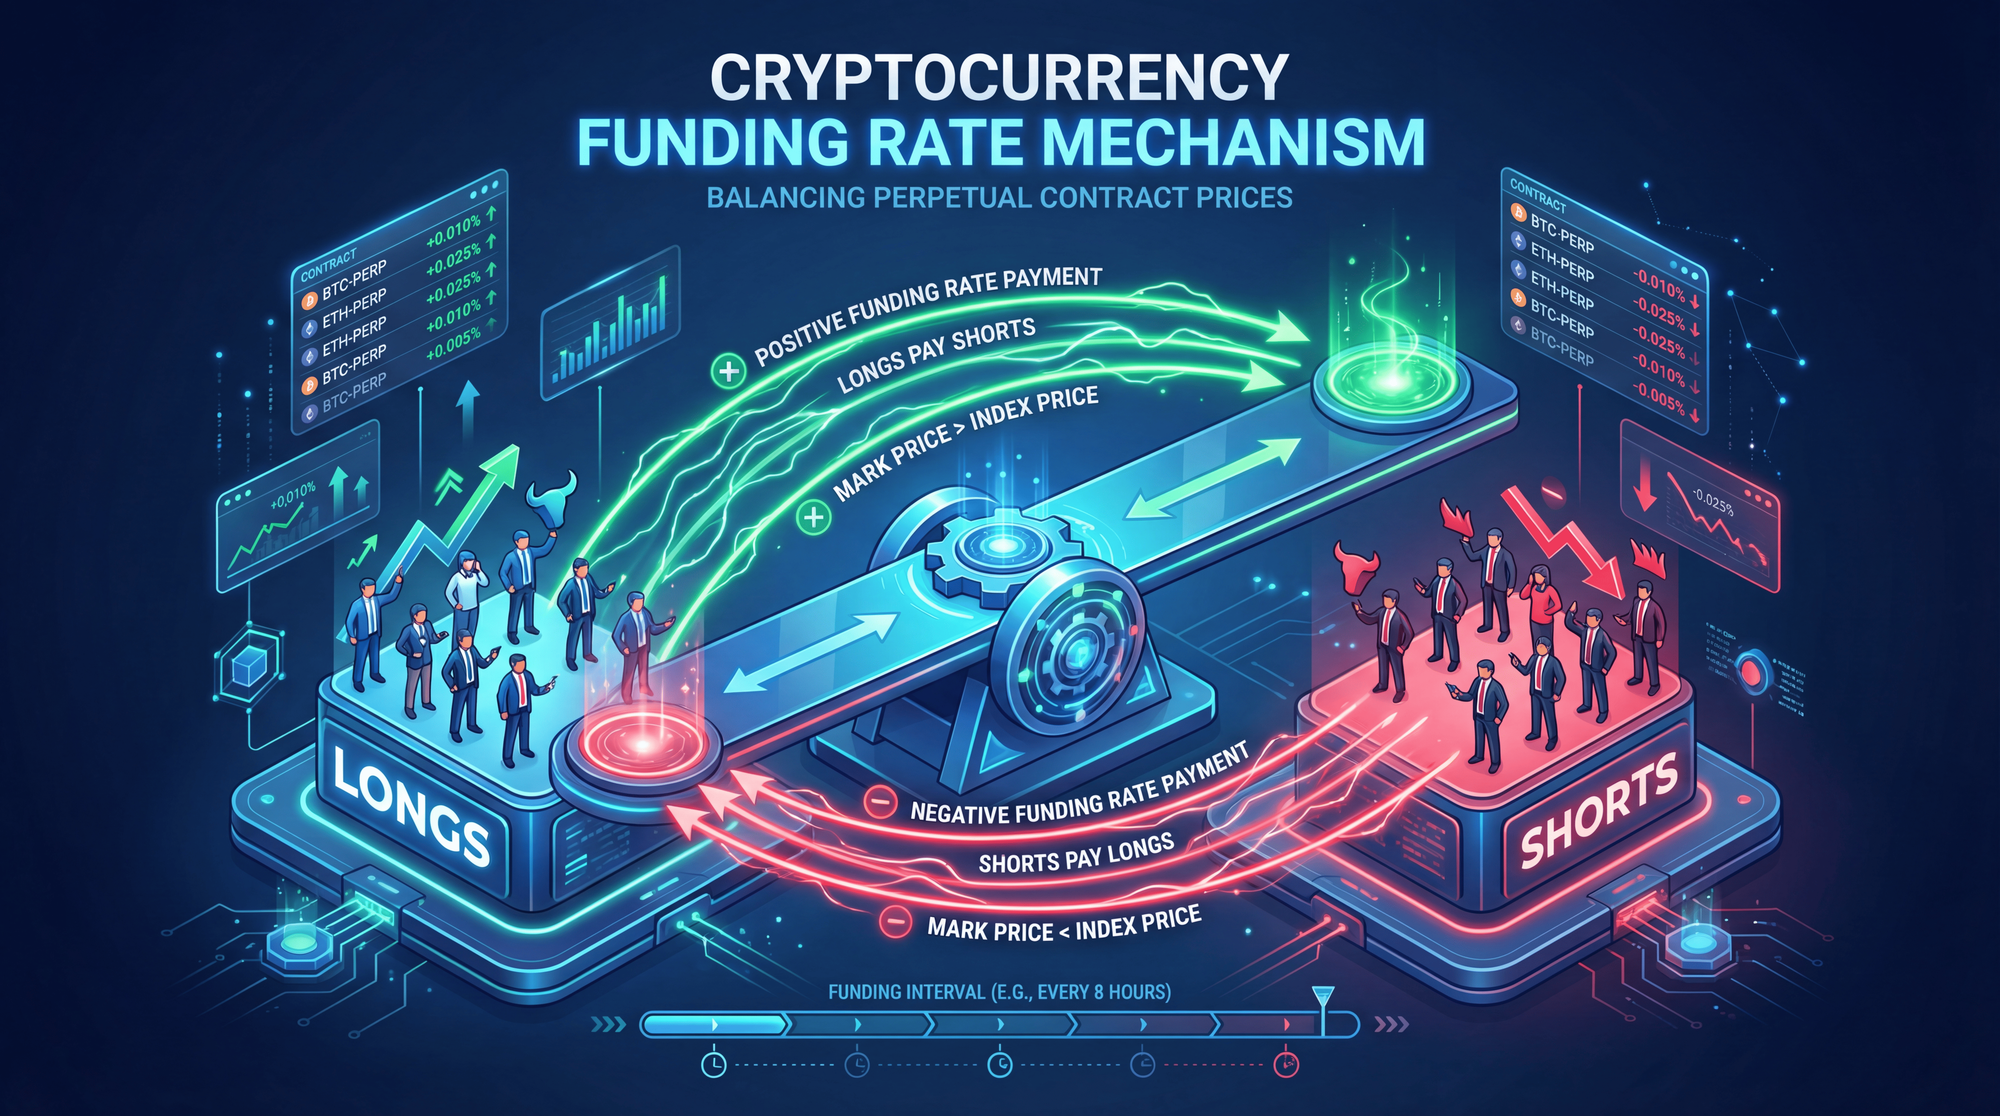
Funding rates are periodic payments exchanged between traders holding long (buy) and short (sell) positions in perpetual futures contracts. Unlike traditional futures that expire on specific dates, perpetual contracts never expire-funding rates keep their prices aligned with the spot market.
Here's the core mechanism: when too many traders bet on prices going up (long positions), the perpetual contract price rises above the spot price. The funding rate corrects this imbalance by charging longs and paying shorts, incentivizing traders to take the opposite side and restore equilibrium.
This concept originated with BitMEX's perpetual swap contracts and has since become the industry standard across centralized exchanges like Binance, Bybit, and OKX, as well as DeFi protocols like dYdX and Hyperliquid.
Why Funding Rates Matter for Every Trader
Even if you never trade perpetual futures, funding rates affect you:
For spot traders: Funding rates signal market sentiment. Extreme rates often precede price reversals-useful intelligence for timing spot buys and sells.
For futures traders: Funding directly impacts your profitability. At +0.51% funding (January 2026 average), holding a $10,000 long position costs you $51 every 8 hours-that's $153/day or $4,590/month.
For arbitrage traders: Funding rate discrepancies create low-risk profit opportunities. Professional firms running delta-neutral strategies captured 19.26% annual returns in 2025.
How Funding Rates Are Calculated
Understanding the calculation helps you anticipate rate changes before they impact your positions.
The Two Components
1. Interest Rate (Fixed)
A baseline rate set by the exchange, typically 0.01% per 8-hour period (0.03% daily). This reflects the cost of borrowing the quote currency (usually USDT/USD) versus the base currency (e.g., BTC).
2. Premium Index (Variable)
The difference between the perpetual contract price and the spot/index price. This is where sentiment comes in:
- Perpetual price > Spot price = Positive premium = Positive funding
- Perpetual price < Spot price = Negative premium = Negative funding
The Formula
Funding Rate = Interest Rate + Premium Index
Most exchanges cap funding rates (typically ±0.75% to ±3%) to prevent extreme values during volatile markets.
Funding Fee Calculation
📐 Funding Fee Formula
Funding Fee = Position Size . Funding Rate
Example: Without Leverage
- Position Size: $10,000
- Funding Rate: +0.01% (standard baseline)
- Funding Fee: $10,000 . 0.0001 = $1 per interval
Example: With 10x Leverage
- Margin: $10,000
- Leverage: 10x
- Effective Position Size: $100,000
- Funding Rate: +0.01%
- Funding Fee: $100,000 . 0.0001 = $10 per interval
⚠ Critical Warning
Leverage amplifies funding costs 1:1. A "small" 0.1% funding rate with 10x leverage means you pay 1% of your margin every 8 hours-27% of your capital per month. Many traders get liquidated not from price moves, but from accumulated funding fees.
Funding Settlement Schedules by Exchange
Different exchanges settle funding at different intervals. This affects your trading costs and arbitrage opportunities.
Why this matters: With hourly funding (Kraken, Hyperliquid), rates compound faster but typically stay lower per interval. With 8-hour funding (Binance, Bybit), rates can spike higher at each settlement but you have more time to adjust positions.
How to Track Funding Rates in Real-Time
Professional traders never open a position without checking funding rates first. Here are the essential tools:
CoinGlass (Industry Standard)
CoinGlass aggregates funding rates across 15+ exchanges in real-time. Key features:
Funding Rate Heatmap - Visual overview showing which coins have high/low funding across all exchanges. Orange = expensive longs. Purple = longs get paid.
OI-Weighted Rates - Funding rates weighted by Open Interest, showing where most capital is actually positioned.
Predicted Rates - Estimate the next funding payment before it settles-crucial for timing entries/exits.
Historical Data - Analyze how funding correlated with past price moves.
Access: coinglass.com/FundingRate
Exchange-Native Dashboards
Binance: Futures → Info → Funding Rate History
Bybit: Derivatives → Funding Rate tab
OKX: Trading → Perpetual → Funding Rate
CryptoQuant (On-Chain + Derivatives)
Provides minute-based funding rates (vs standard 8-hour snapshots) plus on-chain metrics for deeper analysis.
🎯 Key Takeaways: Tracking Tools
- Always check funding before opening any perpetual position
- Use heatmaps to spot which coins have extreme funding (opportunities or risks)
- Monitor predicted rates to anticipate the next payment
- Compare across exchanges for arbitrage opportunities
Funding Rates as a Market Sentiment Indicator
Funding rates reveal what the majority of leveraged traders believe will happen next. Here's how to interpret them:
Positive Funding Rates = Bullish Sentiment
When funding is positive:
- More traders are long (betting price goes up)
- Longs pay shorts to maintain positions
- Indicates market confidence
Current Example (January 2026): Bitcoin's average funding of +0.51% (70.2% APR) shows sustained long bias, with institutional buyers willing to pay significant premiums to maintain exposure.
Negative Funding Rates = Bearish Sentiment
When funding is negative:
- More traders are short (betting price goes down)
- Shorts pay longs to maintain positions
- Indicates fear or expectation of decline
The Contrarian Signal: Extreme Rates
Extremely high positive funding often signals danger:
- Market is over-leveraged long
- Small price drops trigger cascading liquidations
- "Leverage flush" of 10-30% corrections common
Extremely negative funding often signals opportunity:
- Panic selling / capitulation
- Shorts become overcrowded
- Short squeeze potential
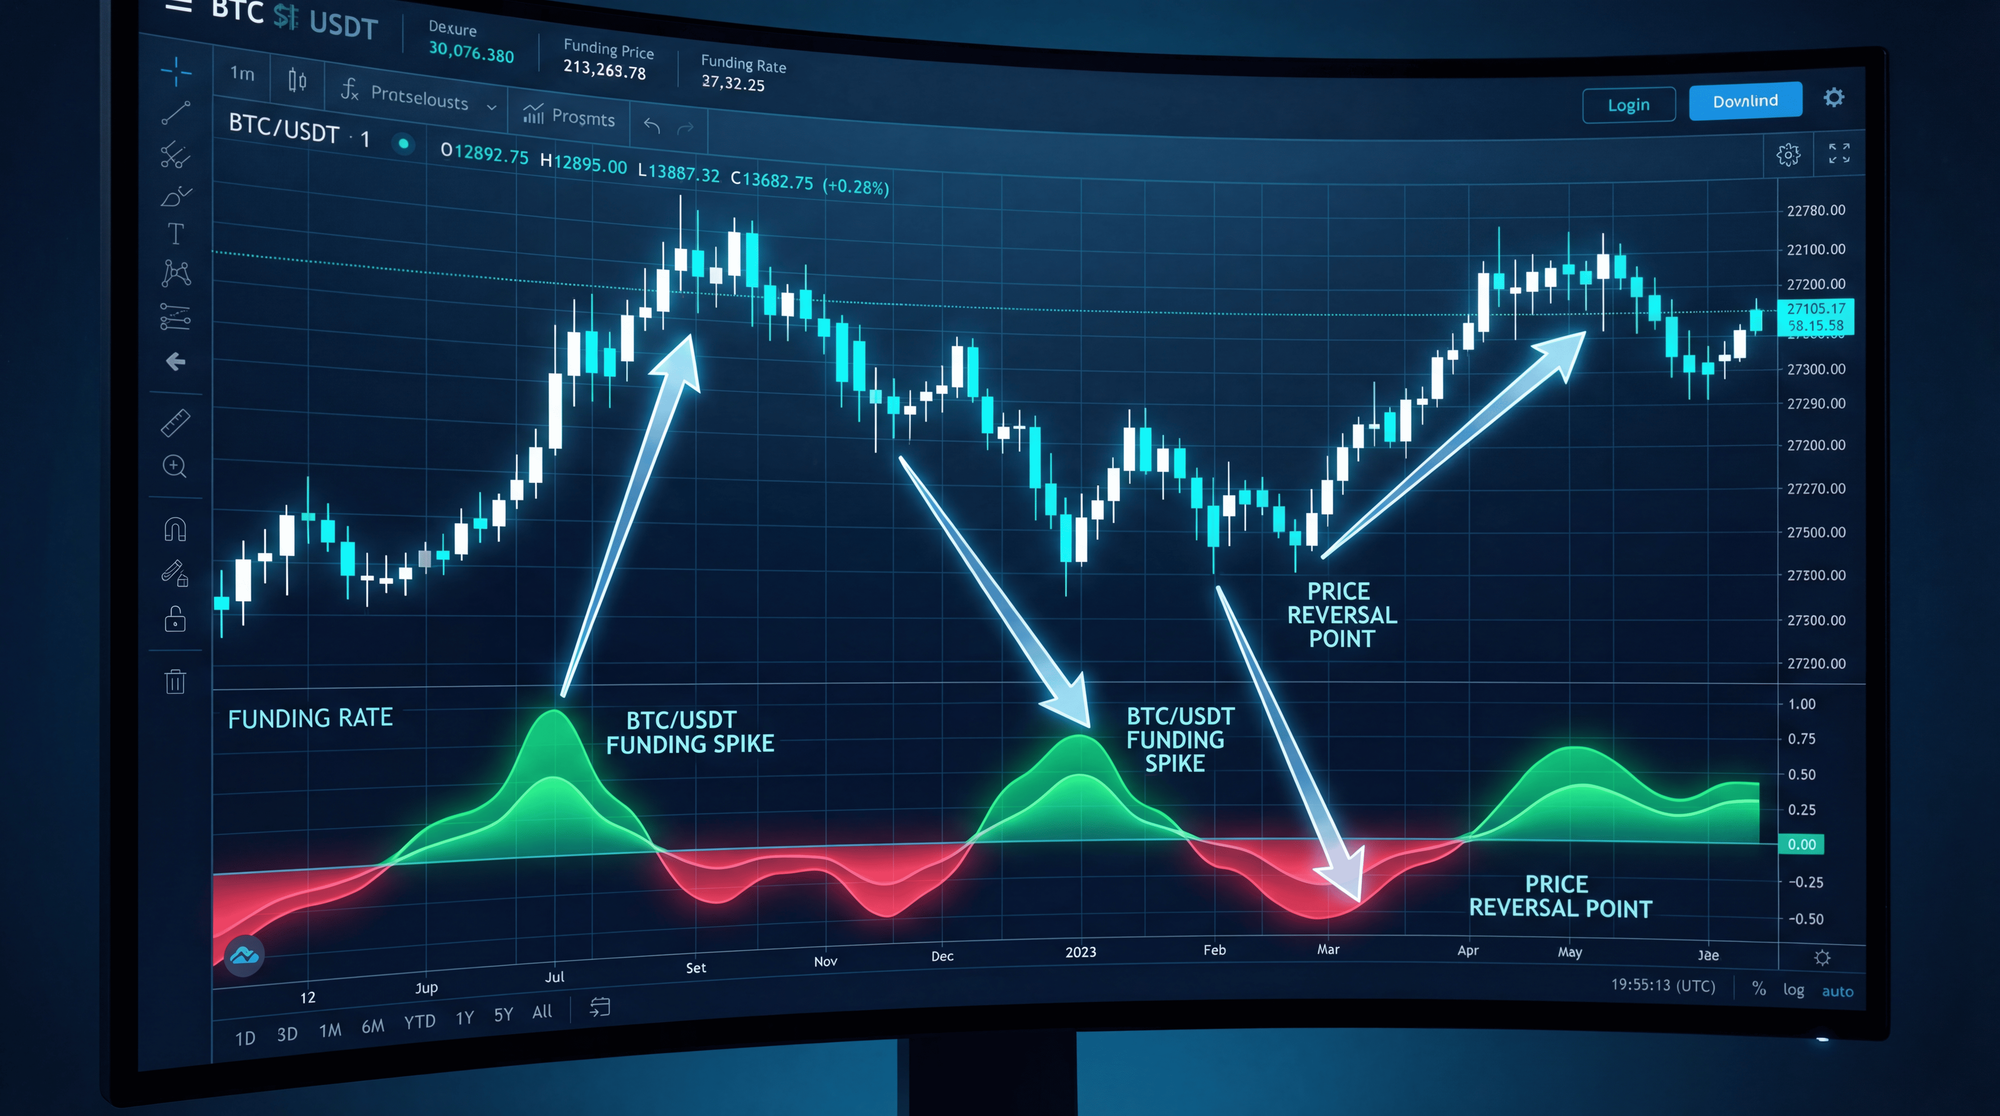
Historical Examples: When Funding Rates Predicted Reversals
Understanding how funding rates behaved during major market events helps you recognize similar patterns in real-time.
📅 Historical Funding Rate Events
March 2020 - COVID Crash
BTC dropped 50% in 48 hours. Funding went deeply negative as shorts dominated. Extreme negative funding marked the exact bottom-BTC rallied 1,500% over next 18 months.
May 2021 - China Mining Ban
Funding flipped aggressively negative during the 55% correction. The extreme negative rates coincided with the local bottom before BTC recovered to new highs by November 2021.
November 2022 - FTX Collapse
Funding turned deeply negative during the cascade. Once again, extreme negative funding marked the cycle bottom at ~$15,500. BTC subsequently rallied 600%+ to new ATH.
January 2025 - All-Time High $109,450
Funding rates reached extreme positive levels as euphoria peaked. The overleveraged long positions led to a correction as funding costs became unsustainable.
January 2026 - Current
BTC consolidating $97K-$106K with +0.51% average funding (70.2% APR). Funding compressed 37 basis points in mid-January, suggesting leverage normalization and healthier market structure.
Funding Rate vs Open Interest: Using Both Metrics
Funding rates alone don't tell the full story. Combine them with Open Interest (OI) for more accurate analysis.
Open Interest = Total value of all open derivative contracts. Rising OI means new money entering the market. Falling OI means positions closing.
Funding Rate Divergences: Advanced Analysis
One of the most powerful signals comes from divergences between funding rates and price action.
Bullish Divergence: Negative Funding During Uptrend
When price is rising but funding is negative:
- Shorts are aggressively fighting the trend (paying to stay short)
- They're likely to get squeezed
- Signal: Continuation higher likely
Bearish Divergence: Positive Funding During Downtrend
When price is falling but funding stays positive:
- Longs are stubbornly holding despite losses
- Eventually they'll capitulate or get liquidated
- Signal: More downside likely until funding normalizes
Tools for Automated Funding Rate Trading
Manual funding arbitrage works, but automation improves efficiency. Here are the main options in 2026:
Exchange-Native Bots
Binance Futures Bot - Built-in arbitrage bot using delta-neutral strategy. Users input investment size, and the bot handles spot buying, perp shorting, and position management automatically.
OKX Smart Arbitrage - Similar functionality with support for multiple pairs. Works across hundreds of cryptocurrency pairs with automatic position sizing.
These bots are beginner-friendly but limited to single-exchange strategies.
Third-Party Tools
For cross-exchange arbitrage, traders typically use:
- Portfolio management platforms like 1Token
- Custom trading bots via exchange APIs
- DeFi protocols like Boros for fixed-yield funding strategies
Professional traders managing significant capital often develop custom solutions, though the barrier to entry has decreased significantly with exchange-native tools.
Common Mistakes When Trading Funding Rates
After analyzing thousands of trades, here are the errors that hurt traders most:
Mistake 1: Ignoring Funding Costs with Leverage
Leverage amplifies funding costs proportionally. A 10x leveraged position pays 10x the funding rate. What seems like a small 0.03% rate becomes 0.3% per 8 hours-potentially 27% per month eating into your capital.
Before opening leveraged positions, calculate your worst-case funding costs over your expected holding period.
Mistake 2: Holding Through Funding Spikes
Funding rates can spike dramatically during volatile markets. During the 2021 bull run, rates exceeded 0.1% per 8 hours for extended periods-equivalent to paying 100%+ annually.
If you're holding a long position and funding spikes, consider closing before the funding timestamp and reopening after.
Mistake 3: Assuming High Funding = Imminent Crash
New traders often think extremely positive funding guarantees an incoming crash. This isn't true. In bull markets, elevated funding can persist for weeks or months while prices continue climbing.
Use funding as one input among many, not as a standalone signal.
Mistake 4: Not Accounting for Exchange Differences
Each exchange calculates funding differently. Some use 8-hour intervals, others use 1-hour or 4-hour intervals. Index price sources vary. What looks like an arbitrage opportunity might disappear once you account for these differences.
Always verify the funding mechanics on each exchange before executing cross-exchange strategies.
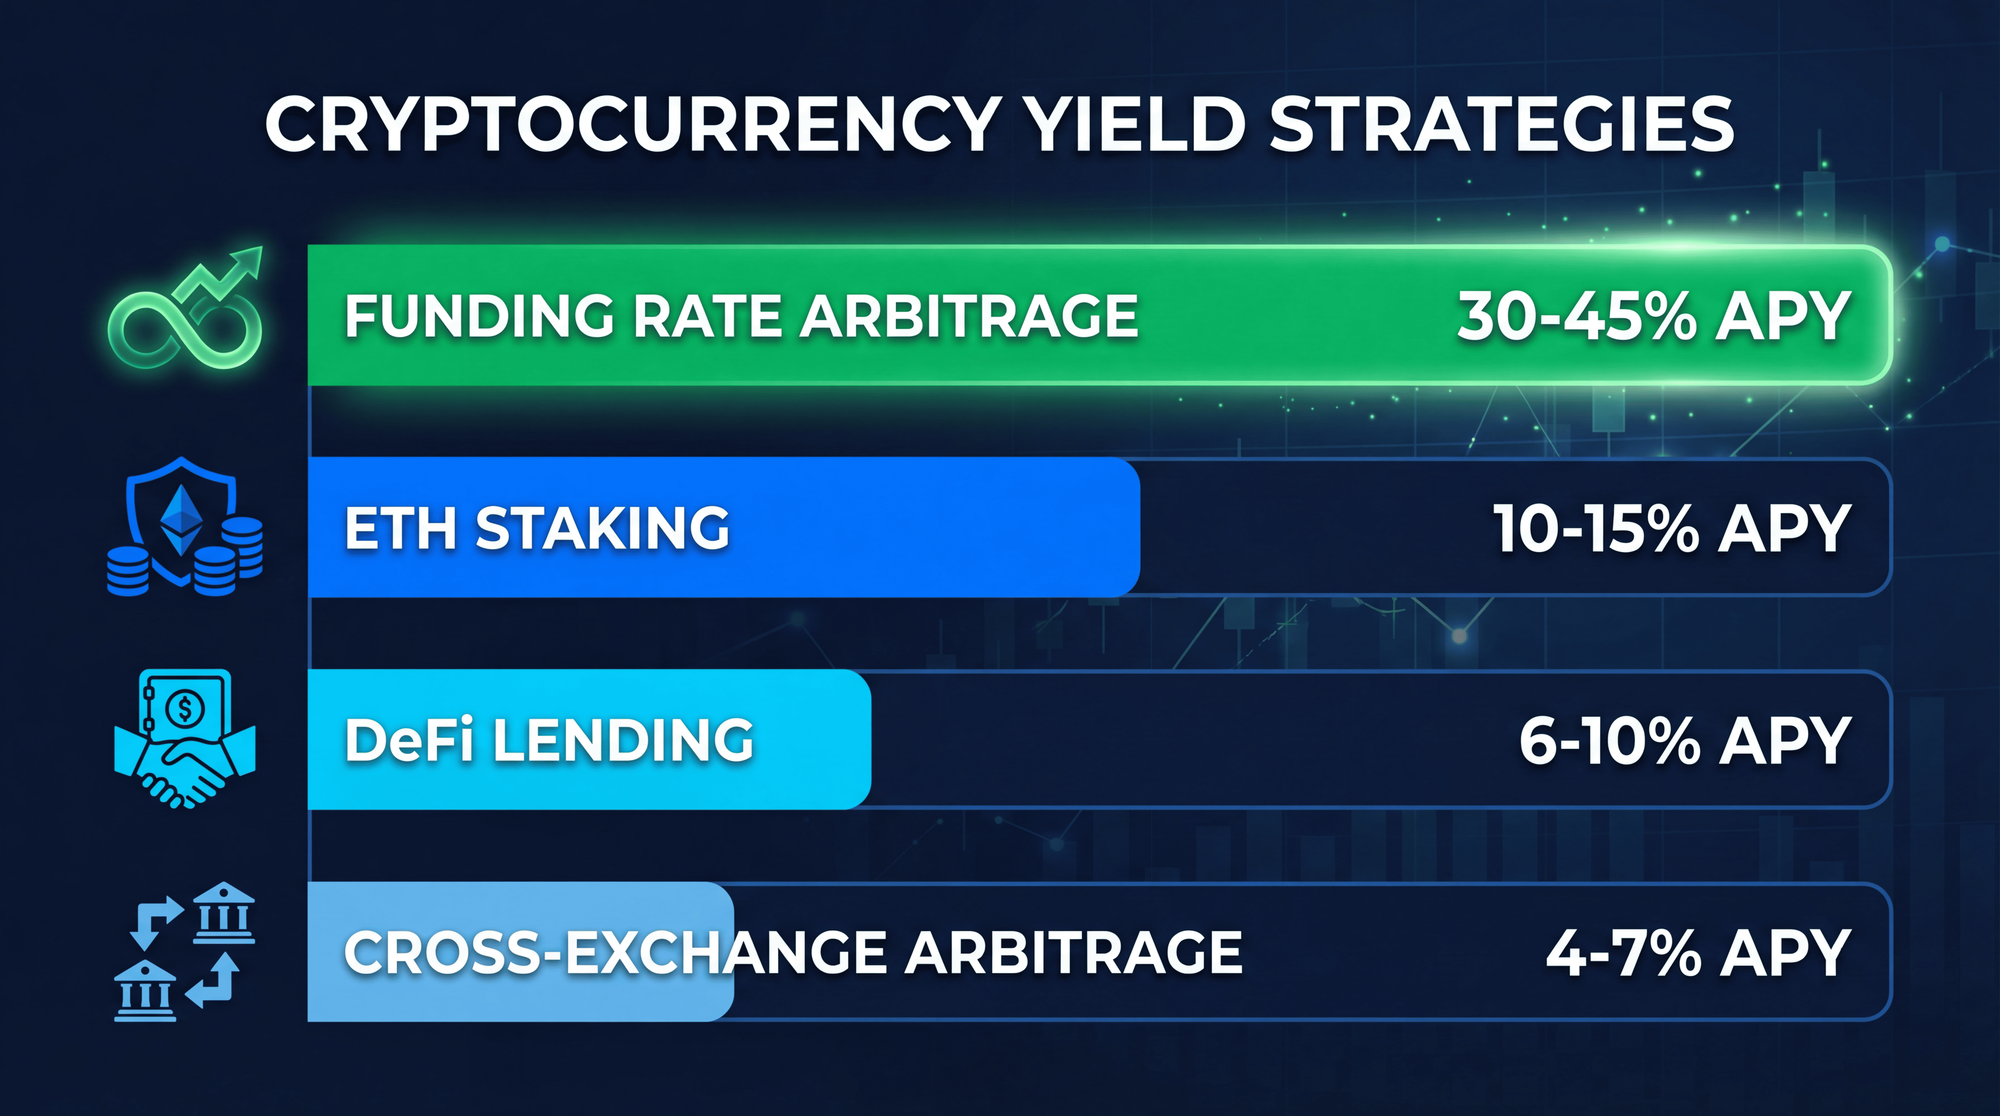
Funding Rates vs. Other Yield Strategies
How does funding rate trading compare to other crypto yield strategies? Here's a realistic comparison:
Funding arbitrage offers a compelling middle ground: higher yields than passive staking with lower risk than directional trading. The strategy's key advantage is market-neutrality-your returns don't depend on crypto prices going up or down.
Funding Rate Trading Strategies for 2026
Now for the actionable strategies. Here are four proven approaches ranked by complexity and capital requirements:
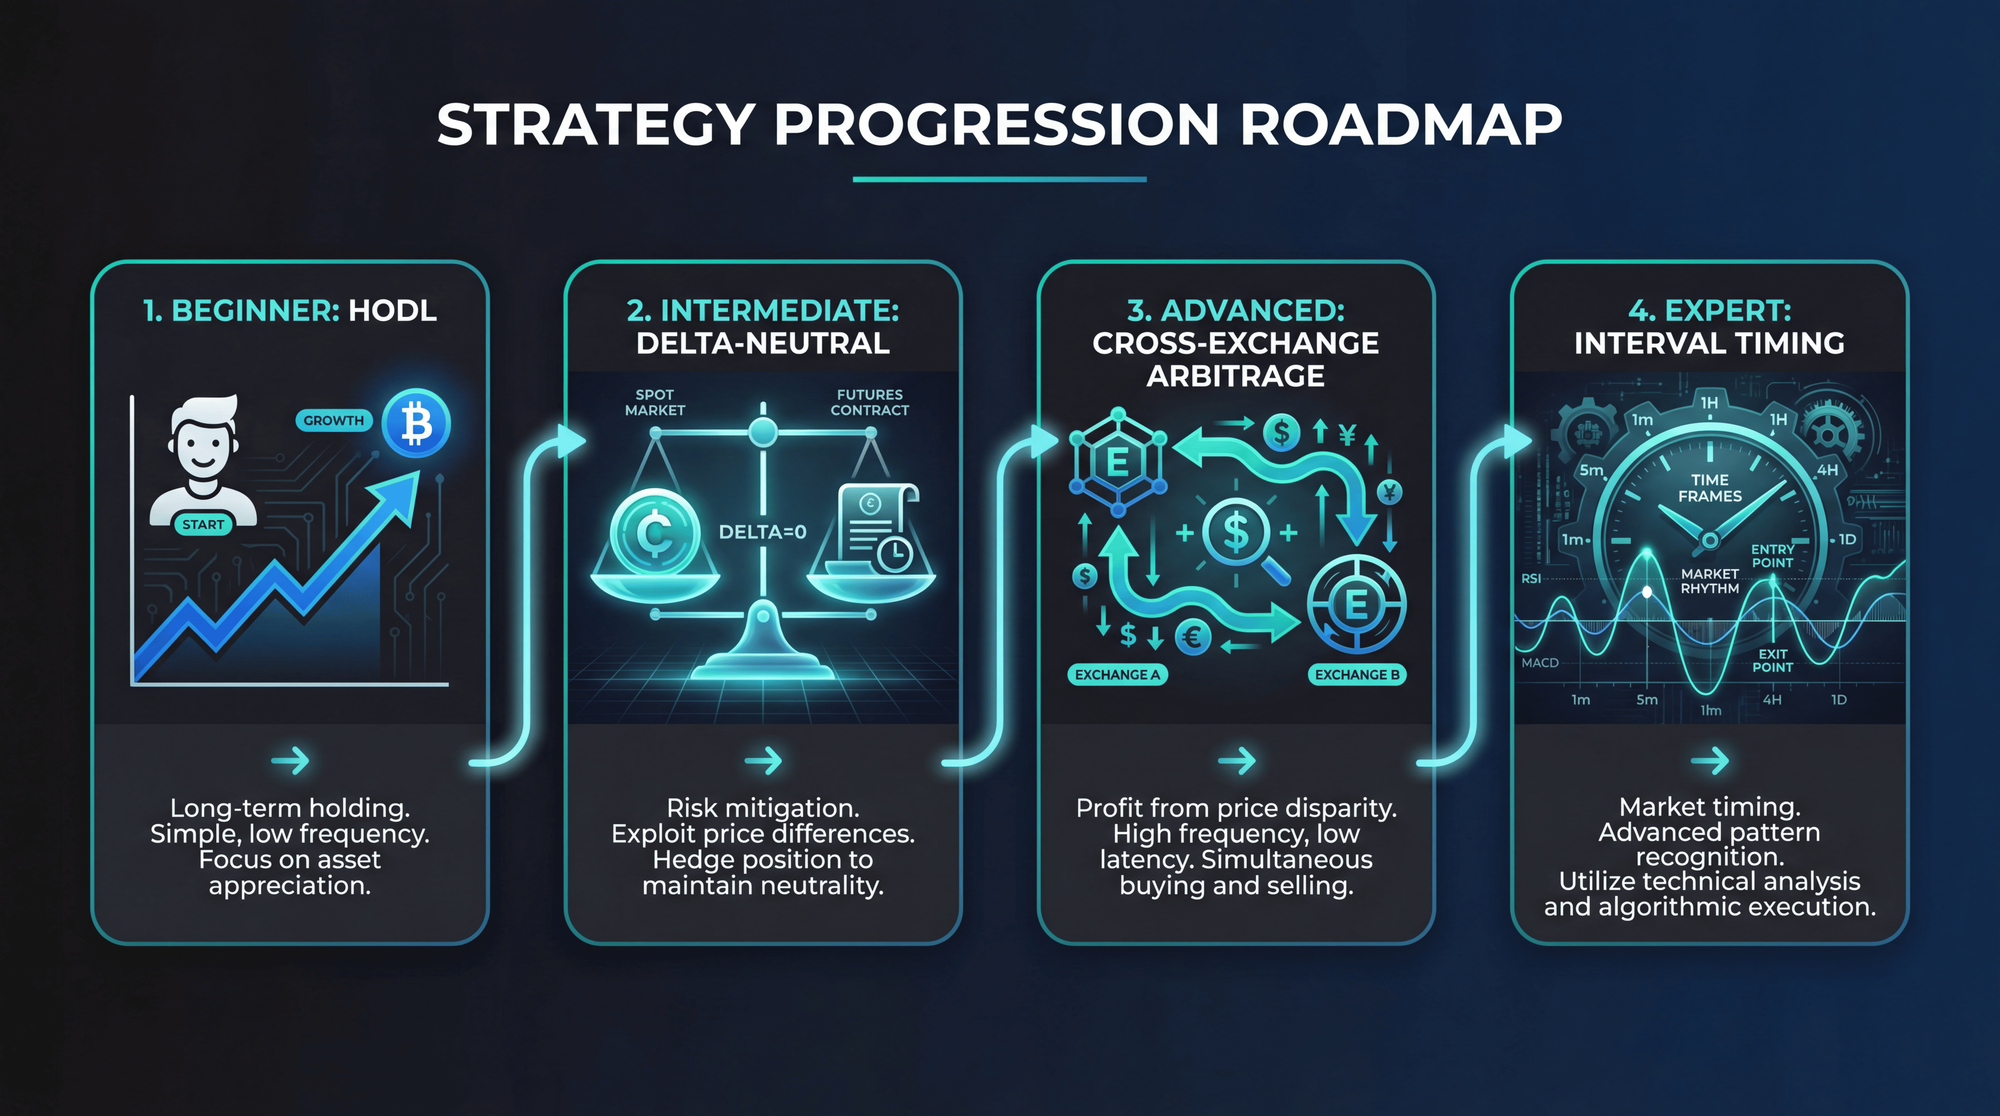
Strategy 1: Timing Entries and Exits (Beginner)
Use funding rates as a contrarian indicator for spot and futures trades.
Entry signals (consider going long):
- Funding deeply negative (below -0.05%)
- Price showing support/accumulation
- Open Interest declining (capitulation)
Exit signals (consider taking profit):
- Funding extremely positive (above 0.1%)
- CoinGlass heatmap showing sustained orange
- Open Interest at local highs
Example trade: In November 2022, funding went deeply negative during FTX collapse. Traders who recognized this as a capitulation signal and bought the $15,500 low captured 600%+ gains.
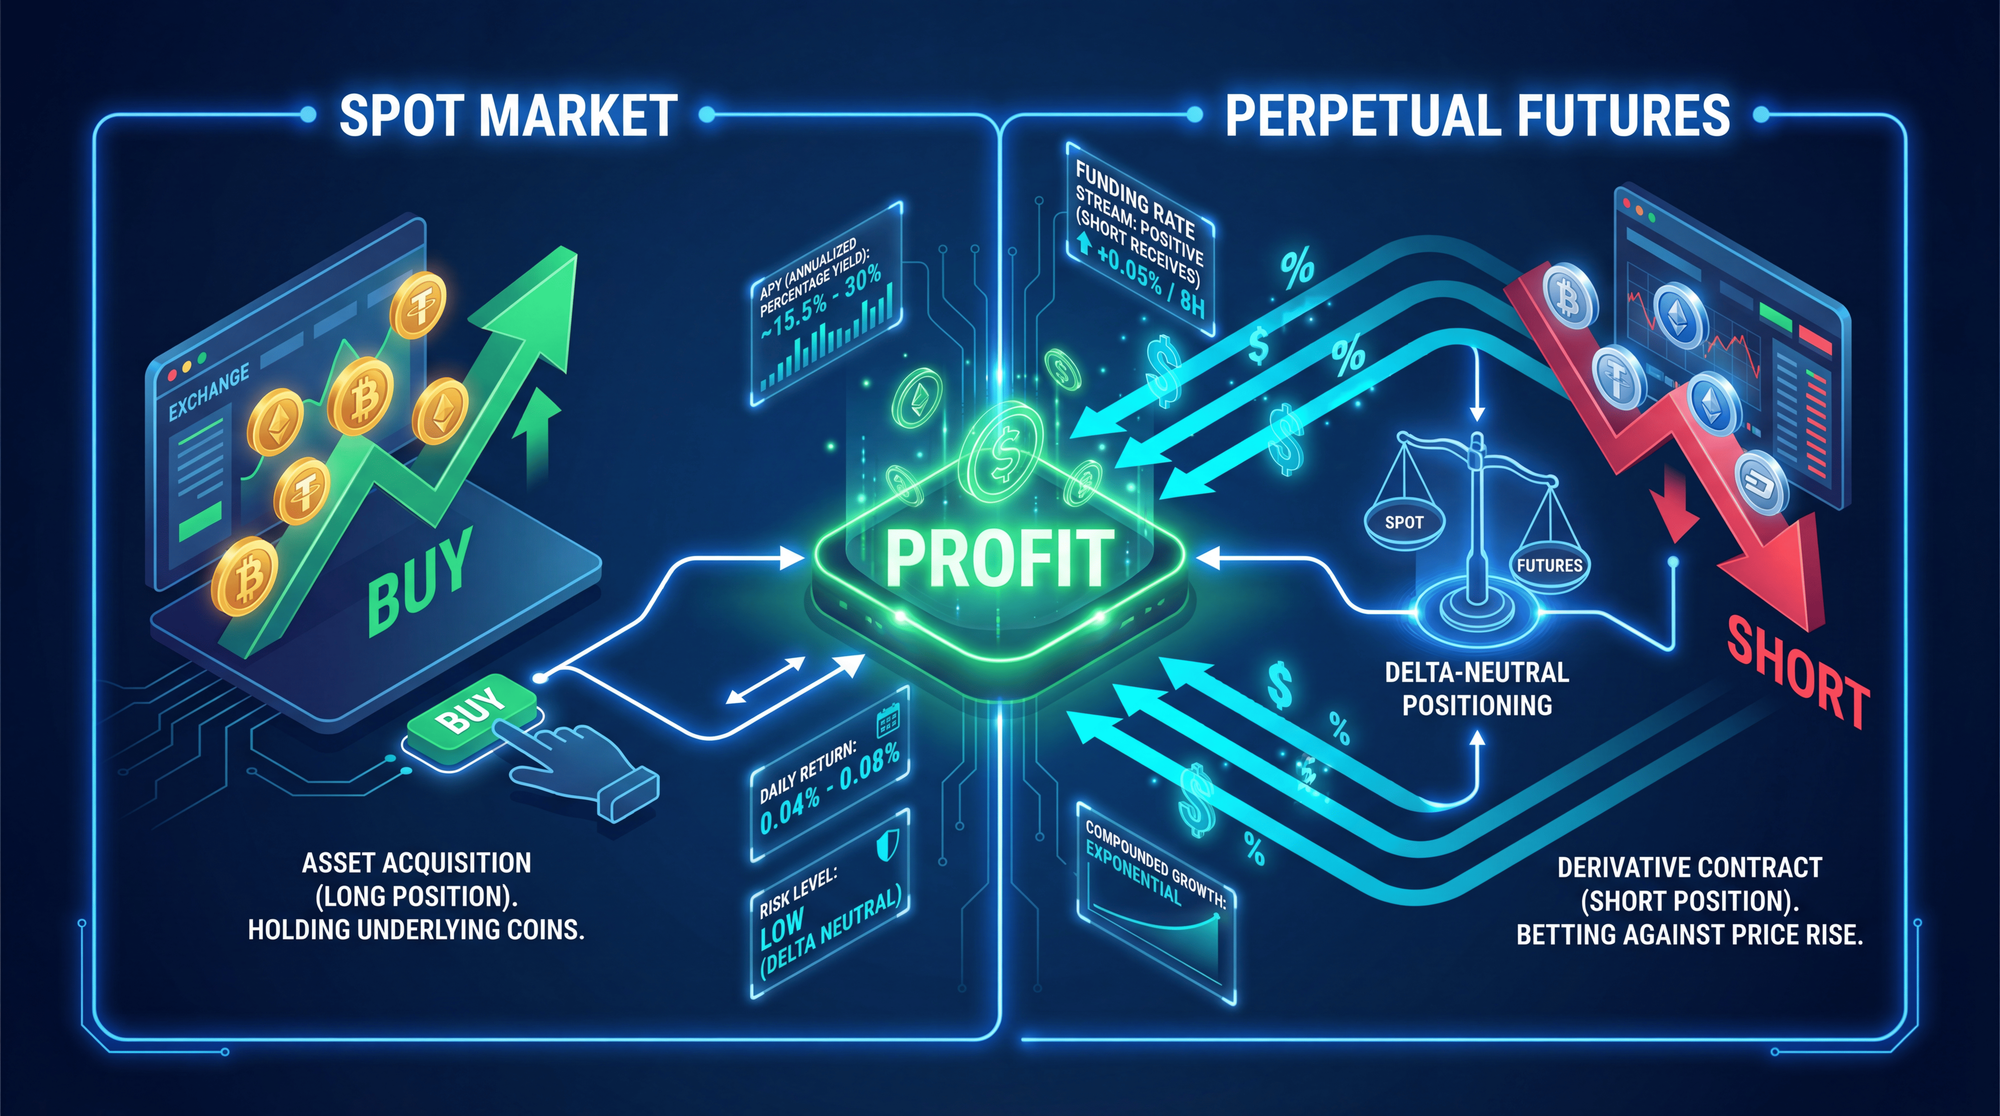
Strategy 2: Funding Rate Arbitrage - Delta-Neutral (Intermediate)
This is the most reliable funding strategy, used by professional firms managing billions. Capture funding payments while staying market-neutral.
How it works:
Buy Spot
Purchase the cryptocurrency (e.g., BTC) on the spot market.
Short Perpetuals
Open an equal-sized short position on perpetual futures.
Collect Funding
When funding is positive, you receive payments as a short holder every 8 hours.
Real Numbers (January 2026):
- Capital: $20,000
- BTC spot purchase: $10,000
- BTC perp short (1x): $10,000
- Current BTC funding: +0.51% per 8 hours
Daily funding income: $10,000 . 0.0051 . 3 = $153
Monthly: ~$4,590
Annualized: ~$55,000 (275% on half the capital)
Note: These are unusually high rates. Typical rates of 0.01-0.03% yield 15-25% annually.
2025-2026 Performance Data:
- Average annual return: 19.26% (up from 14.39% in 2024)
- Maximum drawdown: Under 2%
- Academic research shows returns up to 115.9% over 6 months possible
Strategy 3: Cross-Exchange Arbitrage (Advanced)
Exploit funding rate differences between exchanges.
How it works:
- Go long on the exchange with lower funding
- Go short on the exchange with higher funding
- Collect the spread
Example:
- Binance BTC funding: 0.02%
- Hyperliquid BTC funding: 0.08%
- Spread: 0.06% per interval
Long Binance (pay 0.02%) + Short Hyperliquid (receive 0.08%) = Net +0.06% per interval.
Research findings: Cross-exchange arbitrage adds 3-5% annualized returns, with peak opportunities exceeding 20% APR during funding divergences.
Strategy 4: Timing Around Funding Intervals (All Levels)
Simple but effective: avoid paying funding by timing your trades.
- Funding settles at: 00:00, 08:00, 16:00 UTC (most exchanges)
- If you plan to exit: Close before the funding timestamp
- If you plan to enter: Wait until just after funding settles
This saves you 3 funding payments per day on round-trip trades.
📈 Bullish Factors for Funding Arbitrage
- Market-neutral: Profits regardless of price direction
- Proven track record: 19.26% average annual returns in 2025
- Low drawdown: Under 2% max drawdown historically
- Scalable: Works from $1,000 to millions in capital
- Automation available: Binance and OKX offer built-in arbitrage bots
📉 Bearish Factors / Risks
- Funding can flip: If rates go negative, you pay instead of receiving
- Execution slippage: Opening/closing spreads eat into profits
- Exchange risk: Counterparty risk from keeping funds on exchanges
- Liquidation risk: If using leverage and price moves sharply against futures leg
- Capital lockup: Funds tied up in hedge positions can't be deployed elsewhere
Common Myths About Funding Rates
Many traders misunderstand funding rates. Let's clear up the most dangerous misconceptions:
Myth 1: "Funding Rates Are Exchange Fees"
Reality: Funding is NOT paid to exchanges-it's a peer-to-peer transfer between traders. When you pay 0.1% funding, that exact amount goes to traders on the opposite side of your position. The exchange is just the intermediary.
Why it matters: Understanding this helps you realize funding creates opportunities (collecting payments), not just costs.
Myth 2: "High Funding Always Means Price Will Crash"
Reality: High funding can persist for weeks or months during strong bull markets. In late 2020 and early 2021, funding stayed elevated for months while BTC rallied from $10K to $64K.
Why it matters: Never short solely because funding is high. The market can stay irrational longer than you can stay solvent. Use funding as ONE input among many.
Myth 3: "Funding Rates Apply to Spot Trading"
Reality: Funding rates ONLY apply to perpetual futures contracts. If you buy Bitcoin on the spot market, you never pay or receive funding. This is why spot holdings are used as the hedge in arbitrage strategies.
Why it matters: Spot traders don't need to worry about funding costs-but they should still monitor rates for sentiment signals.
Myth 4: "Funding Rates Are Predictable and Stable"
Reality: Funding rates can swing wildly during volatile markets. During the March 2020 crash, rates went from +0.01% to -0.375% within days. During euphoric rallies, rates can exceed +0.3% per 8 hours.
Why it matters: Never assume current rates will persist. Monitor predicted rates and be ready to adjust positions.
Myth 5: "Whales Can't Manipulate Funding Rates"
Reality: Large traders ("whales") can absolutely influence funding rates by taking massive positions that tilt the long/short balance. This is why you should combine funding analysis with volume, Open Interest, and whale tracking tools.
Why it matters: Don't blindly follow funding signals without considering who might be engineering them.
Common Mistakes to Avoid
Based on analysis of thousands of trades, here are the errors that hurt traders most:
Mistake 1: Ignoring Funding with Leverage
A 0.03% funding rate seems negligible. But with 20x leverage, you're paying 0.6% per 8 hours-18% of your margin per month. Many traders get liquidated not from price moves, but from accumulated funding fees.
Solution: Calculate worst-case funding costs over your expected holding period before entering leveraged positions.
Mistake 2: Holding Through Funding Spikes
During volatile markets, funding can spike to 0.3%+ per interval. Holding a losing position while also paying extreme funding accelerates your losses.
Solution: Set alerts for funding rate thresholds. Consider closing before funding timestamps during spikes and re-entering after.
Mistake 3: Not Comparing Across Exchanges
Each exchange has different rates based on their user base's positioning. What looks like a arbitrage opportunity might disappear once you account for execution costs.
Solution: Always verify rates on multiple exchanges. Use aggregators like CoinGlass for real-time comparison.
Mistake 4: Assuming Arbitrage Is Risk-Free
Funding arbitrage has risks: rate reversals, execution slippage, exchange counterparty risk, and liquidation risk if using leverage on the futures leg.
Solution: Start small, understand the mechanics, and never assume "risk-free" means zero risk.
Funding Rates vs Other Yield Strategies
How does funding rate trading compare to other crypto yield opportunities?
📊 Crypto Yield Strategy Comparison (2026)
| Strategy | Expected APY | Risk Level | Min Capital | Complexity |
|---|---|---|---|---|
| Funding Rate Arbitrage | 15-25% | Medium | $1,000 | ⭐⭐⭐ |
| Cross-Exchange Arbitrage | 20-30% | Medium-High | $5,000 | ⭐⭐⭐⭐ |
| ETH Staking | 3-5% | Low | Any | ⭐ |
| DeFi Lending (Aave) | 2-8% | Low-Medium | $500 | ⭐⭐ |
| Liquidity Provision | 5-20% | Medium-High | $1,000 | ⭐⭐⭐ |
Funding arbitrage offers a compelling middle ground: higher yields than passive staking with lower risk than directional trading. The key advantage is market-neutrality-your returns don't depend on crypto prices going up or down.
Frequently Asked Questions
What is a good funding rate in crypto?
A "neutral" funding rate is typically around 0.01% per 8-hour interval-this is the baseline interest rate most exchanges use. Rates between 0.005% and 0.03% indicate balanced markets. Rates above 0.05% signal strong bullish sentiment (expensive longs), while rates below -0.01% indicate bearish dominance (shorts paying longs). In January 2026, BTC funding averaged +0.51% (70.2% APR)-significantly above neutral, showing sustained institutional long bias.
How often are funding rates calculated and paid?
Most centralized exchanges (Binance, Bybit, OKX) settle funding every 8 hours at 00:00, 08:00, and 16:00 UTC. Binance also offers 4-hour funding on select pairs. DeFi platforms and some CEXs (Kraken, Hyperliquid, dYdX) use hourly funding intervals. Rates are calculated continuously but only settled at these timestamps-you only pay/receive if you hold a position at the exact settlement time.
Can you actually make money from funding rates?
Yes. Funding rate arbitrage is a proven strategy used by professional trading firms managing billions in capital. By simultaneously buying spot and shorting perpetuals, traders capture funding payments while remaining market-neutral. In 2025, this strategy delivered average annual returns of 19.26% with maximum drawdowns under 2%. Academic research documented returns up to 115.9% over 6-month periods.
Do funding rates apply to spot trading?
No. Funding rates only apply to perpetual futures contracts. If you buy and hold cryptocurrency on the spot market, you never pay or receive funding. This is precisely why spot purchases are used as the "hedge" in funding arbitrage strategies-your spot position offsets your futures position without generating funding costs.
What triggers extremely high funding rates?
Extreme funding rates emerge when there's massive imbalance between longs and shorts. Common triggers include: euphoric bull markets (everyone wanting to go long), panic selloffs (everyone wanting to short), major news events, and whale manipulation. During Bitcoin's January 2025 ATH of $109,450, funding reached extreme positive levels as euphoria peaked.
How do I calculate funding fees with leverage?
Funding fee = Position Size . Funding Rate. With leverage, your position size is amplified. Example: $1,000 margin with 10x leverage = $10,000 position. At 0.01% funding, you pay $1 per interval. At 0.1% funding during high volatility, you pay $10 per interval-that's $30/day or 90% of your margin per month. Always calculate worst-case funding costs before using leverage.
What's the relationship between funding rate and open interest?
Funding rate shows who's paying whom (sentiment direction). Open Interest shows how much capital is positioned (conviction/leverage in the market). Together they provide a complete picture: High positive funding + Rising OI = Strong bullish conviction with new money entering. High negative funding + Falling OI = Capitulation and potential bottom. Use both metrics together for more accurate analysis.
Can whales manipulate funding rates?
Yes. Large traders can influence funding by taking massive positions that tilt the long/short balance. A whale opening a huge long position can push funding more positive, potentially triggering retail shorts to capitulate. This is why you should never rely solely on funding rates-combine with volume analysis, Open Interest changes, and whale tracking tools for a complete picture.
What happens during extreme market volatility?
During volatility, funding rates can swing dramatically and settlement intervals may change. In March 2020, BTC funding went from +0.01% to -0.375% within days. Some exchanges temporarily adjust funding caps or switch from 8-hour to 4-hour or even 1-hour intervals. Always monitor predicted rates during volatile periods and be prepared to adjust positions quickly.
Is funding rate arbitrage risk-free?
No strategy is truly risk-free. Funding arbitrage has specific risks including: funding rate reversals (rates going negative means you pay instead of receive), execution slippage when entering/exiting, exchange counterparty risk, and potential liquidation if using leverage on the futures leg. However, compared to directional trading, the risk profile is significantly lower due to market-neutral positioning.
Conclusion
Funding rates are one of the most underutilized tools in crypto trading. Whether you use them as sentiment indicators to time entries and exits, or implement delta-neutral arbitrage strategies for steady yields, understanding this mechanism gives you an edge over 90% of retail traders.
Key insights to remember:
- Positive funding = longs pay shorts = bullish sentiment (but extreme levels signal danger)
- Negative funding = shorts pay longs = bearish sentiment (extreme levels often mark bottoms)
- Current BTC funding (January 2026): +0.51% (70.2% APR)-showing sustained institutional long bias
- Arbitrage returns: 19.26% average annual yield in 2025 with <2% max drawdown
- Always check funding before opening any perpetual position
Start here:
- Monitor funding rates on CoinGlass alongside your regular analysis
- Note correlations between extreme funding and price reversals
- Consider implementing simple timing strategies around funding intervals
- For serious capital, explore delta-neutral arbitrage using exchange-native bots
The crypto derivatives market now exceeds $100 billion in daily volume. With ETF inflows surging $840 million in January 2026 alone, institutional participation is accelerating. Traders who master funding rate analysis will be better positioned to profit-or at least avoid unnecessary costs-in this evolving market.
Ready to Trade Smarter?
Join Zipmex and access professional trading tools, competitive fees, and a platform built for serious traders.
Start Trading Now →⚠ Disclaimer: The information provided in this article is for educational purposes only and should not be construed as investment or financial advice. Funding rate arbitrage and perpetual futures trading involve significant risks including potential loss of principal. Leverage amplifies both gains and losses. Past performance does not guarantee future results. Cryptocurrency investments are subject to high market volatility. Always conduct your own research and consider consulting a qualified financial advisor before making investment decisions.
