A crypto candlestick shows four prices for one time window: the open, the high, the low and the close (OHLC). The thick part, the body, runs between the open and the close. The thin lines above and below it, called wicks or shadows, reach the highest and lowest prices traded in that window. A green candle closed above its open and a red one closed below it. That is all a single candle records. A pattern name does not tell you what price will do next.

The four prices and where they sit
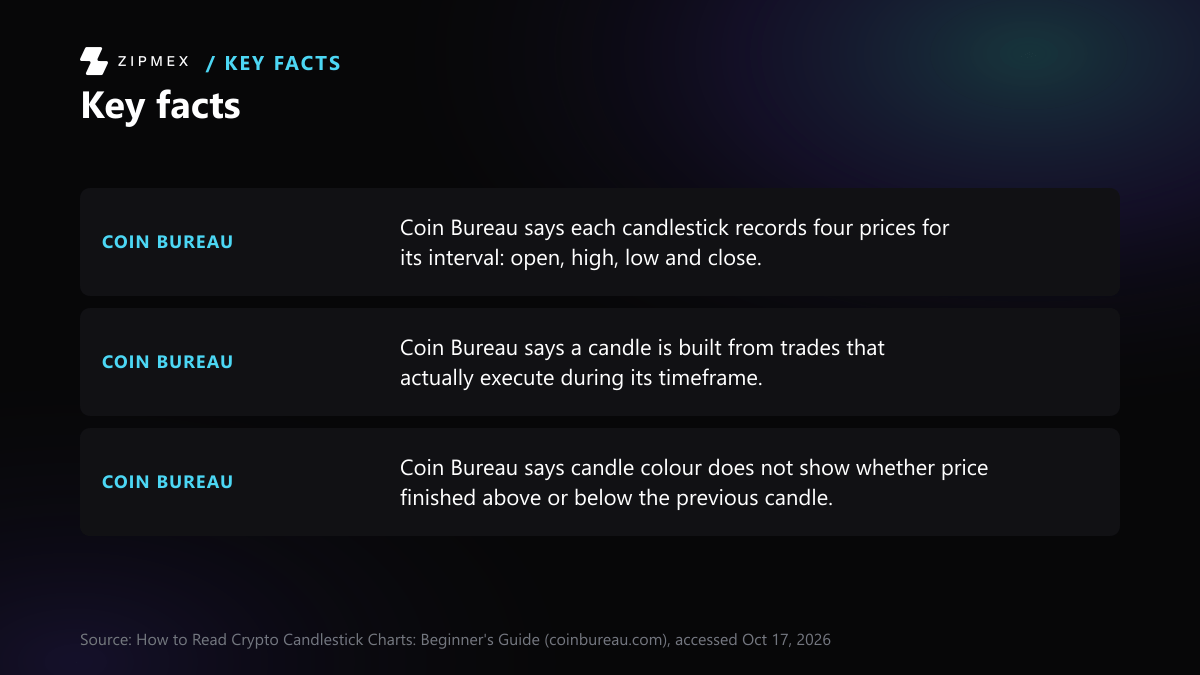
Coin Bureau's guide (updated 15 August 2026) says "each candlestick records OHLC: the open price, high price, low price and close price for that interval." Ledger Academy (published 31 August 2023, updated 14 April 2026) says the ends of the body mark the opening and closing prices. It says the thin lines mark the highest and lowest prices of the period.
- Body: from the open to the close. A taller body means a bigger gap between those two prices.
- Upper wick: from the top of the body up to the high.
- Lower wick: from the bottom of the body down to the low.
- Color: Ledger Academy says a candle is green (sometimes white) if price rose over the window, and red (sometimes black) if it fell.
A worked example
Coin Bureau uses these illustrative numbers, not market data: open $100, high $108, low $97, close $105.
- The close is above the open, so the candle is bullish (green).
- The body is $105 − $100 = $5.
- The upper wick runs from $105 to $108, which is $3.
- The lower wick runs from $100 down to $97, which is $3.
- The full range is $97 to $108, which is $11.
The wicks show that price traded above and below the body during the window, then settled at $105.
A reading order that avoids common mistakes
- Timeframe first. Find out how long one candle covers, such as 1 minute, 1 hour or 1 day. The same price action looks different on each.
- Is the candle finished? Coin Bureau says a candle that is still forming can keep changing its "color, body length, closing price, upper wick and lower wick" until its interval ends.
- Body: open and close. Its size shows how far price moved from start to finish.
- Wicks: high and low. They show how far price travelled beyond the body before it settled.
- Color last. Color compares this candle's close with its own open. Coin Bureau says it "does not tell you whether price finished above or below the previous candle." To learn that, compare the closes of the two candles.
What goes into a candle and what does not
Coin Bureau says candles are "built from executed market trades, not every buy and sell order sitting in the order book." A limit order waiting in the book "does not enter OHLC data merely because it appears in the book." A large order that never fills does not move the high, the low or the close.
Coin Bureau defines trading volume as how much trading occurred during a candle or interval. Volume usually appears as a separate bar under the chart. It is not part of the candle itself.
Before you read this candle
Which check applies to the candle you are reading?
Has the candle's time window ended?
- No, it is still forming → Wait for the window to end
- Yes, the window has ended → next question
Did trades that actually executed reach the high and low you see?
- Yes, trades reached them → next question
- No, only a waiting order is on the order book → A waiting order does not change the candle
Is this candle on a longer timeframe than the one you were watching?
- Yes, it combines smaller candles → Read it as a combined window
- No, it is the same timeframe → next question
Are you reading the color as a change from the previous candle?
- Yes → Color is not a comparison with the last candle
- No, only this candle's open and close → next question
Is a pattern name the reason you want to act?
- Yes → A pattern name is shorthand
- No, it is one input among others → Use it as one input
A candle that is still forming can change its body, color, close and wicks until its interval ends, so its shape is not final.
Source: How to Read Crypto Candlestick Charts: Beginner's Guide (coinbureau.com), accessed Oct 17, 2026An order that sits on the order book without trading does not enter the candle's open, high, low and close data.
Source: How to Read Crypto Candlestick Charts: Beginner's Guide (coinbureau.com), accessed Oct 17, 2026A higher-timeframe candle opens at the open of its first smaller candle and closes at the close of its last. A 5-minute candle combines five 1-minute candles.
Source: How to Read Crypto Candlestick Charts: Beginner's Guide (coinbureau.com), accessed Oct 17, 2026 · How to Read Candlestick Charts for Cryptocurrencies - Mycryptopedia (mycryptopedia.com), accessed Oct 17, 2026Color shows whether price rose during this candle. It does not show whether the candle finished above or below the previous candle.
Source: How To Read Crypto Candlestick Charts | Ledger (ledger.com), accessed Oct 17, 2026 · How to Read Crypto Candlestick Charts: Beginner's Guide (coinbureau.com), accessed Oct 17, 2026A pattern name is shorthand for price behavior. It is not an automatic buy or sell signal.
Source: How to Read Crypto Candlestick Charts: Beginner's Guide (coinbureau.com), accessed Oct 17, 2026Treat the candle as one input beside its volume, because no single pattern reliably predicts the next move.
Source: How to Read Crypto Candlestick Charts: Beginner's Guide (coinbureau.com), accessed Oct 17, 2026These checks explain how to read one candle; they do not show whether a pattern will be followed by a price move.
A crypto candlestick chart is a type of technical analysis tool that helps traders visualize the price action of a given asset over time.
Why the same period can look different
Higher timeframes combine smaller candles
Coin Bureau says a higher-timeframe candle takes its open from the first smaller candle in the group and its close from the last. Its high is the highest price reached anywhere in the group, and its low is the lowest. Mycryptopedia gives an example: a 5-minute chart is "a combination of five 1-minute timeframes."
A 1-hour candle with a small body can therefore hide large swings that appear on the 1-minute chart.
Different venues, different candles
Coin Bureau says "Bitcoin does not trade on one universal venue." It adds that "legitimate Bitcoin charts can print different candles for the same period." Each market records its own trades, so two charts for the same hour can have slightly different highs, lows or closes. Check which market a chart is drawn from before comparing it with another.
Where the daily candle starts
Coin Bureau's trading-hours guide (updated August 2026) says "00:00 UTC is commonly used as the boundary between daily crypto candles". It also says the spot market "does not actually close at that timestamp" and that this boundary is not guaranteed on every chart. A chart set to a local time zone can cut its daily candles at a different hour, which gives them a different open and close.
Common single-candle shapes
These are names for shapes. They are not signals.
- Doji: altFINS (updated September 2025) describes it as a candle whose open and close are nearly identical. It calls this "a hallmark of indecision."
- Hammer: altFINS describes "a small body near the top and a long lower shadow." The Defiant says it typically appears after a downtrend.
- Shooting star: altFINS describes "a small real body near the bottom and a long upper shadow", appearing after an uptrend.
What a candle cannot tell you
- Coin Bureau says patterns "should not be treated as automatic buy or sell signals" and that "no pattern reliably predicts the next move on its own."
- The Defiant says pattern data "is probabilistic and does not guarantee a specific outcome." It notes that many traders combine patterns with moving averages and volume.
- altFINS says interpreting patterns "can be subjective" and that "sudden price fluctuations in crypto markets can trigger false signals."
- Researchers Ben Marshall, Martin Young and Lawrence Rose tested 28 candlestick signals on Dow Jones Industrial Average stocks from 1992 to 2002. CXO Advisory's summary of the study says they found "neither bullish nor bearish candlestick signals reliably generate abnormal returns." That test used large U.S. stocks, so it is evidence about the method in general, not about crypto.