
The MANA price prediction picture heading into 2026 is sharply divided - algorithmic models project continued consolidation while sentiment-driven analysts point to metaverse catalysts that could reverse the trend. At the time of writing, MANA trades around $0.10, a steep distance from its 2021 peak above $5.
⚡ Key Takeaways
- Current MANA price: ~$0.10 (as of early 2026)
- 2026 forecast range: $0.08-$0.14 (base case), up to $0.18 (bullish scenario)
- 2030 bullish scenario: $0.40-$1.00+ if metaverse adoption accelerates significantly
- Key catalyst: Virtual land transaction growth, Ethereum network improvements, institutional virtual real estate entry
- Main risk: Competitive pressure from The Sandbox and Big Tech metaverse platforms, plus ongoing regulatory uncertainty around digital assets
Before diving into year-by-year projections, understanding what actually drives MANA's value is essential - because price prediction without fundamentals is just noise.
What Is MANA and How Does Decentraland Work?
Decentraland is an Ethereum-based virtual world where users genuinely own the terrain they build on. That distinction matters. Unlike centralized gaming metaverses where the company can revoke your assets at any time, ownership in Decentraland is enforced by smart contracts - immutable, transparent, and not subject to platform policy changes.
MANA is the native ERC-20 utility and governance token powering everything inside that ecosystem. It's fungible, transferable, and sits at the center of every major economic interaction on the platform - from buying parcels of virtual land to voting on platform upgrades via the DAO.
The dual-token model creates an interesting dynamic: MANA is burned every time a LAND parcel is purchased. That deflationary mechanic is often glossed over in competitor analyses, but it's a genuine tokenomics lever - sustained demand for virtual real estate directly reduces MANA supply.
MANA Token Utility: What Powers Its Value?
MANA's value isn't hypothetical - it maps to four specific on-chain functions:
- LAND acquisition: Every parcel in Decentraland is purchased with MANA, triggering the token burn mechanism on settlement.
- Marketplace transactions: Wearables, avatar accessories, and in-world assets are bought and sold in MANA across the Decentraland Marketplace.
- DAO governance: MANA holders vote on development proposals, grant funding, and platform rule changes. Staking MANA amplifies governance weight.
- In-world economic activity: Events, venue rentals, content monetization, and virtual services are all denominated in MANA.
The burning mechanism is worth emphasizing: it's not inflationary rewards driving demand - it's genuine platform utility. That's a structurally different investment thesis than yield-farming tokens that dilute holders over time. Understanding what tokens are and how they derive value is key to evaluating MANA's long-term investment case.
Decentraland vs. The Sandbox vs. Otherside: Positioning MANA in the Metaverse
MANA doesn't operate in isolation. Three platforms currently dominate the metaverse token space, each with distinct positioning:
Decentraland holds clear advantages in governance decentralization and established infrastructure. For investors, this competitive positioning is actually clarifying: MANA is less of a high-growth speculative play and more of a foundational metaverse infrastructure bet - slower accumulation, lower speculative premium, but deeper structural legitimacy.

MANA Price History: Key Cycles and What They Reveal
MANA's price history reads like a compressed version of the broader crypto cycle, amplified. The token traded below $0.10 through most of 2020, barely registering on most radar screens. Then the metaverse narrative detonated.
From September to November 2021, MANA surged from around $0.80 to an all-time high near $5.90 - a roughly 7x move in under two months. Facebook's rebrand to Meta acted as an ignition catalyst, flooding search engines with "metaverse" queries and driving speculative capital directly into Decentraland and The Sandbox. The RSI hit extreme overbought territory (above 85 on the daily), a signal that typically precedes sharp reversals.
The 2022 bear market was brutal for MANA specifically. While Bitcoin declined roughly 75% from its ATH, MANA shed over 97% - dropping to around $0.30 at the lows. That amplification effect is a consistent pattern: MANA typically exhibits volatility approximately 30% higher than Ethereum, which itself is more volatile than Bitcoin. Understanding how BTC dominance shifts capital between Bitcoin and altcoins explains why MANA drawdowns tend to overshoot the broad market.
The 2023-2026 period brought consolidation rather than recovery. Bitcoin staged a meaningful recovery driven by ETF approval news, Ethereum tracked closely, but MANA lagged. The metaverse narrative faded from mainstream financial media. This divergence from the broader crypto recovery is worth noting - it suggests MANA needs its own catalyst (not just a BTC bull run) to break out significantly.
MANA PRICE CYCLE TIMELINE
2020
MANA trades below $0.10. Metaverse narrative non-existent. Low-volume accumulation phase.
Sep-Nov 2021
ATH ~$5.90. Facebook Meta rebrand triggers metaverse narrative surge. RSI reaches extreme overbought (85+).
2022 Bear Market
MANA declines over 97% from ATH to lows near $0.30. Amplified drawdown vs. BTC (-75%) confirms high-beta profile.
2023-2024
BTC recovery on ETF approvals. MANA lags - metaverse narrative fade reduces sector tailwind. Consolidation range.
Early 2026
Current price ~$0.10. 200-day SMA ~$0.22 - structural downtrend still in effect. Bitcoin halving cycle effects working through market.
That historical context shapes the technical picture today. The 200-day SMA has functioned as a reliable psychological support level through multiple cycles, and the 14-day RSI frequently signaled extreme overbought conditions at the peak of metaverse sentiment. Knowing these patterns doesn't predict the future - but it frames the probability distribution intelligently.
MANA Price Prediction 2026-2030: Year-by-Year Forecast
The MANA price prediction for the next four years spans a wide range depending on which assumptions materialize. The table below synthesizes algorithmic models and analyst consensus to present a structured forecast:
⚠ Risk Disclaimer
- All figures are probabilistic estimates → not financial advice
- Crypto trading involves substantial risk of loss → past performance does not guarantee future results
- Forecasts diverge significantly → always cross-reference multiple models before making decisions
MANA Price Prediction 2026
The 2026 outlook for MANA is cautiously optimistic, primarily anchored to the lagging effects of the 2024 Bitcoin halving. Historically, BTC halvings generate price expansion cycles that typically peak 12-18 months post-event. If that pattern holds, conditions into mid-2026 could see meaningful broad crypto appreciation that carries MANA higher.
Critical technical levels to watch: the 50-day SMA (short-term momentum gauge) and 200-day SMA (structural support). MANA trading consistently above the 200-day SMA would signal a genuine trend reversal rather than a temporary bounce.
MANA Price Prediction 2027-2028
The 2027-2028 window is where the structural investment thesis either validates or fails. Two major developments could define this period: Layer-2 scaling deployment on Decentraland and the trajectory of consumer VR/AR hardware adoption.
One metric worth watching closely in this period: token velocity. Token velocity measures how frequently MANA changes hands within the ecosystem. Lower velocity indicates holders are accumulating for utility or long-term positioning rather than speculative flipping - a historically bullish structural signal. If Decentraland's active economy deepens (more in-world transactions, higher venue utilization), token velocity should decline even as price rises, which indicates organic demand rather than speculative inflation.
MANA Price Prediction 2030 and Beyond
Can MANA reach $1 by 2030? The honest answer: possible, but requiring a specific alignment of conditions.
Algorithmic models project continued price decline into the late 2020s based on current adoption curves, while sentiment-based models point to a 25-65% probability of reaching $1 if specific growth thresholds are met. A $1 MANA by 2030 requires approximately 10x appreciation from current levels - the kind of platform-level breakout that hasn't materialized yet.

Technical Analysis of MANA: Indicators and Price Signals
Technical analysis on MANA is valuable precisely because the token trades with high volatility and clear pattern repetition across cycles. For a deeper look at how these indicators fit into macro cycle positioning, the Bitcoin rainbow chart guide offers useful context on pairing RSI and MACD with long-term cycle frameworks. Here's the current indicator picture:
Indicator readings at time of publication - verify current levels before making any trading decisions. Crypto trading involves substantial risk of loss.
Key Support and Resistance Levels for MANA
Applying Fibonacci retracement from MANA's ATH (~$5.90) to recent lows (~$0.08) gives clear probabilistic recovery targets. For deeper on-chain context on how to read exchange flows and accumulation patterns alongside these levels, on-chain analytics for crypto trading provides a comprehensive framework.
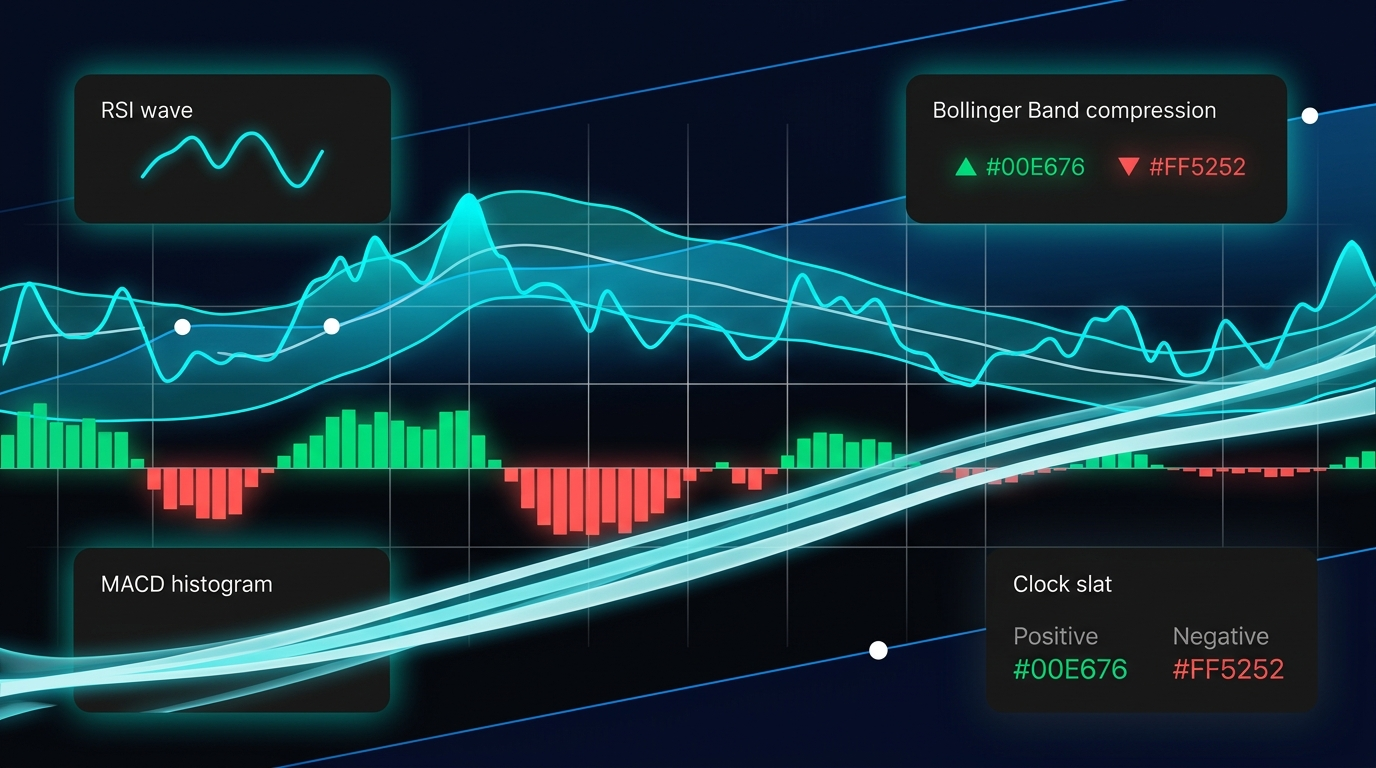
Bollinger Bands, MACD, and Volatility Signals
Bollinger Band compression on MANA currently signals an incoming volatility event. When the upper and lower bands squeeze toward the middle, the market is coiling - these compressions resolve in significant moves. The challenge is direction: the MACD histogram and price position below both major SMAs suggest bearish pressure remains dominant.
MACD analysis adds nuance here. A MACD crossover - where the MACD line crosses above the signal line - combined with RSI moving above 50 would constitute a multi-indicator confluence signal, significantly stronger than either indicator alone. MANA's high volatility (historically ~30% above Ethereum) amplifies these signals in both directions. A genuine bull signal on MACD with an RSI breakout above 50 historically precedes moves of 40-80% within 30-60 days. A false break, conversely, can mean a sharp reversal - which is why multi-indicator confirmation is non-negotiable before sizing into positions.
Fundamental Drivers: What Could Push MANA Higher
Beyond price charts, MANA's long-term trajectory depends on real-world platform fundamentals. The platform utility model means these on-chain metrics are the actual valuation inputs - not cash flows, not dividends. To understand how MANA fits into the broader NFT and virtual real estate ecosystem, the NFT marketplace guide provides context on the infrastructure LAND tokens operate within.
5 Bullish Catalysts for MANA in 2026-2030:
- User adoption growth: DappRadar tracks active daily users - sustained growth above current baselines would directly signal a strengthening platform economy
- Genesis City expansion: New virtual land zones increase MANA burn events (each LAND purchase destroys MANA) and attract new investors to the ecosystem
- Mobile accessibility improvements: The Decentraland DAO recently approved mobile platform funding - removing the hardware barrier could unlock a new user cohort
- Institutional virtual real estate: Corporate brand presence and virtual venue investments create recurring MANA transaction volume and mainstream media attention
- Ethereum network improvements: Reduced gas fees from Layer-2 integrations directly lower the friction cost of every MANA transaction
Risk Factors: What Could Suppress MANA's Price
No investment comes without risk - here's what MANA investors should monitor:
Is MANA a Good Investment? Evaluating Risk vs. Reward
How MANA fits into your portfolio depends heavily on your investment horizon and risk tolerance. There's no single answer - but three distinct investor profiles exist for whom MANA has different relevance:
One hard principle applies to all three: never allocate more than you're prepared to lose entirely. MANA has demonstrated the capacity for 90%+ drawdowns from peak levels. That's not a warning to avoid it - it's context for sizing correctly.
Crypto trading involves substantial risk of loss. Nothing in this article constitutes financial advice. Always consult a qualified financial professional before making investment decisions.
How to Buy MANA: Step-by-Step Guide for Beginners
Once you've decided MANA fits your investment strategy, the process is straightforward. The key point most guides miss: exchange-held MANA cannot interact with Decentraland directly - you need a self-custody wallet.
- Choose a regulated exchange - Popular options include Binance, Coinbase, and Kraken. All list MANA/USDT pairs. Verify the platform complies with regulations in your jurisdiction before registering.
- Create and complete KYC verification - Most regulated exchanges require identity verification. This typically takes 24-48 hours. Avoid unverified platforms - they carry significantly higher counterparty risk.
- Deposit funds - Bank transfers (ACH, SEPA, SWIFT) typically carry lower fees than card deposits, which often range from 1.5-3.5%. Bank transfers are slower but more cost-effective for larger amounts.
- Purchase MANA and transfer to a self-custody wallet - MetaMask is the most widely compatible self-custody wallet for Decentraland. Connect it to the platform, and your private keys - and your assets - stay under your control.
Self-custody is the on-chain-native approach. When you hold MANA in your own wallet, no exchange insolvency or platform policy change affects your assets. That principle - true ownership through self-custody - is what differentiates genuine DeFi participation from simply holding a balance on a third-party platform.
MANA Price Prediction Methods: How Forecasts Are Built
Understanding how MANA price predictions are made helps you evaluate conflicting forecasts with confidence - because forecasts diverge not because analysts disagree on facts, but because they weight different inputs differently.
The most reliable approach combines all four: use technical analysis for entry and exit timing, fundamental analysis for position conviction, algorithmic models for probabilistic range-setting, and sentiment analysis as a contrarian signal. Any single-method forecast deserves appropriate skepticism.
Conclusion: MANA Outlook and Who Should Consider It
The MANA price prediction for 2026 points to a trading range of approximately $0.07-$0.18 under most scenarios, with the upper end requiring a combination of BTC halving cycle tailwinds and Decentraland-specific platform catalysts. By 2030, the range widens dramatically - from under $0.10 in the bearish case to over $1.00 in the high-adoption bull scenario.
Three signals to monitor as the clearest leading indicators of MANA's actual trajectory:
- Platform adoption metrics - Monthly active users and virtual land transaction volume tracked via DappRadar. Sustained growth above current baselines is the most reliable leading indicator.
- Ethereum/BTC market cycle positioning - MANA reliably amplifies broad crypto moves. Tracking Bitcoin's cycle relative to its halving and the 200-week SMA frames the macro risk environment.
- Regulatory developments - Any legislation that classifies MANA as a security would be a significant headwind regardless of platform fundamentals.
Platforms built on self-custody principles and on-chain verifiability represent the direction serious DeFi infrastructure is heading - Decentraland's DAO governance model and transparent smart contract mechanics put it closer to that standard than most competitors. Whether that structural quality translates into price appreciation depends on adoption timing. The fundamentals are real. The timing is genuinely uncertain.
Crypto trading involves substantial risk of loss. Nothing in this article constitutes financial or investment advice. Always do your own research and consult a qualified financial professional before making investment decisions.
Last updated: April 2026.
Frequently Asked Questions
What is the MANA price prediction for 2026?
Most forecasts for 2026 place MANA in a range between $0.07 and $0.18 depending on which scenario materializes. The base case - moderate crypto market recovery tied to Bitcoin halving cycle effects and stable Decentraland platform metrics - points to an average around $0.09-$0.12. The bullish case, requiring Genesis City expansion milestones and measurable daily active user growth, could push toward $0.15-$0.18. Treat any specific figure as a probabilistic range, not a target. Crypto trading involves substantial risk of loss.
Can MANA reach $1?
Yes - but it requires a specific combination of conditions. A $1 MANA represents roughly 10x appreciation from current levels, demanding sustained growth to over 2 million daily active users, institutional virtual real estate activity, favorable crypto market conditions, and a metaverse narrative resurgence. Probability estimates range from 20% to 65% depending on the model and time horizon. The most credible path runs through the 2028-2030 window if VR/AR hardware penetration drives mainstream metaverse engagement.
What is MANA and what is it used for?
MANA is the native ERC-20 utility and governance token of Decentraland, an Ethereum-based virtual world. It serves four core functions: purchasing LAND parcels (triggering a burn mechanism that permanently removes MANA from supply), buying assets in the Decentraland Marketplace, voting in DAO governance proposals, and participating in in-world economic activity including events and virtual services. The token burn mechanic creates deflationary pressure - each LAND purchase reduces circulating supply, linking platform demand directly to token economics.
What are the biggest risks of investing in MANA?
Four primary risks define the MANA investment case. Regulatory uncertainty - any classification of MANA as a security could restrict exchange listings globally and collapse liquidity. Competitive pressure from better-funded platforms (The Sandbox, Big Tech initiatives) could fragment Decentraland's user base. Blockchain scalability limitations currently constrain the platform's user experience. Finally, MANA's high correlation with Bitcoin means any broad crypto market downturn hits MANA disproportionately hard given its amplified volatility profile - historically around 30% higher than Ethereum.
What technical indicators should I watch for MANA?
The most actionable indicators for MANA are RSI (14-day), MACD, Bollinger Bands, and the 50-day and 200-day SMAs. RSI below 30 has historically coincided with short-term bounce zones; above 80 preceded the 2021 ATH and subsequent crash. The 200-day SMA acts as a key structural support/resistance level - reclaiming it signals trend reversal. Bollinger Band compression precedes volatility events. MACD crossover combined with RSI above 50 is the strongest multi-indicator confluence signal for MANA. Always verify current readings before making any trading decisions.
How does Bitcoin halving affect MANA?
Bitcoin halvings historically catalyze broad crypto bull markets that typically peak 12-18 months post-event. MANA, as a high-beta altcoin, amplifies these cycle effects. The 2020 halving contributed to conditions that led to MANA's 2021 all-time high of approximately $5.90. The 2024 halving's effects are still working through the market as of this writing. However, the relationship isn't mechanical - MANA also requires its own fundamental catalyst to outperform the broader altcoin cohort. BTC halving provides the macro tailwind; Decentraland platform development determines whether MANA catches that wind.
Is MANA better as a short-term trade or a long-term hold?
Both approaches have merit but demand different frameworks. As a short-term trade, MANA's high volatility and clear technical patterns - strong RSI extremes, Bollinger Band compressions, key Fibonacci levels - create exploitable setups for traders with defined risk management and strict stop-losses. As a long-term hold, the investment case rests on the virtual economy thesis and deflationary tokenomics - but requires tolerance for multi-year drawdowns of 80-90%+ and strong conviction in Decentraland maintaining platform relevance. Short-term trading requires technical discipline; long-term holding requires fundamental conviction and appropriate position sizing.
