
The OGN price prediction question gets asked a lot - and for good reason. Origin Protocol sits at the intersection of DeFi, NFT infrastructure, and on-chain commerce, yet its token has shed over 97% from its all-time high. Whether that makes OGN a compelling opportunity or a cautionary tale depends entirely on how you read the data.
This guide cuts through the noise: short-term technical signals, year-by-year forecasts through 2030, a comparison of analyst models, and the trading strategies best suited to OGN's current market structure.
⚡ Key Takeaways
- Current price: ~$0.021 (as of March 2026)
- 2026 forecast range: $0.016 - $0.062 (bearish to optimistic models)
- 2027-2029 outlook: $0.015 - $0.19 depending on market cycle
- 2030 target: $0.006 (bear case) → $2.00 (bull case)
- Current technical signal: Bearish - RSI neutral, both SMAs declining, Fear & Greed at Extreme Fear
Last updated: March 2026.
What Is Origin Protocol (OGN)? A Foundation for Price Analysis
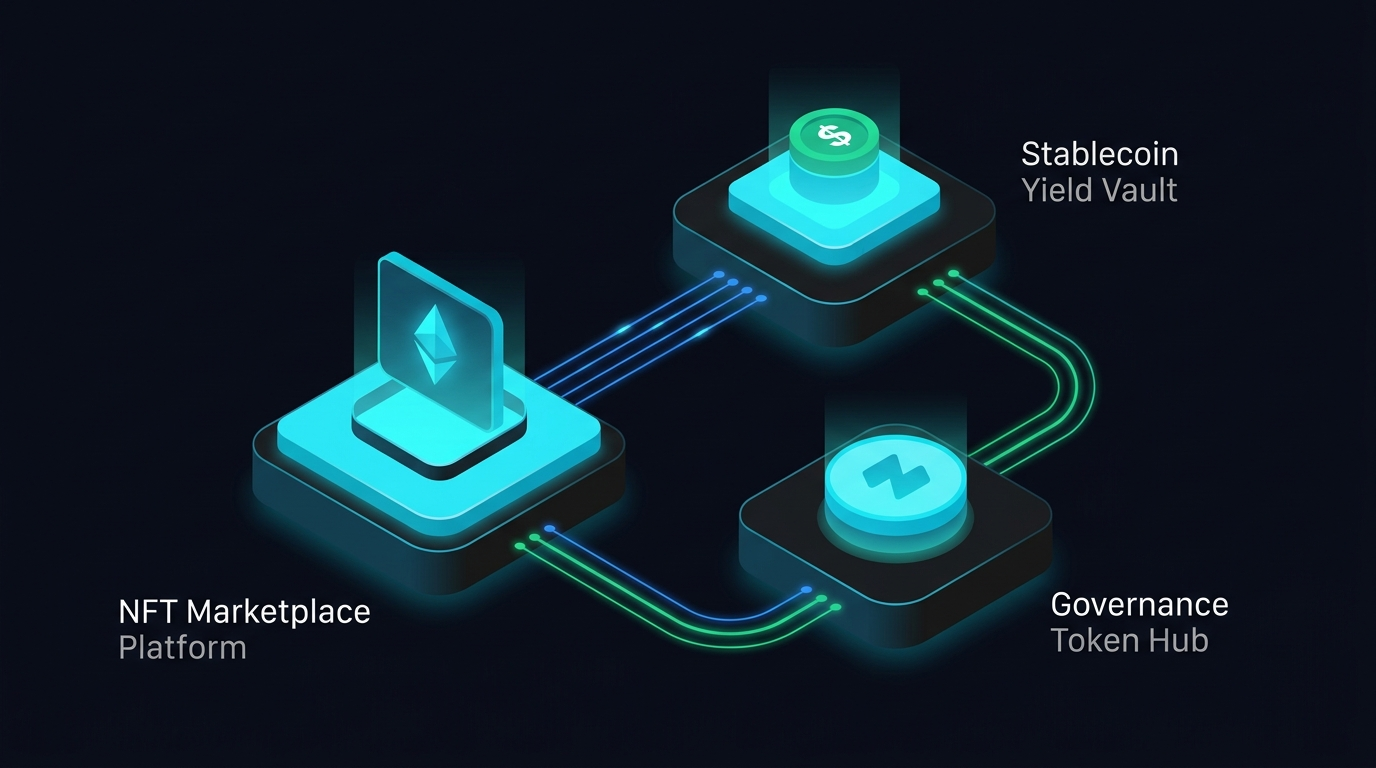
Origin Protocol is a decentralized commerce layer built on Ethereum. The project gives creators and businesses the infrastructure to launch NFT marketplaces and on-chain e-commerce applications - without relying on centralized intermediaries. Two flagship products define the ecosystem: Origin Story, a customisable NFT marketplace platform, and Origin Dollar (OUSD), a yield-bearing stablecoin that generates returns from DeFi protocols automatically.
OGN is the native utility and governance token that ties this ecosystem together. Token holders vote on protocol parameters, participate in fee distribution, and benefit from a buyback-and-burn mechanism that the Origin DAO voted to expand in mid-2025 - doubling weekly buybacks to approximately $200,000 per week. That's a meaningful deflationary force at OGN's current market cap, and it's the kind of on-chain, verifiable mechanic that distinguishes genuine protocol value from speculative noise. You can verify every buyback transaction directly on Etherscan.
Understanding what OGN actually does is the prerequisite for reading any price forecast with clear eyes. If you're newer to DeFi concepts, our introduction to decentralized finance covers the foundational mechanics. A token with real governance utility and a funded buyback program is structurally different from one that relies purely on market sentiment.
OGN Tokenomics and Market Data
The distance from ATH is a double-edged figure. It signals how severely OGN has been repriced since the 2022 NFT cycle peak - but it also defines the scale of recovery required to reach historical levels. Any OGN analysis that ignores this context is incomplete. For broader altcoin context, see our Bitcoin price prediction overview which frames how macro cycles affect the entire market.
OGN Price Prediction 2026: Short-Term Outlook
The OGN price prediction for 2026 splits sharply depending on the model. Algorithmic forecasts anchored to recent price history lean bearish: CoinCodex's model projects OGN ending 2026 near $0.017, with a mid-year low possible around $0.015. On the other side, fundamental-leaning analysts at Coinpedia see a path to $0.050-$0.060 if OGN can reclaim the $0.030 resistance and sustain momentum.
The current technical structure supports neither a sharp rally nor a collapse. OGN is range-bound - consolidating between $0.018 and $0.025 with low volatility and weak volume.
The gap between these projections isn't a data error - it reflects genuinely different methodologies. Algorithmic models weight recent price action heavily; fundamental models weight adoption metrics, buyback velocity, and broader altcoin cycle positioning. Both are legitimate frameworks.
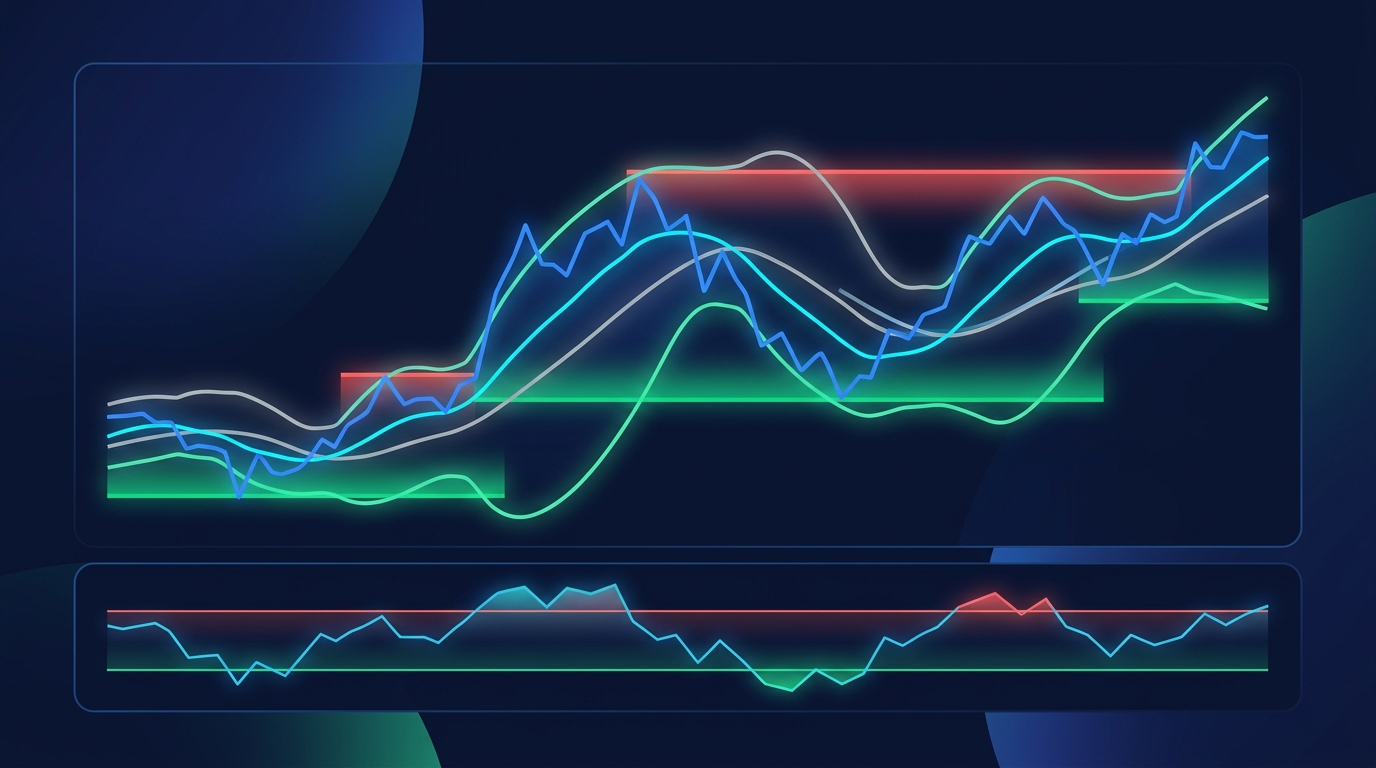
OGN Technical Analysis 2026: Key Indicators
The current technical picture is mixed, skewing cautious. Here's the live signal dashboard based on data from CoinCodex:
The 50-Day and 200-Day SMAs are both declining and positioned above the current price - a classic bearish alignment. RSI at 46.78 sits in neutral territory, which means there's no oversold bounce signal yet. MACD shows a negative crossover, confirming the absence of upward momentum.
Bollinger Bands are narrowing significantly, which typically precedes a volatility expansion. A weekly close above $0.028 with volume would be the first credible bullish signal; a break below $0.018 support opens the door to a retest of $0.015.
OGN Price Prediction 2027-2029: Mid-Term Forecast
Mid-term OGN price prediction requires a different analytical lens. Beyond 12 months, pure technical analysis loses precision - the dominant variables shift to macroeconomic crypto cycles, DeFi adoption metrics, and Origin Protocol's competitive position within the NFT infrastructure space. For a comparable altcoin mid-term analysis, see our XRP price prediction 2026-2030 which applies the same cycle-based framework.
2026: The range of forecasts is wide. CoinCodex's algorithm projects OGN trading between $0.015 and $0.021 for most of 2027. More optimistic models see $0.067-$0.11, contingent on a broader altcoin recovery and Origin Story gaining meaningful NFT platform market share. For context on the NFT marketplace competitive landscape, our top NFT marketplaces guide covers the platforms Origin Story competes against directly. The honest answer: 2027 is heavily Bitcoin-dependent. If BTC consolidates post-halving gains through 2027, OGN will likely follow.
2028: This is where the next Bitcoin halving cycle (expected 2028) begins to matter structurally. Post-halving altcoin seasons have historically driven aggressive repricing of small-to-mid cap tokens. OGN's low market cap - under $15M currently - means even modest capital rotation could translate to outsized price moves. Forecasts for 2028 range from $0.095 (conservative) to $0.18 (optimistic), with the $0.10 level acting as a psychological and technical target for the first meaningful recovery.
2029: If the 2028 altcoin cycle plays out, 2029 could see OGN testing the $0.13-$0.19 range. The bear scenario puts OGN still below $0.10. The key variable: whether Origin Protocol's real-world adoption - measured in NFT marketplace volume, OUSD TVL, and DeFi integrations - grows meaningfully in this period.
OGN Price Prediction 2030 and Beyond: Long-Term Vision
The 2030 OGN price prediction debate is where analyst consensus breaks down entirely. The spread between bearish and bullish forecasts is not a rounding error - it's an order of magnitude.
CoinCodex's algorithm, extrapolating from current bearish momentum, projects OGN ending 2030 near $0.006-$0.008. On the opposite end, Coinpedia's bull case targets $0.80-$2.00 by 2030 if DeFi commerce adoption accelerates and OGN captures a meaningful share of on-chain NFT infrastructure.
✕ BEAR CASE 2030
$0.005-$0.010
Protocol relevance fades. NFT sector contracts. Origin Story fails to capture meaningful marketplace volume. Buyback program insufficient to offset selling pressure.
⚠ BASE CASE 2030
$0.08-$0.25
Steady DeFi growth. Origin maintains niche position. 2028 halving cycle plays out with moderate altcoin season. OUSD TVL grows incrementally.
✓ BULL CASE 2030
$0.80-$2.00
NFT infrastructure boom. Significant OUSD TVL expansion. OGN buybacks drive supply scarcity. Broader crypto market surpasses prior cycle highs.
Looking further out: by 2040, optimistic models project $3.00-$6.50, contingent on blockchain infrastructure becoming foundational to digital commerce. These figures carry enormous uncertainty. What's more useful than a specific price is understanding the conditions that would need to exist for each scenario - then monitoring whether those conditions are developing through verifiable on-chain metrics.
Is OGN a Good Investment? Risks and Opportunities
This is the question behind every price prediction search. The honest answer: it depends on your risk tolerance, time horizon, and how you size the position.
⚠ Key Risks of Investing in OGN
- Volatility risk → 10.37% monthly means 15-25% weekly swings are possible even in consolidation
- Trend risk → Both SMAs point down; catching a falling knife without reversal signal is speculative
- Regulatory overhang → DeFi tokens remain in a grey regulatory zone globally
- Competitive pressure → NFT marketplace space has consolidated aggressively around dominant players
- Liquidity risk → Daily volume under $3M makes large positions difficult to exit cleanly
Crypto trading involves substantial risk of loss. Nothing in this analysis constitutes financial advice - position sizing, entry points, and risk management decisions are yours to make based on your own circumstances.
How to Buy OGN: Getting Started with Origin Protocol
OGN trades on several major platforms. The most liquid pairs are OGN/USDT and OGN/BTC, available on MEXC, Binance, and Kraken.
- Choose a platform - MEXC, Binance, and Kraken all list OGN with reasonable liquidity. Spot trading fees typically range 0.1%-0.2% depending on your tier.
- Complete account setup and KYC - identity verification is mandatory on regulated platforms. Allow 24-48 hours for approval if you're a new user.
- Fund your account - deposit fiat (USD, EUR) or transfer USDT from an existing wallet. For USDT deposits, confirm the network (TRC-20 vs ERC-20) to avoid fund loss.
- Place your OGN order - use a limit order rather than a market order. A market order on a low-volume day can result in significant slippage on a token with OGN's liquidity profile.
- Withdraw to self-custody - if you're holding for weeks or months, move OGN to a non-custodial wallet (MetaMask, Ledger). Don't leave meaningful positions on any exchange.
One practical note on entry strategy: given OGN's consolidation range ($0.018-$0.025), a dollar-cost averaging approach - buying fixed amounts at regular intervals - reduces the risk of timing a single entry at the wrong point in the range.
OGN Trading Strategies: Maximizing Your Investment Potential
OGN's current market structure - low volatility, tight range, clear support and resistance - creates a more defined strategic framework than you'd see in a trending market.
HODL: Buy near support ($0.018-$0.020), set a stop-loss below $0.016, hold through the 2028 halving cycle. The thesis: OGN has sufficient protocol utility to survive until the next major altcoin season.
Swing Trading: Buy when RSI dips below 35 near the $0.018 support band, target the $0.024-$0.025 resistance zone. Wait for a positive MACD crossover before initiating. Stop-loss below $0.018.
DCA: Buy a fixed dollar amount weekly or bi-weekly over a 3-6 month accumulation window. With Bollinger Bands compressed as they are now, DCA makes particular sense - you accumulate ahead of the inevitable volatility expansion without betting on its direction.
Day Trading: Honest assessment - OGN's sub-$3M daily volume makes scalping genuinely difficult. Only viable for small positions with strict stop-losses.
Four risk management rules before putting capital into any small-cap token:
- Size the position - no more than 2-5% of a crypto portfolio in a single small-cap token
- Set a hard stop-loss - $0.016 is the logical invalidation level for current buyers
- Don't hold on centralised exchanges long-term - move to MetaMask or a hardware wallet
- Don't average down without a plan - adding to a losing position requires a defined thesis and limits
OGN Price Prediction: Expert Comparison and Forecast Summary
No single model has the full picture. Here's how major analytical sources compare on OGN across key timeframes:
2026 consensus range: $0.016 - $0.062. The bearish models anchor to recent declining price action and project it forward. The bullish models factor in adoption metrics, the buyback mechanism, and historical altcoin cycle behaviour. The practical takeaway: the base case is range-bound consolidation around $0.018-$0.030, with the direction of the next major move dependent on macro crypto conditions rather than OGN-specific catalysts.
Conclusion: OGN Price Outlook and Final Thoughts
The OGN price prediction picture for 2026-2030 is genuinely wide - and that uncertainty is information, not noise. It tells you this is a high-risk, high-optionality asset at a historically depressed price level, with real protocol infrastructure underneath and a verifiable deflationary mechanism operating on-chain.
Short-term traders (0-12 months): The current technical setup doesn't support aggressive long positions. Both SMAs are declining, MACD is negative, and the Fear & Greed Index sits at Extreme Fear. The range-trade between $0.018 and $0.025 offers defined setups, but the broader bias is cautious. Wait for a confirmed break above $0.030 with volume before sizing up meaningfully.
Medium-term investors (2027-2028): The Bitcoin halving cycle is the most important variable. If 2028 produces a comparable altcoin season to prior cycles, low-cap DeFi infrastructure tokens like OGN could see substantial repricing. Current accumulation levels near $0.018-$0.021 represent an interesting entry for this thesis - provided you've defined your stop and sized the position appropriately.
Long-term HODLers (2029-2030+): The bull case requires DeFi and NFT infrastructure adoption to grow meaningfully, Origin Protocol to maintain competitive relevance, and the buyback program to continue tightening supply. Track TVL growth in OUSD, Origin Story marketplace volume, and DAO buyback execution as your fundamental indicators.
On-chain verifiability matters here. Every buyback transaction, every governance vote, every liquidity pool metric is auditable in real time. That's the standard serious DeFi investors should hold all projects to. Platforms built on this principle of trustless transparency - where outcomes are verifiable rather than claimed - represent where the industry is heading.
Do your own research, track the on-chain data, and make decisions based on evidence rather than forecasts alone. For context on how similar altcoin predictions have played out historically, our Ethereum price prediction and altcoin prediction overview are worth reviewing alongside this analysis.
Risk disclaimer: Crypto trading involves substantial risk of loss. OGN is a high-volatility small-cap asset. Nothing in this article constitutes financial or investment advice. Past price performance is not indicative of future results. Never invest more than you can afford to lose.
Last updated: March 2026.
Frequently Asked Questions
What is OGN price prediction for 2026?
The OGN price prediction for 2026 ranges from $0.016 to $0.062 depending on the model. Algorithmic forecasts like CoinCodex lean bearish near $0.017, while fundamental analysts at Coinpedia see $0.050-$0.060 if OGN reclaims the $0.030 resistance. The base case is continued consolidation between $0.018 and $0.025, with directional clarity dependent on broader altcoin market conditions. All price predictions carry substantial uncertainty - crypto assets are highly volatile and past performance is not indicative of future results.
What is Origin Protocol (OGN) and what is it used for?
Origin Protocol is a decentralised commerce layer built on Ethereum. Its two main products are Origin Story - a white-label NFT marketplace platform - and Origin Dollar (OUSD), a yield-bearing stablecoin that earns returns from DeFi protocols automatically. OGN is the governance and utility token: holders vote on upgrades, participate in fee distribution, and benefit from a buyback mechanism funded by protocol revenue. The Origin DAO expanded weekly buybacks to approximately $200,000 in 2025 - a verifiable deflationary force at OGN's current market capitalisation.
What will OGN be worth in 2030?
OGN's 2030 price prediction spans $0.006 (CoinCodex bear case) to $2.00 (Coinpedia bull case). The base case - assuming steady DeFi adoption and a normal 2028 halving cycle - points to a range of $0.08-$0.25. The bull case requires significant ecosystem growth, sustained buybacks, and a favourable macro environment. All long-term forecasts carry high uncertainty and should be treated as scenario frameworks rather than price targets.
Is OGN a good investment in 2026?
Whether OGN suits your portfolio depends on risk tolerance and time horizon. The case for it includes a verifiable $200K/week buyback, real protocol utility, and a price 97% below ATH - offering asymmetric upside if adoption grows. Against it: bearish SMAs, negative MACD, only 30% green days, and a competitive DeFi/NFT landscape. For risk-tolerant investors with a 2028-2030 horizon, current accumulation levels near $0.018-$0.021 are interesting - but position sizing discipline is essential. This is not financial advice; crypto trading involves substantial risk of loss.
What are the key support and resistance levels for OGN?
OGN's primary support sits at the $0.018-$0.020 zone, where buyers have consistently defended price during current consolidation. Below that, $0.015 is a secondary support level. On resistance, $0.025-$0.030 is the key barrier OGN has repeatedly failed to sustain above - a weekly close above $0.030 with volume would be the first genuine signal of a trend change. Further resistance levels appear at $0.040-$0.050 and $0.060. These levels are derived from price action and are not guarantees of future behaviour.
What technical indicators are used to predict OGN price?
OGN price analysis uses RSI (currently 46.78 - neutral), 50-Day SMA ($0.0224 - sell signal), 200-Day SMA ($0.0369 - sell signal), MACD (negative crossover - bearish), Bollinger Bands (narrowing - consolidation phase), Fibonacci Retracement levels from the ATH drawdown, and the Fear & Greed Index (11 - Extreme Fear). Volume analysis supplements these signals. The current composite reading is bearish-to-neutral, favouring a cautious stance until a confirmed technical reversal occurs.
Where can I buy OGN tokens?
OGN is available on Binance (OGN/USDT and OGN/BTC pairs), MEXC (OGN/USDT), and Kraken for users in eligible jurisdictions. For decentralised options, OGN can be swapped on Uniswap using the OGN ERC-20 contract address, though CEX liquidity is typically higher. Use limit orders rather than market orders to avoid slippage, especially during low-volume periods. Always withdraw to a self-custody wallet (MetaMask, Ledger) for holdings beyond short-term trading positions.
