
RUNE price prediction is one of the more polarising exercises in crypto analysis right now - and for good reason. This token once traded at $21.26, commanding the attention of every DeFi enthusiast on the planet. Today it sits near $0.40. Whether that gap represents devastation or opportunity depends entirely on what comes next for THORChain, and that's exactly what this guide breaks down.
Built from live technical indicators, on-chain mechanics, and a clear-eyed look at the risks most prediction articles quietly skip - this analysis covers short-term targets, year-by-year forecasts through 2030, and practical strategy frameworks for different risk profiles.
⚡ Key Takeaways
- RUNE currently trades near $0.40, roughly 98% below its May 2021 all-time high of $21.26
- 2026 forecasts diverge sharply: CoinCodex models a bearish ~$0.31 by year-end; CoinPedia projects a bullish $7.35-$16.31
- The V3.8.0 upgrade (Solana + TRON integration) is the single most important near-term fundamental catalyst
- Fear & Greed Index sits at 8 (Extreme Fear) - historically a contrarian signal, but not a standalone buy signal
- 2030 projections range from $0.17 to $45.33 - that spread tells you everything about the uncertainty baked in

What Is THORChain (RUNE)? A Foundation for Price Analysis
Before any price target makes sense, you need to understand what actually drives RUNE's value - because this isn't a straightforward supply-and-demand story.
THORChain is a decentralised cross-chain liquidity protocol built on the Cosmos SDK. Its core proposition is trustless native asset swaps: you can trade Bitcoin for Ethereum, or Litecoin for BNB, without wrapping tokens, relying on custodians, or trusting a centralised counterparty. The protocol handles the settlement directly on-chain.
RUNE functions as the settlement layer for the entire network. Every liquidity pool on THORChain holds a 1:1 RUNE pairing - if a pool holds $10,000 in BTC, it also holds $10,000 in RUNE. That structural 1:4 mechanic (for every $4 of pooled assets, $1 of RUNE must be bonded) creates genuine, protocol-level demand tied directly to the network's total value locked.
Statistics reflect CoinGecko market data at time of writing. April 2026.
Understanding this architecture is non-negotiable for interpreting RUNE price predictions - the token's value is mechanically linked to how much liquidity flows through the protocol, not just to speculative sentiment.
How THORChain Generates Swap Fees (and Why It Matters for RUNE Price)
Every time a user executes a cross-chain swap on THORChain, the protocol collects a fee. Those fees flow to two groups: liquidity providers (LPs) who supply assets to the pools, and node operators who bond RUNE to secure the network. The more swap volume THORChain handles, the more fees distributed - and the more RUNE must be bonded to accommodate new liquidity.
The V3.8.0 upgrade introduces Solana and TRON support, opening access to over $50 billion in stablecoin liquidity. New burn-and-mint mechanics are also part of V3.8.0: as swap demand rises, RUNE gets burned to mint synthetic assets, mechanically reducing circulating supply. More users = more swaps = more RUNE burned = less RUNE in circulation.
That supply reduction is the mechanism most casual observers miss when reading RUNE price predictions. It's not a narrative - it's coded into the protocol.
RUNE Tokenomics: Supply, Circulating, and Max Cap
The supply side of RUNE's price equation is relatively clean. Circulating supply sits at approximately 351 million tokens against a hard cap of 500 million RUNE. Roughly 70% of max supply is already in circulation, meaning dilution from emissions is limited compared to many inflationary DeFi protocols.
The fixed maximum supply is a meaningful differentiator in a category where many protocols print tokens indefinitely. If swap volume recovers and the burn mechanic activates at scale, net issuance could turn negative - a structural tailwind for price that belongs in any serious RUNE analysis.

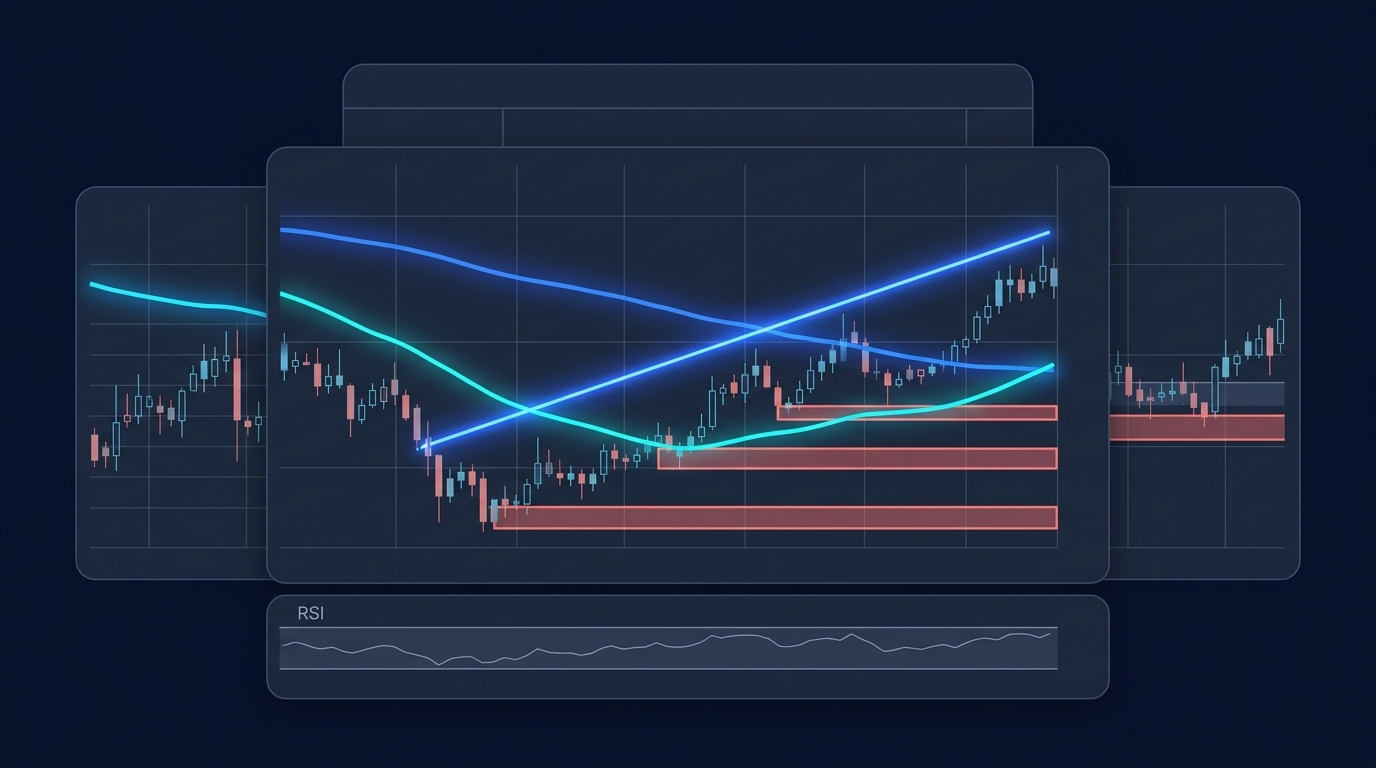
RUNE Technical Analysis: What the Charts Say Right Now
RUNE technical analysis paints a picture that requires some honest reading - the short-term signals are not encouraging, but the medium-term setup depends heavily on whether key price levels hold.
Here's the current technical snapshot as of early April 2026:
The dominant signal here is that RUNE is trading well below both its 50-day and 200-day moving averages - a classic bear market configuration. MA200 at $0.68-$0.79 acts as a heavy ceiling. Until price reclaims MA50 at $0.42 and sustains it, any rally should be treated as a potential bear market bounce rather than a trend reversal.
RSI at 47-49 sits in neutral territory, which sounds better than it is - it means there's no strong buying momentum building, but RUNE also isn't deeply oversold at levels where contrarian bounces typically occur (RSI below 30). The Fear & Greed Index at 8 is the most interesting data point: historically, Extreme Fear readings have preceded market recoveries, though timing those recoveries has crushed many portfolios.
Key Support and Resistance Levels for RUNE
Traders watching RUNE need to map out the critical price levels before the forecasts in the next sections mean anything actionable.
The first meaningful resistance sits at R1 (~$0.416), followed by R2 (~$0.422) which roughly coincides with the MA50 level. A sustained close above MA50 at $0.42 would be the first real bullish confirmation signal. On the downside, S1-S3 in the $0.394-$0.405 range represents the immediate support cluster. A clean breakdown below $0.39 opens the path toward the $0.31-$0.33 zone - where the more pessimistic 2026 models put the floor.
Bollinger Bands are worth watching separately. When the bands contract sharply during low-volume consolidation, the statistical expectation is an explosive move in either direction. With these technical levels established, let's examine what the price forecasts actually say for the years ahead.
RUNE Price Prediction 2026: Targets and Scenarios
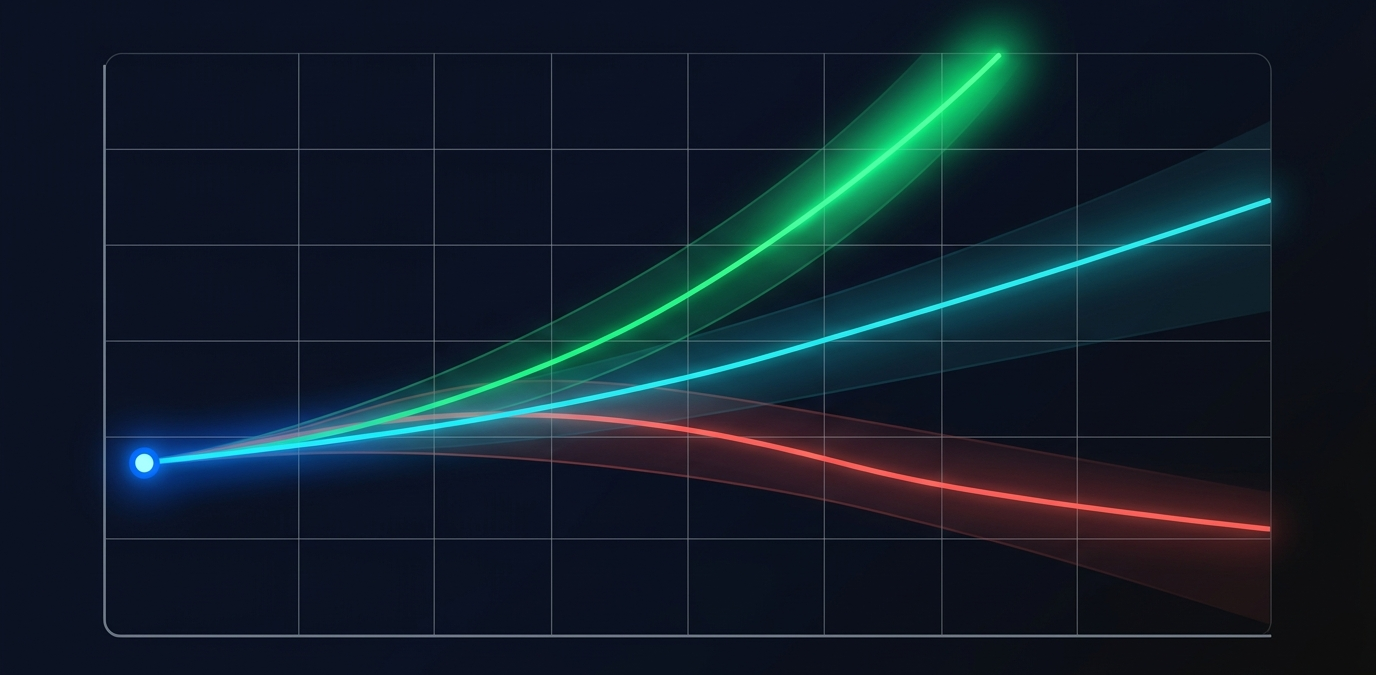
RUNE price prediction for 2026 is where the forecasting community is most divided. Three credible sources produce three radically different scenarios, and that divergence reflects genuine fundamental uncertainty rather than analytical error.
✓ BULLISH SCENARIO
Target: $7.35-$16.31
V3.8.0 activates $50B+ in new liquidity; TVL surge triggers burn mechanics at scale
Risk: Sentiment doesn't recover; adoption slower than projected
→ NEUTRAL SCENARIO
Target: $0.42-$0.46
Gradual protocol recovery, steady swap volume growth without major catalyst
Risk: Regulatory headwinds slow DeFi expansion; stagnant TVL
✕ BEARISH SCENARIO
Target: $0.28-$0.31
No major catalyst; continued fear sentiment; volume stays depressed
Risk: Exchange delisting, TVL decline, competitor displacement
What the major forecasting sources project:
The CoinCodex model is algorithmic - it extrapolates from recent price action and technical momentum, which explains the bearish reading. CoinPedia's forecast is fundamentally driven, pricing in successful V3.8.0 execution and broader DeFi recovery. MEXC's calculator applies a conservative 5% annual growth assumption, producing the flattest trajectory.
The V3.8.0 upgrade is the hinge point for 2026. Solana integration alone adds access to one of the most active on-chain ecosystems for stablecoins and derivatives. TRON's inclusion expands USDT liquidity access significantly. If both go live and deliver meaningful swap volume, the bullish scenario is defensible. If integration is delayed, the conservative range is the more probable outcome.
⚠ Risk Disclaimer
- Crypto trading involves substantial risk of loss → price predictions are speculative
- None of the above constitutes financial advice → conduct independent research
- Past market cycles → do not guarantee future results
THORChain Price Prediction 2027-2030: Long-Term Outlook
Zooming out to the 2027-2030 window requires contextualising RUNE within the macro crypto cycle. Bitcoin's halving history is relevant here - not as a guarantee, but as a structural pattern. Post-halving altcoin rotations have historically amplified gains for protocols with genuine utility.
Note: Pairs show CoinCodex (bear model) / CoinPedia (fundamental model) for each year.
RUNE Price Prediction 2027-2028
RUNE price prediction for 2027 is where the post-halving narrative enters most directly. If historical patterns hold, the 2024 Bitcoin halving should generate altcoin momentum sometime in the 12-18 months that follow - putting mid-to-late 2026 through 2027 in the theoretical sweet spot for an altcoin rotation. You can explore how Bitcoin halving cycles work and why they've historically preceded altcoin rallies.
CoinCodex projects RUNE in the $0.33-$0.47 range for 2027 via technical momentum extrapolation. CoinPedia's fundamental model puts 2027 at $11-$20, assuming V3.8.0 integration successfully attracts institutional-scale swap volume from Solana and TRON ecosystems.
For swing traders, the 2027 window may represent the most actionable opportunity in this cycle. A confirmed break above MA50 ($0.42) followed by a test of MA200 ($0.68-$0.79) would be a classic swing trade setup. By 2028, CoinPedia projects $16-$28 - a full DeFi bull market scenario. CoinCodex's 2028 range ($0.19-$0.35) reflects failure to recover fundamental demand drivers.
RUNE Price Prediction 2029-2030
RUNE price prediction 2030 is the most scrutinised - and most speculative - window in this analysis. Will RUNE hit $10 by 2030? At current prices, that would require a 25x increase. The answer: possible under specific conditions, far from probable as a base case.
The $45 scenario requires believing in a protocol valuation comparable to where RUNE traded in mid-2021 - a time when DeFi TVL was at all-time highs. For HODL-oriented investors comfortable with 70-80% drawdown scenarios along the way, the risk-reward calculus at $0.40 looks different than it does at $5.
Key Factors That Will Drive RUNE Price Up or Down
Most RUNE price prediction articles list a few bullet points and call it analysis. The reality is more layered - there are specific, identifiable catalysts and specific, identifiable risks that experienced traders should be tracking.
✓ BULLISH DRIVERS
- V3.8.0 Solana + TRON integration
- Burn-and-mint mechanics reducing supply
- Cross-chain DEX narrative gaining DeFi mindshare
- Bitcoin halving cycle tailwind (historically)
- Protocol-level 1:4 bonding demand
- Real yield model attracting serious capital
✕ BEARISH RISKS
- Persistent low TVL kills bonding demand
- Regulatory pressure on cross-chain DEX protocols
- Exchange delisting if liquidity thresholds unmet
- Competition from Stargate, Wormhole, LayerZero
- Fear & Greed stuck at Extreme Fear
- Unlock schedules creating sell pressure
Bullish Catalysts: What Could Send RUNE Higher
V3.8.0 and the Solana/TRON integration is the most concrete near-term catalyst. Solana is one of the most active chains for stablecoin movement and derivatives activity - adding native RUNE routing meaningfully expands THORChain's addressable market. TRON's massive USDT ecosystem is an additional unlock. Conservative estimates suggest $50B+ in new liquidity becomes accessible.
The burn-and-mint mechanic at scale works mechanically: as swap volume grows, RUNE's circulating supply declines. At current ~351M circulating tokens, even a modest 5-10% reduction in supply with stable or growing demand has disproportionate price impact.
TVL recovery and bonding demand complete the bull case. If THORChain's TVL returns toward higher levels, the 1:4 liquidity ratio requires significantly more RUNE to be bonded - creating real, structural scarcity pressure that no amount of bearish sentiment can override.
📊 Top 5 Bullish Catalysts
- V3.8.0 live: Solana + TRON integration → $50B+ addressable liquidity
- Burn mechanic activates → circulating supply declines structurally
- TVL recovery → bonding demand increases with each new pool
- DeFi bull cycle → cross-chain narrative becomes the market's focus again
- New exchange listings → improved price discovery and retail access
Bearish Risks: What Could Keep RUNE Price Suppressed
Risk 1 (High): Low TVL removes bonding demand entirely. If total value locked stays depressed, the 1:4 mechanics that drive fundamental RUNE demand simply don't activate. You're left with a token whose utility story is theoretical rather than operational. This is the single most important risk to monitor.
Risk 2 (High): Exchange delisting. This is a real scenario explicitly flagged in public analyst commentary - if major exchanges view RUNE's liquidity as insufficient or its regulatory standing as uncertain, forced delistings would cut off retail access and collapse trading volume.
Risk 3 (Medium): Regulatory pressure on cross-chain DEX protocols. Decentralised cross-chain bridges face increasing scrutiny globally. Any enforcement action targeting cross-chain infrastructure would hit THORChain sentiment immediately. Monitoring DeFi regulatory developments is essential for anyone holding RUNE.
Risk 4 (Medium): Competitive displacement. Stargate (LayerZero), Wormhole, and emerging protocols offer cross-chain bridging with lower friction in some use cases. While they don't replicate THORChain's native asset swap model, they compete for the same user attention and capital.
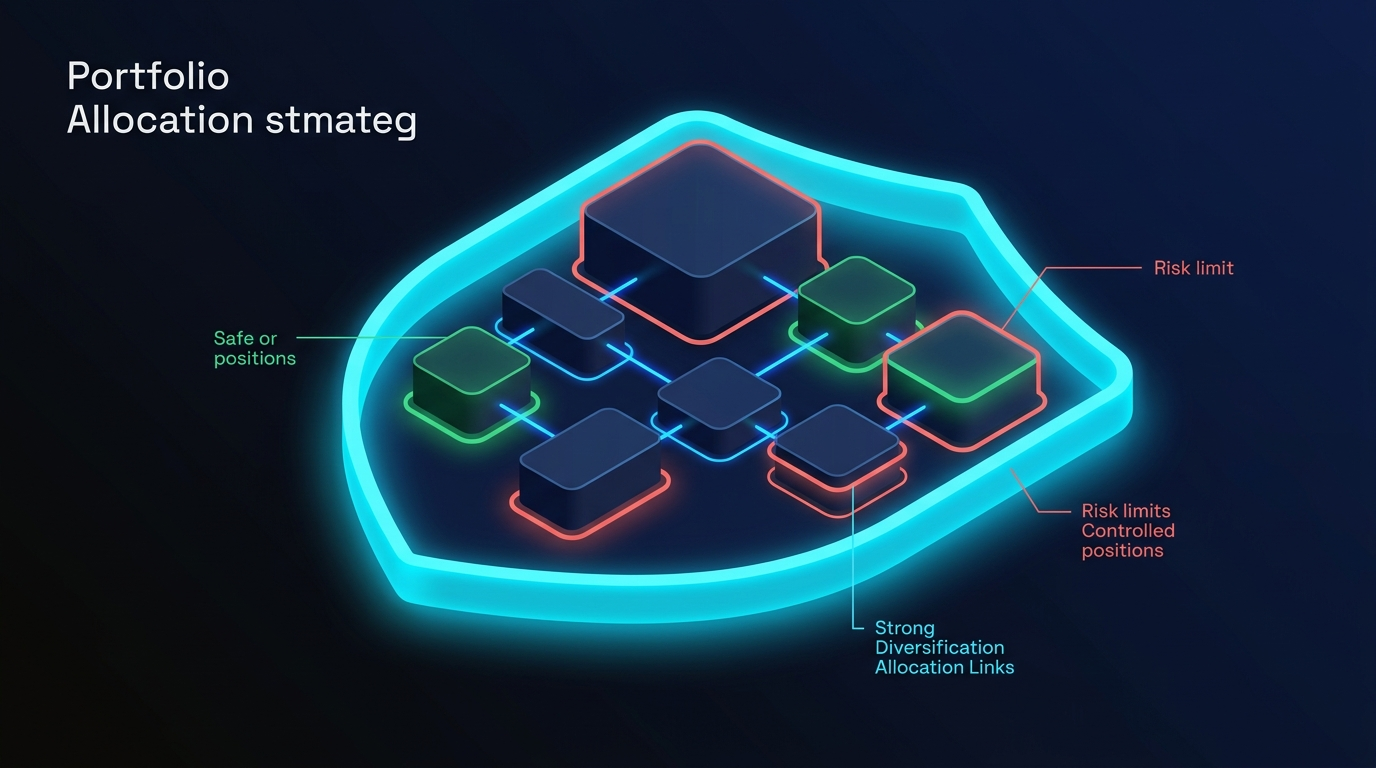
RUNE Investment Strategies: How to Approach the Market
Price predictions only matter if you have a clear framework for acting on them. At $0.40, RUNE presents different risk-reward profiles depending on your time horizon, risk tolerance, and strategic approach. Before anything else: position sizing and risk management are not optional considerations - they are the foundation on which everything else sits.
*Medium risk assumes correct position sizing (1-5% of total crypto portfolio).
Popular Trading Strategies for RUNE
Day Trading. RUNE's 3.91% daily volatility makes intraday trading technically viable, but it's the highest-risk approach in the current bearish configuration. Day traders should use the pivot point levels (R1-S3 in the $0.394-$0.416 range) as primary reference for entries and exits. RSI confirmation at overbought/oversold extremes adds signal quality. This approach demands high time commitment and tight discipline.
Swing Trading. The most compelling setup for RUNE in 2026 is a confirmed break above MA50 (~$0.42) on meaningful volume. That breakout - if accompanied by RSI moving above 55 and a MACD bullish crossover - represents a classic swing entry. Target zones: $0.55-$0.68 (first resistance band), with MA200 at $0.68-$0.79 as the swing trade endpoint. Stop-loss below S3 at $0.39-$0.40.
Trend Following. RUNE is not currently in a trend-following environment. For trend followers, the signal to watch is a sustained weekly close above MA200 at ~$0.68. MACD crossovers on the weekly chart provide early confirmation. Understanding how macro Bitcoin cycles interact with altcoin trends helps frame the timing.
HODL. The simplest framework: accumulate at depressed levels over time, hold through 2030, and accept that 40-60% interim drawdowns are historically normal for RUNE. This strategy requires strong conviction in the fundamental thesis and genuine ability to ignore mark-to-market losses.
Risk Management Essentials for RUNE Positions
⚡ Before You Trade RUNE: Risk Management Checklist
- Position sizing: Limit RUNE to 1-5% of total crypto portfolio for most risk profiles
- Stop-loss placement: Below $0.33-$0.31 zone - the first meaningful floor below current levels
- DCA protocol: For long-term holders, spread entries across 3-6 months rather than single-entry
- Portfolio diversification: RUNE should be one component of a multi-asset position, not a concentrated bet
- Volatility buffer: With 3.91% daily volatility, don't place stop-losses so tight they trigger on normal noise
- Liquidity check: Confirm exit liquidity on your chosen exchange before sizing up
DCA (dollar-cost averaging) is particularly well-suited to RUNE's current price environment. A $500 total allocation spread across 5 monthly purchases of $100 each means your average entry is less sensitive to any single price move. Combined with correct position sizing, DCA is the most rational accumulation approach for long-term believers who aren't trying to time the market.
THORChain Alternatives: Other Cross-Chain and DeFi Options
THORChain isn't the only protocol competing for cross-chain liquidity - and understanding that context matters for evaluating where RUNE sits in the competitive landscape.
THORChain's unique moat - native asset swaps without wrapped tokens - isn't replicated by any of these alternatives. When you swap BTC for ETH on THORChain, actual BTC leaves your wallet and actual ETH arrives. No wrapped tokens, no bridge risk, no counterparty custody. That's the core reason the protocol's long-term competitive position remains interesting, despite current price weakness.
Is RUNE a Good Investment? Final Verdict
RUNE forecasts for 2030 range from $0.17 to $45.33. That spread isn't analyst incompetence - it's an accurate representation of genuine uncertainty about a protocol at a critical inflection point. The protocol's fundamental architecture, on-chain fee generation, and trustless execution model reflect where serious DeFi infrastructure is heading. Platforms built on self-custody and on-chain verifiability - values central to the emerging standard in crypto finance - represent the direction the ecosystem is trending. Whether THORChain specifically captures that future is the question that $0.40 either prices in or ignores.
⚡ Who This Is For
Short-term Speculative Trader
The technical setup is bearish - both MA50 and MA200 sit above current price, sentiment is at Extreme Fear, and there's no confirmed reversal signal. Any short-term RUNE position requires tight discipline and defined risk parameters.
Long-term DeFi Investor
At $0.40, the fundamental argument for accumulating RUNE over 6-12 months is more defensible. If V3.8.0 delivers, burn mechanics activate, and TVL recovers, current prices may look attractive in retrospect. The position requires genuine patience.
Risk-Averse Investor
RUNE is too speculative for conservative crypto portfolios. The forecast divergence alone signals that nobody can reliably predict the outcome. A token that could plausibly be worth $0.17 or $45 by 2030 belongs in a high-risk allocation, not in the core of a conservative portfolio.
Whatever approach you take: size appropriately, set defined exit parameters, and treat every price prediction - including this one - as a framework for thinking, not a forecast to trust blindly.
⚠ Risk Disclaimer
Crypto trading involves substantial risk of loss. This article is for informational purposes only and does not constitute financial advice or an investment recommendation. All price predictions are speculative and based on third-party models. Always conduct independent research before making any investment decision. Past performance does not guarantee future results.
Last updated: April 2026.
Frequently Asked Questions
What is the RUNE price prediction for 2026?
RUNE price prediction for 2026 varies dramatically by source. CoinCodex's algorithmic model projects a bearish ~$0.31 by year-end, while CoinPedia's fundamental analysis targets $7.35-$16.31, assuming successful V3.8.0 execution and DeFi recovery. MEXC's conservative 5% growth model puts 2026 around $0.42-$0.47. The wide divergence reflects genuine uncertainty - the V3.8.0 upgrade (Solana + TRON integration) is the single most important variable for where RUNE ends the year.
What is the THORChain price prediction for 2030?
THORChain price prediction for 2030 spans one of the widest ranges in crypto: CoinCodex projects $0.14-$0.20 while CoinPedia targets $26.67-$45.33 - a scenario representing 60-110x growth from current prices. The bull case requires THORChain maintaining cross-chain DEX leadership, multiple successful chain integrations, and at least one more favourable macro cycle. The 2030 target is best treated as a directional thesis rather than a reliable forecast.
Will RUNE reach $10?
RUNE reaching $10 by 2030 is within the range of some fundamental models but far from a base case. A $10 target represents a 25x increase from current prices (~$0.40). For that to happen, THORChain's TVL would need to recover significantly, V3.8.0 would need to drive substantial new swap volume, and the broader DeFi market would need a recovery comparable to 2020-2021. Possible under the right conditions - not a base case for most analysts.
How does THORChain differ from other cross-chain bridges?
THORChain enables native asset swaps: when you swap BTC for ETH, actual BTC leaves your wallet and actual ETH arrives - no wrapped tokens, no bridge risk, no counterparty custody. Most cross-chain bridges (Stargate, Wormhole) lock assets on one chain and mint wrapped representations on another. That's a fundamentally different security model, and it's the core competitive moat that makes THORChain's long-term thesis interesting despite current price weakness.
What is the RUNE burn-and-mint mechanism?
When users hold synthetic assets on THORChain (e.g., sBTC), RUNE is burned to create those synthetics. When users redeem synthetics for native assets, RUNE is minted again. If synthetic demand exceeds redemption, the burn rate exceeds the mint rate - and circulating RUNE supply declines. This mechanism creates a direct link between synthetic asset demand and RUNE supply reduction, making it a genuine deflationary pressure tool, not just a tokenomics narrative.
Should I use DCA to buy RUNE?
DCA (dollar-cost averaging) is well-suited to RUNE's current price environment. At $0.40 with high forecast uncertainty, spreading purchases across 3-6 months eliminates the burden of trying to identify the exact bottom. A $500 total allocation split across 5 monthly $100 purchases means your average entry is far less sensitive to any single price move. DCA doesn't eliminate risk - it distributes it over time, which is meaningful for a high-volatility asset like RUNE.
Is RUNE a good long-term investment?
Whether RUNE suits a long-term portfolio depends on your risk profile and conviction in the THORChain thesis. The fundamental case is coherent: native cross-chain liquidity is genuinely important, bonding mechanics create structural demand, and the burn-and-mint adds a deflationary element. The risks are equally real: CoinCodex projects RUNE near $0.17 by 2030, competitors are active, and TVL recovery isn't guaranteed. At $0.40, the risk-reward is different than at $5 - but different doesn't mean automatically acceptable. Size appropriately.
