The Sandbox's native token SAND is currently trading around $0.14 - more than 98% below its November 2021 all-time high of $8.40. Whether that represents an opportunity or a warning sign depends entirely on what you think the metaverse sector looks like in 2030. This guide covers the SAND price prediction across the full 2026-2030 horizon, using both technical indicator data and fundamental platform analysis to build a realistic picture.
I've spent time dissecting on-chain data, aggregating analyst forecasts from six major sources, and stress-testing the bull and bear cases against what The Sandbox is actually building. What follows isn't a hype piece - it's the analysis I'd want before allocating to a metaverse token in this market.
⚡ Key Takeaways
SAND currently trades at approximately $0.14, down 98%+ from its $8.40 ATH (November 2021)
Coverage period: 2026 through 2030 - both short-term and long-term forecast scenarios
2026 consensus range: $0.18-$0.36 (conservative to mid), with outlier bull targets up to $0.88
2030 range: spans from $0.28 (conservative) to $5.69 (maximum bull case) - a 15x variance reflecting genuine uncertainty
SAND carries significant risk - including LAND value collapse, full token dilution in 2026, and competitive pressure
This article is for informational purposes only and does not constitute financial advice. Crypto trading involves substantial risk of loss.
What Is The Sandbox (SAND)? Platform, Token, and Ecosystem Explained
The Sandbox is a blockchain-based virtual gaming platform where users create, own, and monetize digital assets using NFTs and decentralized governance - without a central authority controlling who owns what or what content gets built. Think of it as a creator economy layered on top of a virtual world, where the underlying assets are verifiably yours.
The platform runs on Ethereum, with a secondary presence on Polygon for lower-fee transactions. Three token types power the entire ecosystem: SAND (the ERC-20 utility token), LAND (ERC-721 virtual real estate NFTs, capped at 166,464 plots), and ASSET (ERC-1155 in-game items created by users). Each type serves a distinct economic function, and together they form the financial backbone of The Sandbox metaverse.
What makes The Sandbox credible beyond the speculative hype is its brand partner roster. Adidas, Snoop Dogg, Warner Music Group, Atari, and The Walking Dead have all established virtual presences within the platform. These aren't minor partnerships - they reflect institutional-level conviction in the long-term value of a blockchain-native entertainment venue.
THE SANDBOX ECOSYSTEM AT A GLANCE
PARAMETER
VALUE
Token
SAND
Blockchain
Ethereum + Polygon
Token Standard
ERC-20
Max Supply
3,000,000,000 SAND
LAND Plots
166,464 (fixed supply)
Key Tools
VoxEdit, Game Maker, Marketplace
Notable Partners
Adidas, Snoop Dogg, Warner Music Group, Atari
All-Time High
~$8.40 (November 2021)
Understanding the platform is essential context for any SAND price prediction - you can't evaluate the token without knowing what it's supposed to do.
How SAND Token Works: Utility, Staking, and Governance
SAND isn't a pure speculative asset. The token has four concrete utility functions that create genuine demand independent of market sentiment.
1. Transaction medium. Every LAND purchase, ASSET sale, and marketplace transaction on The Sandbox uses SAND. The platform generates fee volume when people actually engage with it - not just when they speculate on the token.
2. Staking. Users can stake SAND to earn passive yield and gain access to exclusive NFTs. Staking pools operate on both Ethereum and Polygon, giving users flexibility on gas fee exposure. Yield comes from the platform's 5% NFT transaction fee pool - not from token emissions. That distinction matters for inflation-sensitive investors.
3. DAO Governance. SAND holders vote on platform development priorities, LAND reserve fund allocations, and major ecosystem decisions. Governance participation increases token lock-up, which has a modest supply-constraining effect.
4. Play-to-Earn. In-game events and seasonal competitions distribute SAND rewards to active participants, incentivizing continued ecosystem engagement.
📊 4 Ways to Use SAND Tokens
Buy and sell LAND plots and in-game ASSET NFTs
Stake for passive rewards funded by platform fee revenue
Vote in DAO governance on platform decisions
Earn through play-to-earn seasonal events and Game Jams
The fee structure is worth noting: The Sandbox charges a 5% fee on all NFT transactions, split evenly between the staking rewards pool and The Sandbox Foundation. This creates a self-sustaining rewards mechanism - staking yield scales with platform activity rather than relying on token minting.
SAND Tokenomics: Supply, Distribution, and Deflationary Mechanics
Tokenomics is where the SAND story gets genuinely interesting from a price prediction standpoint - and not entirely in a bullish direction.
The hard cap is 3,000,000,000 SAND. As of early 2026, approximately 2.43 billion tokens are in circulation, with full dilution expected to complete around 2026. That's a critical supply-side event: once maximum supply is reached, the tokenomics shift entirely from emission-driven to adoption-driven. No more scheduled releases to suppress price; demand becomes the primary variable.
Token distribution breaks down roughly as follows: Foundation reserves (~15%), team and advisors (~20%), staking rewards (~12%), creator funds (~10%), play-to-earn incentives (~8%), and public sale and ecosystem (~35%). The staking and creator allocations continue distributing, which is why circulating supply is still approaching (but not yet at) the maximum.
The deflationary mechanism - the 5% transaction fee burn - is real but modest. At current transaction volumes, it doesn't meaningfully offset supply pressure. The honest read: SAND's price will be increasingly demand-driven post-dilution, and that demand depends on whether The Sandbox builds a genuinely sticky user base, not just a speculative asset class.
With those supply dynamics established, the forecast data becomes much easier to interpret.
This is the core analysis - what multiple independent forecast sources are projecting for SAND across the next four years, and why those forecasts vary so dramatically.
Technical context first: as of Q1 2026, SAND's RSI sits around 56 - firmly in neutral territory, neither signaling overbought conditions nor a deeply oversold bounce setup. The 50-day SMA is showing mixed signals depending on timeframe, while the 200-day SMA has been declining since late 2025, indicating persistent longer-term bearish momentum. Bollinger Band width suggests elevated volatility relative to the token's recent price range, which means sharp moves in either direction are possible without much warning. For a deeper dive into how BTC halving cycles shape altcoin seasons, that background is essential context before reading these forecasts.
For the SAND price prediction to shift decisively bullish, technical analysts generally want to see the 50-day SMA cross above the 200-day (a "golden cross"), RSI push above 65 on increasing volume, and support hold above the $0.085-$0.10 zone.
Sources: aggregated from CoinCodex, PricePrediction.net, DigitalCoinPrice, CoinPedia, Benzinga, CoinFormania. For informational purposes only - not financial advice.
SAND Price Prediction 2026
The 2026 forecast aggregates to a fairly tight consensus range among the more conservative models: $0.18-$0.36, with a mid-point around $0.26. CoinCodex's algorithmic model leans toward the lower end of that range, reflecting its technically bearish 200-day SMA reading. Benzinga and DigitalCoinPrice cluster around $0.23-$0.36. The $0.88 outlier comes from models that assign significant probability to a broad crypto market re-rating in H2 2026.
Key 2026 catalysts:
Bullish: The Sandbox NEXT mobile game launch (playtest was initiated in early 2026) is the single most significant platform catalyst. Mobile accessibility is the missing piece in current user acquisition. Full token dilution reaching completion removes ongoing sell pressure from scheduled emissions. UGC Season expansion targeting 50%+ user-created content also signals a Roblox-style maturation.
Bearish: The historic LAND value collapse - with some premium estates down ~99.8% from ATH values - removed a core investment narrative and continues to weigh on sentiment. RSI at 56 means there's no oversold bounce dynamic providing technical support right now.
🔴 CONSERVATIVE
$0.18
Technical models, bearish macro
🟡 CONSENSUS MID
$0.26
Majority analyst cluster
🟢 OPTIMISTIC
$0.36
Mobile launch + stable market
🚀 BULL CASE
$0.88
Altcoin rally + NEXT adoption
SAND Price Prediction 2027-2028
The 2027-2028 window is where analyst models diverge most sharply - and that divergence is itself informative.
2027: Conservative models project $0.10-$0.20, treating SAND as a declining-relevance platform token. Mid-tier consensus sits at $0.34-$0.43. Bullish models go to $1.30, pricing in a full crypto bull market cycle.
2028: Conservative range $0.23-$0.46, bullish outliers $2.10. Multiple sources cluster between $0.38-$0.46 for the mid case.
The key 2027-2028 macro driver is the Bitcoin halving cycle. The April 2024 BTC halving historically triggers altcoin outperformance 12-24 months later, which would place peak altcoin momentum in the H2 2025 to mid-2026 window - potentially extending into 2027 if the cycle runs longer than previous cycles. SAND, as a high-beta altcoin with a speculative metaverse narrative, typically amplifies Bitcoin's directional moves in both directions.
SAND 2027 VS 2028 - SOURCE COMPARISON
SOURCE
2027 LOW
2027 HIGH
2028 LOW
2028 HIGH
CoinCodex
$0.10
$0.21
$0.23
$0.38
DigitalCoinPrice
$0.18
$0.26
$0.28
$0.42
CoinPedia
$0.29
$0.43
$0.35
$0.46
CoinFormania
$0.56
$1.30
$0.89
$2.10
SAND Price Prediction 2029-2030
Five-year forecasts in crypto carry inherent uncertainty that makes the variance range almost comically wide - but looking at it is still useful for understanding the scenario space.
2029: Conservative models project $0.46-$0.68. Optimistic cases reach $3.29, predicated on significant metaverse user adoption and an active trading ecosystem by that point.
2030: The range is $0.28 (bearish) to $5.69 (CoinPedia bull case), with mid-consensus around $0.72-$1.63. That 15x spread between the floor and the ceiling is the honest answer: nobody knows where SAND trades in 2030, and any model claiming precision at that horizon should be questioned.
2030 SAND PRICE TARGETS BY SOURCE
SOURCE
LOW
HIGH
CoinPedia
$2.67
$5.69
CoinFormania
$2.30
$4.65
Benzinga
$0.46
$0.64
DigitalCoinPrice
$0.28
$0.35
By 2030, SAND's price trajectory depends on whether the platform transitions from a speculative NFT vehicle to a genuine entertainment ecosystem with measurable daily active users, transaction volume, and creator revenue. That's a legitimate if uncertain prospect - not a guaranteed one.
How to Buy SAND: Step-by-Step Guide for 2026
Most SAND price prediction articles stop at the forecasts without helping you actually act on them. Here's the practical path if you decide to take a position.
How to Buy SAND Tokens in 5 Steps:
Choose a regulated exchange. Binance, OKX, Kraken, and Coinbase all list SAND with liquid trading pairs (SAND/USDT, SAND/BTC, SAND/USD). Compare fees and jurisdictional availability before signing up.
Complete KYC verification. All regulated exchanges require identity verification under current regulatory frameworks. Have your government ID and proof of address ready - the process typically takes 10-30 minutes on established platforms.
Deposit fiat or crypto. Transfer USD, EUR, or an existing crypto position to fund your trading account. Most platforms support bank transfer, card deposit, or crypto-to-crypto swap.
Execute a spot purchase. For long-term positions, a simple spot buy at market or limit price is the cleanest approach. If you're managing a larger position, consider splitting across multiple entries to avoid single-price concentration.
Transfer to a self-custodied ERC-20 wallet. Leaving tokens on an exchange exposes you to platform risk. Move SAND to a MetaMask, Ledger, or other ERC-20-compatible wallet you control. If you intend to stake, note that pools are available on both Ethereum mainnet and Polygon - Polygon stakes incur significantly lower gas fees.
TOP EXCHANGES FOR SAND
EXCHANGE
AVAILABILITY
KEY PAIR
NOTES
Binance
Global (check local restrictions)
SAND/USDT
Highest liquidity, lowest spread
OKX
Global
SAND/USDT
Strong derivatives support
Kraken
US, EU, UK
SAND/USD
Regulated, beginner-friendly
Coinbase
US, EU, UK, AUS
SAND/USD
Simplest onboarding for new users
One practical note on Polygon: if you plan to stake SAND and hold for 12+ months, bridging to Polygon before depositing into the staking contract saves meaningful gas over time. The Sandbox's own bridge makes this straightforward. Before buying, understanding what actually moves SAND's price changes how you size and time any position.
What Drives SAND Price? Key Factors and Technical Indicators
Technical analysis and fundamental analysis give different answers to the same question - and both matter. I look at SAND through both lenses before forming any view on direction.
✓ BULLISH FACTORS
SAND NEXT mobile launch (2026)
BTC halving cycle tailwind
Full dilution completing (end of emission pressure)
Brand partnerships (Adidas, Warner, Snoop Dogg)
UGC platform maturation (Roblox model)
Metaverse sector recovery potential
✕ BEARISH FACTORS
LAND value collapse (~99.8% from ATH)
200-day SMA declining since late 2025
Speculative asset with no cash flow
Regulatory uncertainty in key markets
Competition from Decentraland, newer platforms
Meta VR retreat signals sector headwinds
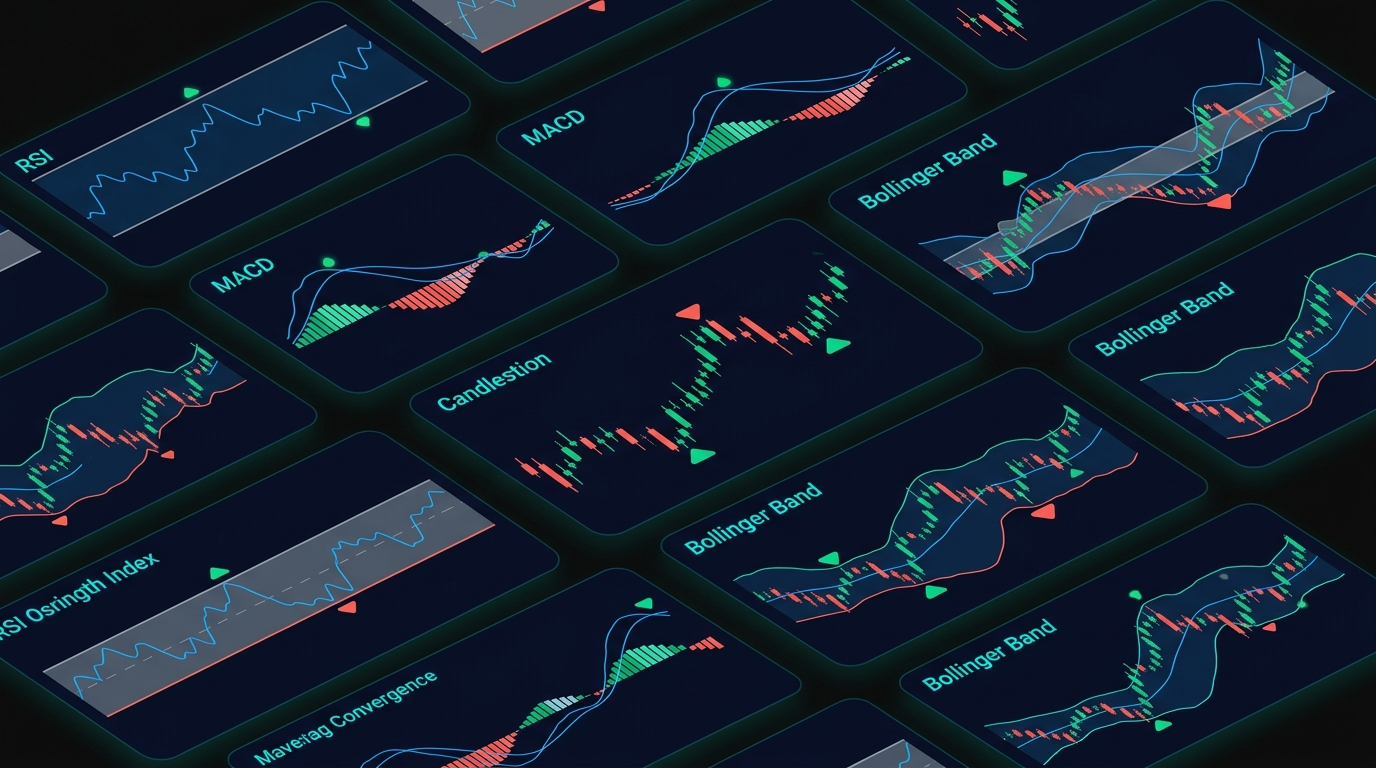
Technical Indicators: RSI, MACD, Moving Averages, and Bollinger Bands
Technical analysis uses price-derived signals to identify momentum, trend direction, and volatility - not as a crystal ball, but as a structured way to read what the market is currently pricing in.
SAND TECHNICAL INDICATOR STATUS - Q1 2026
INDICATOR
CURRENT SIGNAL
IMPLICATION FOR SAND
RSI (14-day)
~56 (Neutral)
No oversold bounce; no overbought warning
50-day SMA
Mixed - near price
Short-term trend unclear; watch for directional break
200-day SMA
Declining (bearish)
Long-term downtrend intact; golden cross not triggered
MACD
Near zero crossover
Momentum indecisive; wait for signal line confirmation
Bollinger Bands
Wide (high volatility)
Sharp moves possible in either direction
ATR (14-day)
~14% of price
High daily volatility; position sizing critical
RSI (Relative Strength Index) measures momentum on a 0-100 scale. Above 70 = overbought; below 30 = oversold. At 56, SAND sits in neutral territory - the market isn't stretched in either direction. MACD tracks trend momentum by comparing two EMAs; SAND's MACD hovering near the signal line is an indecisive reading that typically precedes a directional move. Moving Averages smooth out noise to reveal underlying trend direction - the declining 200-day SMA is the most significant bearish signal currently. Bollinger Bands show price relative to its volatility envelope; SAND's wide band width signals that sharp directional moves can happen quickly. Fibonacci Retracement levels identify potential support and resistance zones along SAND's path down from ATH.
Fundamental Drivers: Platform Adoption, LAND Sales, and Macro Factors
The technical picture tells you where the market is now. The fundamental picture tells you whether that's justified.
Platform adoption has become the new SAND price anchor in 2026. Daily active users, seasonal event participation, and transaction volumes are replacing pure speculation as the demand driver. The Sandbox's 2026 commitment to having 50%+ of seasonal content user-generated mirrors the Roblox creator model - if it works, it creates a self-reinforcing content flywheel.
LAND NFT demand is the elephant in the room for any SAND bull case. The documented collapse of LAND values - some premium estates that traded above $450,000 at peak are now worth under $1,100 - represents a credibility hit that hasn't fully resolved. LAND sale events still drive SAND purchasing activity, but the virtual real estate investment narrative has been severely damaged.
User-generated content expansion is genuinely differentiated. A platform that successfully transitions to creator-driven content becomes more like infrastructure than entertainment - stickier, more defensible, and less dependent on the platform team shipping new experiences constantly. For a deeper look at how NFT marketplaces function in this context, that background is worth reading alongside this analysis.
Brand partnerships (Adidas, Snoop Dogg, Warner Music Group) provide recurring marketing catalysts. Each new collaboration triggers a news cycle and attracts users who might never have engaged with DeFi or crypto independently.
Macro factors - BTC price direction, Ethereum network conditions, regulatory policy, and interest rate environment - cascade directly into SAND. As a high-beta altcoin, SAND typically amplifies BTC's moves by a factor of 2-3x in both directions.
📊 5 Fundamental Factors Affecting SAND Price in 2026
Platform daily active users and UGC content volume
LAND utilization rates and sale event frequency
The Sandbox NEXT mobile game adoption metrics
Brand partnership announcements and marketing cycles
BTC market cycle position and macro crypto sentiment
Free vs. Algorithmic vs. Expert Analyst Forecasts: Which to Trust?
Not all SAND price predictions use the same methodology, and understanding the differences makes you a better consumer of forecast data.
SAND FORECAST METHODOLOGY COMPARISON
METHODOLOGY
PROS
CONS
BEST FOR
Algorithmic / Quantitative
Systematic, unbiased
Can't model fundamentals
30-90 days
Expert Consensus
Balances tech + fundamentals
Human bias, wide variance
3-12 months
ML-Enhanced
Captures complex patterns
Extreme range uncertainty
Long-term scenarios
The practical takeaway: use algorithmic models for entry timing, expert consensus for medium-term positioning, and ML outputs as a framework for understanding the bull/bear scenario envelope - not as price targets.
SAND Price Red Flags and Risk Factors
Any honest SAND analysis has to confront the risks directly. There are several that stand out above typical altcoin volatility.
⚠ Key Risks Before Buying SAND
LAND collapse → documented ~99.8% value decline from ATH; some estates from $450K to under $1,100
Meta VR retreat → Meta Horizon Worlds shutdown for VR (June 2026) signals sector-wide headwinds
Full token dilution → completing in 2026; removes future scarcity arguments from emission schedules
Regulatory uncertainty → NFT and metaverse token regulation unclear in US and EU
No direct cash flow → speculative asset with no earnings or dividends without staking
Competitive pressure → Decentraland, Axie Infinity, and new centralized gaming alternatives
The LAND collapse deserves specific attention. In 2021, virtual real estate in The Sandbox sold for six-figure sums based on speculative narratives. A documented estate purchased for over $450,000 is now valued around $1,025 - a ~99.8% drawdown. This isn't just a price chart story; it's evidence that the original LAND scarcity narrative hasn't translated into durable demand.
Regulatory uncertainty is real but not unique to SAND. The US SEC's evolving stance on crypto assets, EU's MiCA framework implementation, and varying restrictions on NFT sales all create policy risk that's difficult to price. The direction is toward more regulation, not less - factor that into any long-horizon forecast. You can read more about how cryptocurrency predictions account for macro risk in Zipmex's broader market analysis.
Strategic traders can navigate SAND's volatility by applying the right frameworks - but those frameworks need to account for these specific risks, not just generic crypto market risk.
How to Trade SAND: Strategies for Different Risk Profiles
SAND is a high-beta altcoin - it amplifies market moves, moves fast, and can spend extended periods grinding lower during bear phases. Risk management isn't optional here; it's the foundation of any viable SAND trading approach.
SAND TRADER PROFILE MATRIX
PROFILE
STRATEGY
HORIZON
RISK
KEY TOOLS
Short-term trader
Momentum / breakout
Days to weeks
High
RSI, MACD, ATR-based stops
Swing trader
Mean reversion / trend
Weeks to months
Medium-High
MACD crossovers, Bollinger Bands
Long-term investor
DCA accumulation
1-3+ years
High (conviction req.)
Fundamental catalysts, MAs
DeFi / staking
Passive yield
Ongoing
Medium
Staking pool APY, fee revenue
Popular Trading Strategies for SAND: Day Trading, Swing Trading, and HODL
Each strategy suits a different personality type and market environment. Here's how they map to SAND's specific characteristics.
Day trading exploits SAND's high daily volatility (ATR around 14% of current price). The approach: use RSI for entry signals (buy on dips toward 40, sell on pushes toward 65 in a ranging market) and tight stop-losses placed below the nearest support level. SAND's propensity for sharp intraday reversals means undisciplined day trading gets stopped out frequently - this strategy rewards patience and selectivity over hyperactivity.
Swing trading works better for most retail participants. MACD crossovers signal momentum shifts that typically play out over 3-10 day windows. Bollinger Band extremes - price touching the lower band after a compression phase - provide entry setups with defined risk (stop below the band, target at the midline or upper band). Typical SAND swing trades aim for 15-30% moves with predefined exits.
Trend following requires the 50-day SMA to cross above the 200-day SMA (golden cross) before entering a long position. This signal hasn't triggered as of Q1 2026 - which means trend followers are watching, not buying.
HODLing - long-term accumulation based on conviction in metaverse adoption - carries the highest risk tolerance requirement. Anyone who bought SAND near ATH is still down over 98% years later. A DCA approach spreads entry risk across multiple price levels and is the only approach I'd consider for a multi-year SAND position.
SAND TRADING STRATEGY COMPARISON
STRATEGY
PRIMARY INDICATORS
ENTRY SIGNAL
RISK
BEST MARKET CONDITION
Day Trading
RSI, ATR
RSI dip to 40 in ranging market
Very High
High-volume sideways
Swing Trading
MACD, Bollinger Bands
Bullish MACD crossover + BB squeeze
High
Trending with pullbacks
Trend Following
50-day / 200-day SMA
Golden cross confirmation
Medium-High
Early bull market
HODL / DCA
Fundamental catalysts
Regular interval purchase
High (patience req.)
Long-term accumulation phase
Risk Management for SAND: Position Sizing, Stop-Losses, and Portfolio Allocation
Given SAND's volatility profile, risk management parameters need to be tighter than you'd apply to blue-chip crypto assets.
Position sizing: With an ATR above 14% of price, a single SAND position should not exceed 1-3% of total portfolio value.
EXAMPLE POSITION SIZING CALCULATION
Portfolio Value
$10,000
Max SAND Allocation (2%)
$200
Entry Price
$0.14
SAND Tokens Purchased
1,428 SAND
Stop-Loss at $0.085 (key support zone)
-39% from entry
Max Dollar Loss if Stopped Out
~$78 (0.78% portfolio risk)
Stop-loss placement: Key support zones as of Q1 2026 sit in the $0.079-$0.085 range. Percentage-based trailing stops of 15-20% work for active traders who want to let winners run while capping downside.
Dollar-cost averaging: For long-term positions, DCA across 4-8 purchases over 3-6 months dramatically reduces single-entry risk. If SAND is at $0.14 today and drops to $0.10, a DCA approach lowers your average cost - if the thesis is correct, that's an advantage, not a loss.
⚡ Before Trading SAND: 5-Point Risk Checklist
Position size ≤ 1-3% of total portfolio
Stop-loss defined and placed before entry (not after)
Clear entry thesis with specific catalyst or technical trigger
Exit targets defined in advance (both profit target and stop)
Risk/reward ratio minimum 1:2 before taking the trade
These are educational frameworks, not financial recommendations. Always conduct your own research and consult a licensed financial advisor before making investment decisions.
SAND vs. Competitors: The Sandbox vs. Decentraland vs. Axie Infinity
The metaverse token space isn't a one-horse race. Understanding how SAND compares to its primary competitors helps contextualize the investment thesis - and its risks.
THE SANDBOX VS DECENTRALAND VS AXIE INFINITY
CATEGORY
THE SANDBOX (SAND)
DECENTRALAND (MANA)
AXIE INFINITY (AXS)
Blockchain
Ethereum + Polygon
Ethereum
Ronin (Ethereum sidechain)
Primary Activity
Create & play user-built games
Social / virtual world
Play-to-earn card battles
Creator Tools
VoxEdit, Game Maker (advanced)
SDK (developer-focused)
Limited (gameplay focused)
Mobile Support
NEXT app (launching 2026)
Browser-only
Native mobile app
Brand Partners
Adidas, Warner, Snoop Dogg
Less active partner roster
Sky Mavis ecosystem
Notable Feature
UGC creator economy
Browser-native DAO governance
Ronin network recovery narrative
One sector-level observation: Meta's June 2026 retreat from Horizon Worlds VR created a vacuum in the consumer metaverse space. All three platforms are theoretically positioned to capture displaced user attention - but none has demonstrably done so yet at scale.
SAND Price Prediction: Verdict and Who Should Consider SAND in 2026
After working through the technical signals, fundamental platform data, and multi-source forecast aggregation, here's my honest segmented read.
For short-term traders: The current technical setup - RSI at 56, declining 200-day SMA, no golden cross - doesn't provide a clean directional trade. SAND is in a consolidation phase, and entering without a defined catalyst or technical trigger is speculation on noise, not signal. Wait for MACD to deliver a confirmed bullish crossover, or for RSI to pull back toward the 40 zone before momentum reversal setups emerge.
For long-term metaverse believers: The DCA accumulation case at current levels has a legitimate risk/reward profile - IF you have a genuine multi-year horizon and conviction in platform adoption. SAND at $0.14 with a 2030 bull case of $3-$5 represents substantial return potential, with the understanding that the bear case ($0.28 by 2030) is also a credible scenario. Limit allocation to 1-3% of portfolio and apply stop discipline.
For risk-averse investors: SAND's volatility profile, LAND value collapse, and 96%+ decline from ATH make it unsuitable as a core holding for conservative portfolios. There are more asymmetric risk/reward opportunities in the crypto space if on-chain yield and fee-generated returns are your primary goal - platforms that generate real yield from trading activity and platform fees rather than token emissions represent a structurally different risk profile worth considering as the other side of a diversified crypto allocation.
🟡 SHORT-TERM TRADER
Caution - wait for cleaner technical confirmation (MACD crossover, RSI pullback to 40) before entry
🟢 LONG-TERM BELIEVER
DCA at small allocation (1-3%) with defined stop-loss; multi-year horizon required
🔴 RISK-AVERSE INVESTOR
Not recommended as a primary holding - unsuitable for low-volatility portfolio objectives
The Sandbox NEXT mobile launch, UGC season expansion, and post-dilution tokenomics are legitimate 2026 catalysts. Execution risk is real. The honest forecast isn't "SAND will recover to $8.40" - it's "SAND could generate meaningful returns from current levels if platform adoption gains traction, with significant downside risk if it doesn't."
This article is for informational purposes only and does not constitute financial advice. Cryptocurrency investments carry substantial risk of loss. Past price performance does not guarantee future results. Always conduct independent research and consult a licensed financial advisor before making investment decisions.
Last updated: March 2026.
Frequently Asked Questions
What is the current price of SAND crypto?
SAND is currently trading at approximately $0.14, placing it more than 98% below its November 2021 all-time high of $8.40. The current price reflects a combination of broader crypto market conditions, the collapse of the LAND NFT market, and reduced speculative interest in the metaverse sector. Always verify the live price on a regulated exchange or price tracking platform before executing any transaction - crypto prices fluctuate continuously, often by double-digit percentages within single sessions.
What is the SAND price prediction for 2026?
The 2026 SAND price prediction consensus range from aggregated analyst models sits at $0.18-$0.36, with a mid-point around $0.26. Bullish outliers reach $0.88 on models pricing in significant altcoin market re-rating. CoinCodex's algorithmic model leans toward the lower end given its bearish 200-day SMA reading, while Benzinga and DigitalCoinPrice cluster at $0.23-$0.36. Key 2026 catalysts include The Sandbox NEXT mobile launch, completion of full token dilution, and UGC season expansion.
What is the SAND price prediction for 2030?
The 2030 SAND price prediction spans from $0.28 (bearish CoinCodex extrapolation) to $5.69 (CoinPedia bull case), with mid-consensus around $0.72-$1.63. That 15x spread between floor and ceiling is the most honest answer available - five-year crypto forecasts carry fundamental uncertainty that no model resolves. Treat 2030 targets as scenario planning tools: the $0.28-$0.64 zone represents "platform matured but limited adoption," while $3-$5 represents "metaverse gaming went mainstream." By 2030, fundamentals - DAUs, transaction volume, creator revenue - will matter far more than current speculative narratives.
Will SAND reach $1 again?
SAND reaching $1 is within the forecast range of multiple analyst sources, though none project it as a near-term 2026 outcome. The consensus places $1+ recovery in the 2027-2029 window, contingent on a broad crypto bull market and demonstrable The Sandbox platform growth. From SAND's current price near $0.14, reaching $1 represents a 7x increase - achievable in a genuine altcoin bull market cycle, but dependent on sustained platform fundamentals improving alongside favorable macro conditions. Conservative models don't project SAND back above $1 within the current 2026-2027 forecast window.
What are the biggest risks of investing in SAND?
SAND carries multiple distinct risk categories: market risk (high-beta altcoin that amplifies crypto market declines), platform risk (if The Sandbox fails to grow active users, token utility demand stagnates), LAND collapse narrative risk (near-total collapse of LAND valuations has damaged the platform's investment story), regulatory uncertainty (evolving NFT and token regulation in the US and EU), supply risk (full token dilution completing in 2026 removes scarcity from emission schedules), and competition from Decentraland, Axie Infinity, and centralized gaming alternatives.
How does SAND staking work?
Staking SAND deposits your tokens into a protocol pool on either Ethereum mainnet or Polygon, in exchange for a proportional share of platform fee revenue. The Sandbox charges a 5% fee on all NFT transactions, and half goes directly to the staking rewards pool - so staking yield is tied to platform transaction volume, not token emission. Staking on Polygon offers significantly lower gas costs than Ethereum mainnet for the same underlying yield, making it the more cost-efficient choice for most holders. No mandatory lockup exists, though some pool configurations incentivize longer commitments with bonus NFT rewards.
How does The Sandbox compare to Decentraland (MANA)?
Both platforms share Ethereum blockchain foundations and virtual world concepts, but diverge significantly in execution. The Sandbox emphasizes creator tools (VoxEdit, Game Maker) and brand partnerships, targeting a gaming demographic. Decentraland is browser-accessible without a download and has stronger DAO governance, attracting a community-focused user base. The Sandbox has a larger reported active user base and more active brand partnership roster; Decentraland's MANA token has experienced similar valuation compression since 2021. Neither platform has achieved mainstream consumer adoption at scale as of early 2026.