
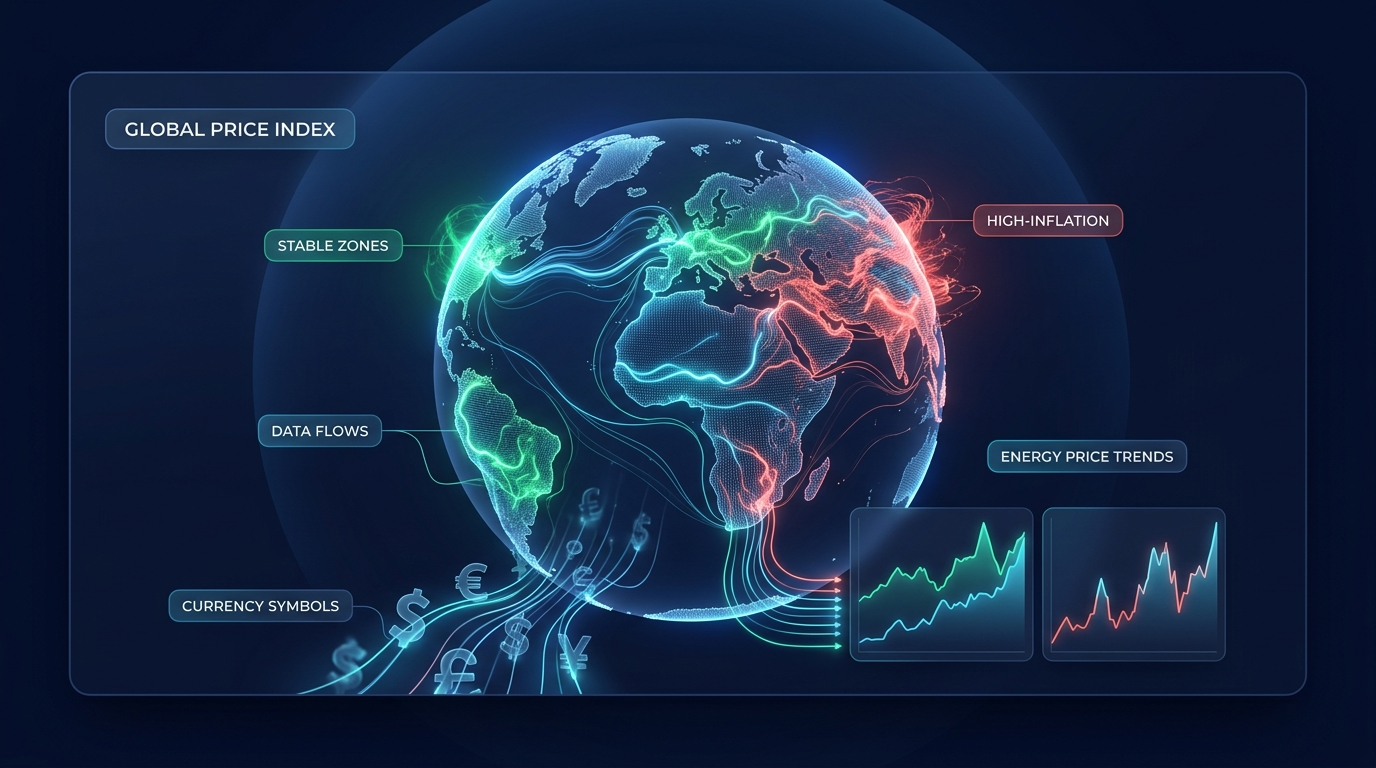
Global inflation just got repriced - hard. The IMF's April 2026 World Economic Outlook revised headline inflation up to 4.4%, a 0.6 percentage-point jump from its January baseline, driven almost entirely by the Middle East conflict and surging energy costs. For anyone tracking purchasing power, portfolio strategy, or crypto market dynamics, this shift matters.
This guide breaks down what global inflation actually is, why 2026 looks the way it does, how central banks are responding across diverging regions, and - critically - which asset classes have historically preserved value when fiat currency loses its grip.
⚡ Key Takeaways
- Global headline inflation is running at 4.4% in 2026 (IMF reference scenario), up from a 2026 trough of 2.6%
- The primary 2026 driver: energy price shock from the Middle East conflict and partial Strait of Hormuz disruption
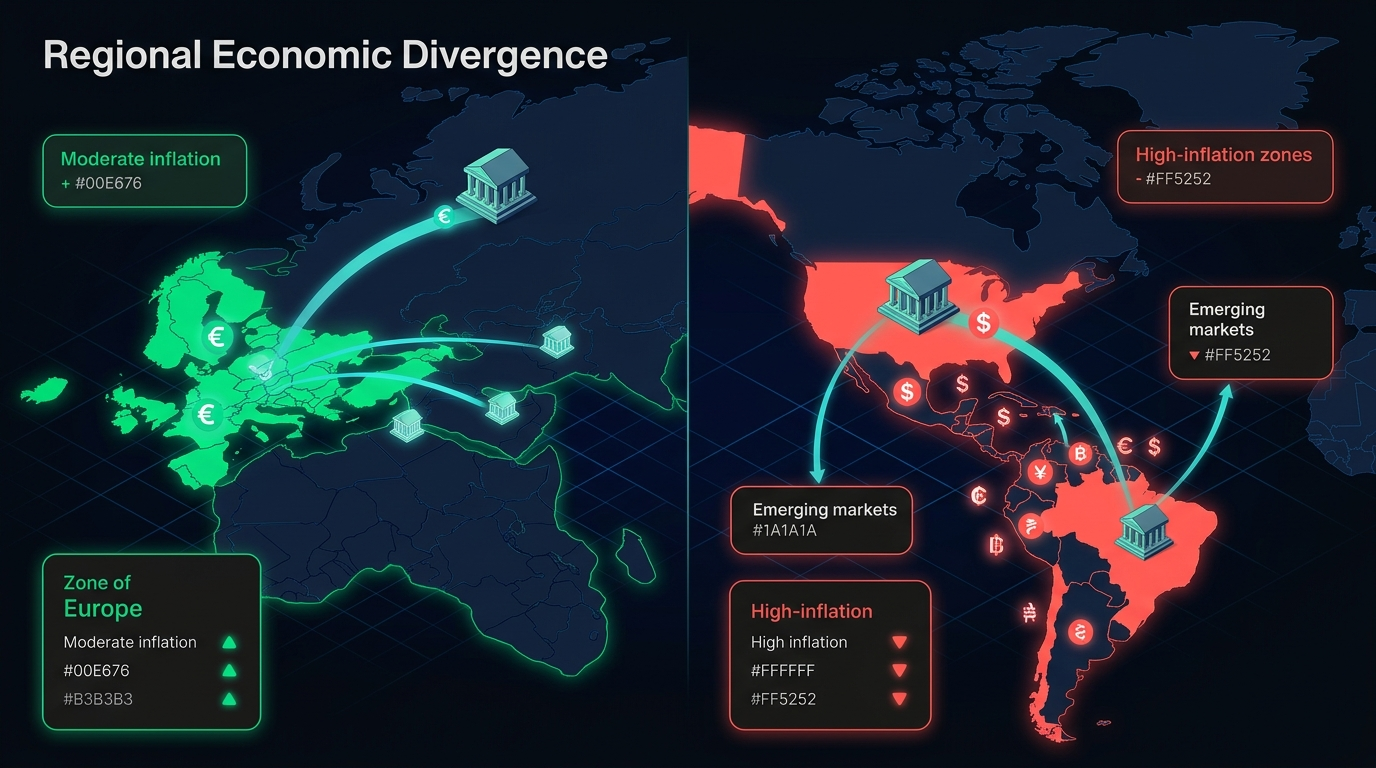
- US inflation is accelerating above 3% while European inflation is moderating - the largest regional divergence in years
- Central banks are largely on hold: the Fed at 3.50-3.75%, the ECB paused at 2.0%
- Best-performing inflation hedges: gold, Bitcoin (BTC), real estate, and TIPS - each with different risk profiles and time horizons
What Is Global Inflation? Definition, Measurement & Why It Matters
Global inflation describes the broad, sustained rise in price levels across the world's major economies - not a local price spike, but a systemic trend affecting the purchasing power of currencies from the US dollar to the euro to emerging market currencies simultaneously. When global inflation runs hot, the real value of cash savings erodes, debt-financed assets get repriced, and the macro backdrop for every investment class shifts.
The primary measurement tool is the Consumer Price Index (CPI) - a basket of goods and services (food, housing, energy, healthcare, transport) tracked monthly by national statistics agencies. CPI captures what households actually pay. Core inflation strips out food and energy - the two most volatile components - to reveal the underlying trend that central banks actually care about when setting interest rates.
Policymakers - from the Fed to the ECB - anchor rate decisions to core CPI rather than headline, because energy price shocks are largely outside their control. That distinction matters enormously for understanding 2026: much of the current inflation shock is headline-driven by oil prices, which means monetary policy has limited leverage over it.
How Global Inflation Is Generated: Supply Shocks, Demand Surges & Monetary Expansion
Three mechanisms drive inflation - and knowing which one is dominant changes everything about how you should respond to it.
Demand-pull inflation happens when aggregate spending outpaces an economy's production capacity. The clearest recent example: the 2021-2022 post-COVID spending surge. Households flooded back into consumption faster than supply chains could recover, driving US CPI to 9.1% by June 2022. Central banks can fight this directly by raising rates and cooling demand.
Cost-push inflation originates on the supply side - a production shock raises input costs, which producers pass downstream. The Strait of Hormuz disruption in early 2026 is a textbook case: roughly 20% of the world's oil and LNG transits that chokepoint. Restrict the flow, and energy costs ripple through transportation, agriculture, and manufacturing globally. Rate hikes can't reopen a blocked strait.
Built-in inflation - the wage-price spiral - is the most dangerous because it self-reinforces. Workers demand higher wages to keep up with rising prices; employers raise prices further to cover labour costs. Advanced economies avoided this trap in the 2021-2022 episode largely because inflation expectations stayed anchored. Whether that holds in 2026 is one of the key macro questions.
- Supply shock → sudden reduction in output capacity or increase in input costs (oil embargo, pandemic supply chains, armed conflict)
- Demand surge → stimulus, low rates, or pent-up consumption exceeding supply capacity
- Monetary expansion → money supply growing faster than real economic output, weakening currency unit value (the quantity theory of money)
World Bank research confirms that oil price shocks and global demand shocks have driven roughly 65% of total global inflation variation since 2001. Supply chain shocks, while dramatic, account for closer to 13% - significant, but secondary.
Historical Context: From the 1970s Stagflation to the 2021-2022 Pandemic Surge
Understanding how we got here requires a quick walk through the last 50 years of global inflation cycles.
1973-1982: The first OPEC oil shock triggered cost-push inflation across advanced economies that rapidly morphed into a wage-price spiral. US CPI peaked near 14% in 1980. Central banks eventually broke inflation's back through extremely aggressive tightening - the Volcker shock in the US raised rates above 20%.
1990-2019: The great moderation. Globalisation kept goods prices structurally low as production migrated to the lowest-cost suppliers. Central banks gained credibility. Inflation ran persistently below 2% targets across most developed markets, forcing QE and negative rates to generate any price pressure at all.
2020-2022: The pandemic surge. Global median inflation collapsed to 1.9% in 2020 as economies shut down, then surged to 8.7% by Q3 2022 - the highest level since the mid-1990s. Oil price shocks and demand rebounds hit simultaneously, amplified by supply chain dislocations that took longer than most economists predicted to resolve.
2023-2026: Disinflation, then interruption. Aggressive monetary tightening worked - median global inflation fell steadily, reaching 2.6% by Q2 2026. Then the Middle East conflict triggered a new energy shock, pushing the IMF to revise headline inflation back up to 4.4% for 2026.
GLOBAL INFLATION TIMELINE
1973
Oil shock → Wage-price spiral → US CPI peak ~14% (1980)
1982
Volcker tightening breaks the inflation cycle
1990s-2019
Great Moderation - below-target inflation, globalisation, QE era
Q3 2022 - PEAK
Pandemic surge peaks at 8.7% global median - highest since mid-1990s
Q2 2026
Disinflation trough: 2.6% global median
2026 - CURRENT
Energy shock uptick: IMF baseline 4.4% - geopolitical, not monetary origin
The key pattern: external energy shocks - not domestic monetary policy failures - initiate most global inflation spikes. That's exactly what 2026 looks like.
Global Inflation in 2026: Regional Breakdown and Current Data
The IMF's April 2026 World Economic Outlook is the definitive data source here. Headline figure: 4.4% global inflation for 2026, up 0.6 percentage points from the January forecast. But that aggregate masks radically different stories across regions.
The IMF modelled three scenarios based on the scale of conflict disruption:
J.P. Morgan's February 2026 forecast (pre-conflict escalation) had projected stable global core CPI at 2.8%, with regional divergences already emerging. The April IMF update layers an energy-driven shock on top of that existing divergence picture.
United States and Americas - Accelerating Above Target
The US enters 2026 as the developed-world inflation outlier - not because of energy alone, but because of compounding structural factors.
Tariff pass-through is materialising. The 2026 tariff front-loading muted immediate consumer price effects, but the downstream pass-through is hitting retail prices in 2026. Services inflation remains sticky. And the goods price disinflation that helped Europe moderate simply hasn't arrived in the same way for American consumers.
J.P. Morgan flagged the divergence explicitly in their February 2026 research: US inflation is expected to accelerate above 3% year over year as an early-year rebound combines with persistent goods price pressures. The Fed held rates at 3.50-3.75% at its March 2026 meeting, with Chair Powell noting it was "too soon to gauge the full impact of the Middle East conflict."
Latin America is a split picture. Brazil, as a net energy exporter, is actually benefiting from higher oil prices. Argentina remains a structural hyperinflation case in a category of its own. Mexico faces USMCA uncertainty as an additional headwind.
Europe, UK and Advanced Economies - Disinflation Interrupted
Western Europe had been the global disinflation success story heading into 2026. The ECB cut rates eight times between June 2024 and June 2026, bringing its deposit rate from 4% to 2.0%. Wage inflation was clearly moderating across the region. The J.P. Morgan baseline projected European goods prices declining to push eurozone inflation to 2% by mid-year.
The Middle East conflict interrupted that trajectory. The ECB held rates at 2.0% in March 2026 - not cutting further - citing near-term energy inflation upside. Eurozone inflation for 2026 now looks more like 1.9-2.1%, barely at target rather than comfortably below it. Should the conflict broaden (adverse scenario), European disinflation could reverse entirely.
UK dynamics are somewhat independent: CPI ran at 3.0% in January 2026, and the Bank of England now expects it to run between 3-3.5% for the next couple of quarters due to energy costs. The BoE is tilting dovish - labour market weakness is pushing toward cuts - but the energy shock complicates timing.
Japan is the notable outlier among advanced economies: wage inflation is clearly moving higher. The Bank of Japan is slowly raising rates from its long-held below-zero baseline - a tightening cycle that contrasts sharply with the dovish stance elsewhere in developed markets.
Emerging Markets and Developing Economies - The Most Vulnerable
This is where 2026's inflation story gets genuinely concerning. The IMF is direct: the slowdown in growth and increase in inflation "will be particularly pronounced in emerging market and developing economies." Low-income commodity importers are caught in the worst position - paying more for energy and food imports while lacking the fiscal space to absorb the shock.
Sub-Saharan Africa faces a compounding crisis: median inflation projected to climb from 3.4% in 2026 to 5% in 2026, against a backdrop of bilateral aid cuts of 16-28%. Countries that were already running thin fiscal buffers now face debt servicing costs that eat a growing share of already-strained budgets.
The IMF's April 2026 WEO also issued a significant global debt warning: elevated public debt globally limits governments' capacity to respond to future shocks, and in the most vulnerable cases, creates structural inflation risk if debt dynamics force monetisation.
⚠ IMF Downside Risk Warning
- Reference scenario: → 4.4% inflation, 3.1% growth - limited conflict, manageable energy shock
- Adverse scenario: → 5.4% inflation, 2.5% growth - broader conflict, tighter financial conditions
- Severe scenario: → 6%+ inflation, 2.0% growth - extended energy disruptions into 2027
Countries with preexisting vulnerabilities - high debt, commodity-import dependency, weak currencies - face the worst risk amplification under the adverse and severe scenarios. Understanding how Bitcoin's macro correlation shifts during geopolitical shocks matters here: crypto assets are not immune to the broader risk-off dynamics that accompany elevated global inflation.
How Central Banks Are Responding to Global Inflation in 2026
Central banks are in a difficult position right now. The dominant inflation driver in 2026 is an energy price shock originating from a geopolitical conflict - and that's precisely the type of inflation that interest rate tools are poorly designed to address.
Raising rates reduces demand, which can cool demand-pull inflation. But it can't reopen the Strait of Hormuz or reverse a 19% oil price shock. The IMF framed this trade-off directly: central banks are caught "between fighting inflation and preserving growth" - and tightening into an energy-shock-driven slowdown risks destroying demand without resolving the underlying supply problem.
The ECB's Transmission Protection Instrument (TPI) - a bond purchase tool designed to prevent disorderly market dynamics in individual eurozone countries - remains in the background as a risk-management backstop if the conflict drives yield spreads wider in Southern Europe.
The policy lesson from 2021-2022 that most central banks have internalised: credibility is the most valuable asset. Inflation expectations stayed anchored during the pandemic surge - that's why the wage-price spiral didn't fully develop. Maintaining that credibility through the 2026 shock means not cutting prematurely, even when growth is softening.
Understanding what central banks can and can't do about current inflation directly shapes how individuals and investors should position themselves.

How to Protect Yourself from Global Inflation: Investment Strategies
When global inflation runs above central bank targets and monetary policy tools are constrained by geopolitical origins, the real question becomes: which assets hold their value?
Four asset classes have historically preserved purchasing power during inflationary regimes. Each works through a different mechanism - and each carries different risk characteristics.
No single asset dominates across every inflation scenario. The inflation type matters as much as the rate.
Bitcoin as a Hedge Against Global Inflation: The Case For and Against
Bitcoin's inflation-hedge thesis rests on a mathematical foundation: there will only ever be 21 million BTC. No central bank can authorise a supply expansion. No government can debase it through quantitative easing. The issuance schedule is programmed - approximately every four years, the halving event cuts the rate of new supply in half, making Bitcoin progressively more disinflationary over time.
Contrast that with every major fiat currency: the US Federal Reserve targets 2% annual inflation, the ECB targets 2%, and nearly every central bank on earth runs a similar policy. That means every major currency is designed to lose purchasing power over time. Bitcoin's supply schedule doesn't work that way.
The case for Bitcoin as an inflation hedge:
- Fixed 21 million supply - no monetary authority can expand it
- Halving schedule creates programmatic disinflation (issuance rate drops ~50% every ~4 years)
- Operates outside the banking system - immune to quantitative easing and monetary debasement
- The IMF's April 2026 global debt warning has renewed institutional interest in BTC as a macro hedge - elevated sovereign debt globally increases tail risk for fiat currencies
- Borderless and self-custodial - functions as inflation protection in any jurisdiction, including high-inflation EM economies
The case against (honest assessment):
- High short-term volatility - BTC has historically correlated with risk assets during acute market stress, undermining near-term hedge effectiveness
- Regulatory uncertainty varies significantly across jurisdictions
- Track record as an inflation hedge is shorter than gold's multi-century history
- Correlation with equity markets weakens the "uncorrelated asset" narrative in crisis periods
The honest read: Bitcoin is a compelling long-term store of value in a world of persistent monetary debasement. Short-term, it's a high-volatility asset that requires position sizing appropriate to that risk profile. Self-custodial platforms that allow verifiable on-chain holdings eliminate the counterparty risk that has burned crypto holders through centralised exchange failures. If you're considering accumulating BTC during the current macro downturn, position sizing and timing methodology matter as much as the asset selection itself.
Crypto trading and investment involves substantial risk of loss. Bitcoin's volatility means short-term value can decline significantly. This section is informational, not financial advice.
Traditional Inflation Hedges: Gold, Real Estate, TIPS & Commodities
Bitcoin's emergence as a macro hedge doesn't displace the traditional toolkit - it complements it. Each conventional inflation hedge works through a distinct mechanism.
Gold has a 5,000-year track record as a store of value. It performs best during two specific conditions: periods of negative real interest rates (when inflation exceeds the nominal yield on savings) and periods of geopolitical stress - both of which describe 2026. The 1970s are instructive: gold appreciated dramatically throughout a decade of energy-shock-driven stagflation.
TIPS (Treasury Inflation-Protected Securities) are US government bonds with principal indexed directly to CPI. If CPI rises 4.4%, the principal of a TIPS bond rises by 4.4%. This is the most direct, mechanical inflation protection available - no correlation assumptions required, no volatility to manage. The trade-off: real yields on TIPS are often low or slightly negative, meaning you're paying for protection rather than generating growth.
Real estate works as an inflation hedge through two channels: the replacement cost of physical assets rises with construction inflation, and rental income tends to increase with broader price levels. The catch is the lag - unlike gold or Bitcoin, real estate reprices gradually. A 2026 energy shock doesn't instantly translate to higher property values.
Commodities carry the interesting property of being correlated with the cause of 2026's inflation - oil prices are up because of the Middle East conflict, and commodity exposure captures that upside. The risk: commodity positions are highly volatile, require active management, and can reverse sharply if the conflict resolves faster than expected.
📊 4 Traditional Inflation Hedges & When They Work Best
- Gold: Best when real rates are negative and/or geopolitical stress is elevated - both conditions present in 2026
- TIPS: Best for capital preservation in any inflationary regime - low risk, low real return, maximum CPI indexation
- Real Estate: Best for long-term (3-10 year) inflation protection; poor short-term hedge due to illiquidity and repricing lag
- Commodities: Best when inflation is supply-side driven (oil, food) and the underlying shock persists - high volatility, active management required
One nuance worth naming: Bitcoin and gold are best suited for monetary debasement inflation (excess money supply, fiscal monetisation). Real assets like real estate and commodities are better matched to cost-push inflation (supply shocks raising physical production costs). In a complex 2026 environment where both mechanisms are operating simultaneously, diversification across the toolkit is more defensible than concentration in any single hedge.

Key Indicators to Monitor Global Inflation
Staying ahead of the inflation cycle doesn't require a PhD in macroeconomics. Seven numbers tell most of the story - track these, and you'll have better macro situational awareness than most retail investors.
- CPI (Consumer Price Index) - the headline inflation number. Published monthly by national statistical agencies (BLS.gov for the US, Eurostat for the EU). Headline CPI includes food and energy, making it the most visible public measure. Watch for month-over-month trends rather than single readings.
- Core CPI - strips out food and energy volatility. This is what central banks actually respond to. A persistent rise in core CPI (above 2.5-3% in developed markets) signals structural inflation that monetary policy will address.
- PPI (Producer Price Index) - measures price changes at the producer/wholesaler level, before goods reach consumers. PPI leads CPI by roughly 2-6 months - when input costs rise for manufacturers, those costs typically pass through to retail prices within that window.
- PCE (Personal Consumption Expenditures) - the Federal Reserve's preferred inflation measure, due to its broader coverage of consumption patterns. The Fed explicitly targets 2% PCE inflation.
- Breakeven inflation rate - derived from the yield spread between nominal US Treasury bonds and TIPS of the same maturity. If the 10-year nominal Treasury yields 4.5% and the 10-year TIPS yields 1.5%, the breakeven rate is 3.0% - meaning markets expect 3% average inflation over the next decade. Track daily on FRED.
- Oil / energy prices - in 2026 specifically, oil prices are the leading indicator for near-term headline inflation globally. The Strait of Hormuz disruption and Middle East conflict are the proximate causes of the current inflation uptick - tracking Brent crude and LNG spot prices gives direct early warning.
- Wage growth data - particularly average hourly earnings (AHE) in the US and wage tracker data in Europe. Rising wages fuel built-in inflation through the wage-price spiral. If labour markets stay tight and wages keep growing faster than productivity, core inflation becomes harder to reduce.
Global Inflation Risks: What Could Push Prices Higher or Lower in 2026
The IMF is explicit: "downside risks dominate the outlook." That doesn't mean inflation inevitably worsens - it means the distribution of possible outcomes is skewed toward more damage, not less. Here's the honest risk map.
↑ UPSIDE INFLATION RISKS (HIGHER)
- Middle East conflict broadens - Iran expands attacks on energy infrastructure
- Strait of Hormuz fully closed - oil/LNG disruption becomes severe
- Trade tensions escalate - new tariff waves or USMCA breakdown
- Global debt dynamics force monetisation - EM governments inflate debt away
- Wage-price spiral develops - anchored expectations become unanchored
↓ DOWNSIDE / DEFLATIONARY RISKS (LOWER)
- Rapid conflict resolution - ceasefire and Strait of Hormuz reopens
- AI-driven productivity surge - supply-side deflationary force materialises
- Demand destruction - monetary policy overtightens, triggering recession
- European wage disinflation accelerates - services inflation falls faster
- China demand weakness deepens - deflationary pressure exports globally
The energy picture is the dominant variable. J.P. Morgan's pre-conflict baseline had US-Europe inflation diverging with global core remaining stable at 2.8%. That divergence still exists in 2026 - it's just overlaid with an energy shock that affects everyone, with EM economies bearing the heaviest burden.
One underappreciated risk: the CFR Global Inflation Tracker notes that services inflation in advanced economies has remained persistently elevated even as goods disinflation has progressed. This structural stickiness means that even if the Middle East conflict resolves and energy prices normalise, inflation may not return to the 2026 trough of 2.6% quickly. Services inflation is driven by labour costs - and that won't flip overnight.
On the disinflation side, the AI productivity wildcard is genuinely interesting. The IMF April 2026 WEO cites potential AI disappointment as a downside growth risk - but the flip side is that if AI delivers on its productivity promise, it functions as a supply-side deflationary force: more output per worker hour means less cost-push pressure across the economy.

Conclusion: What Global Inflation Means for You in 2026
The 4.4% global headline inflation rate in 2026 is not a repeat of 2022's pandemic surge - it's a geopolitically-driven energy shock layered on top of existing regional divergences. That distinction matters for how you respond to it.
For general consumers: Purchasing power protection is the immediate priority. Energy bills and food prices will remain elevated through at least mid-2026 under the IMF's reference scenario. Inflation-linked savings products and I-bonds offer low-risk protection for cash holdings. Track CPI monthly - when you see core CPI stabilising or falling, the central bank easing cycle accelerates.
For investors: Portfolio positioning toward hard assets is the dominant institutional response to the current environment. Gold for geopolitical stability and negative real rate environments. TIPS for direct CPI indexation with minimal risk. Real estate for long-term inflation absorption. Bitcoin for exposure to the monetary debasement narrative - a thesis reinforced by the IMF's April 2026 global debt warning, which flagged elevated sovereign debt as a structural vulnerability for fiat currencies. Diversification across these asset classes - rather than concentration in one - provides more durable protection given the uncertainty across scenarios.
For business operators: Input cost monitoring is critical right now. Energy-intensive operations and those with global supply chains are most exposed. Long-term supply contracts that lock in prices provide a hedge against further energy escalation. Labour cost management matters too - the wage-price spiral risk may be contained currently, but it's the mechanism most likely to extend the inflation cycle beyond the energy shock.
The overarching trajectory depends on whether the Middle East conflict remains limited in duration and scope (reference scenario) or broadens into the adverse or severe cases. That's a geopolitical variable, not a monetary one - which is exactly why central banks are on hold rather than acting aggressively.
Platforms built on self-custody and on-chain verifiability reflect where the crypto market's structural response to monetary uncertainty leads: toward assets and systems where supply is transparent, rules are enforced by code, and no central authority can expand issuance at will. Whether the current inflation cycle proves short-lived or persistent, the case for hard-money digital assets as a component of a diversified portfolio grows alongside each IMF debt warning.
Stay current on the IMF World Economic Outlook updates, the CFR Global Inflation Tracker, and central bank meeting minutes - these three sources will give you the earliest signal if 2026's inflation trajectory shifts.
Crypto trading and DeFi activities involve substantial risk of loss. Leveraged positions and on-chain assets can decline significantly in value. Nothing in this article constitutes financial advice or a recommendation to buy or sell any asset. Always conduct your own research and consider your risk tolerance before making investment decisions.
Last updated: April 2026.
Frequently Asked Questions
What is global inflation?
Global inflation refers to a broad, sustained increase in price levels across the world's major economies simultaneously - not isolated local spikes, but a systemic trend affecting purchasing power internationally. It's typically measured through the Consumer Price Index (CPI), which tracks a basket of goods and services over time. When global inflation rises, the real value of cash holdings erodes, debt-financed assets reprice, and investment strategy shifts accordingly. The key distinction: a one-month price spike in a single country doesn't constitute global inflation - a multi-quarter, multi-country trend does.
What is the current global inflation rate in 2026?
The IMF's April 2026 World Economic Outlook revised global headline inflation to 4.4% for 2026, up 0.6 percentage points from the January baseline. This revision was driven primarily by the Middle East conflict and the resulting energy price shock - approximately +19% oil prices in the reference scenario. J.P. Morgan's February 2026 forecast had projected stable global core CPI at 2.8%, reflecting a world before the conflict escalation. The current 4.4% represents a meaningful interruption of the 2023-2026 disinflation trend, which had brought median global inflation down from 8.7% in Q3 2022 to 2.6% by mid-2026.
Why is global inflation rising in 2026?
The primary driver is the Middle East conflict, which triggered a partial Strait of Hormuz disruption. Roughly 20% of global oil and LNG supply transits that chokepoint - restricting that flow directly raises energy costs worldwide, which propagate through transportation, agriculture, and manufacturing within weeks. Secondary drivers include US tariff pass-through (2026 tariff costs materialising at the consumer level), sticky services inflation in advanced economies, and persistent wage growth in some labour markets. Unlike the 2021-2022 episode which was demand-pull driven, 2026's inflation is predominantly cost-push - which limits the effectiveness of rate hikes as a policy response.
Is Bitcoin a good hedge against global inflation?
Bitcoin's long-term inflation hedge case is compelling - its fixed supply of 21 million coins, programmatic halving schedule, and independence from central bank monetary policy create a mathematical resistance to the monetary debasement that drives long-term fiat inflation. The IMF's April 2026 global debt warning has renewed institutional interest in BTC as a macro hedge. Short-term, however, Bitcoin remains highly volatile and has historically correlated with risk assets during acute market stress - meaning it can decline significantly precisely when a geopolitical shock is also hitting portfolios. Bitcoin is a credible long-term hard-money asset, but its short-term hedge effectiveness is unreliable. Substantial risk of loss applies.
What are the best investments to protect against inflation?
No single asset dominates across every inflation scenario. For monetary debasement and long-term fiat currency weakness: Bitcoin and gold have historically performed well, with Bitcoin offering higher upside and volatility, gold offering lower volatility and a multi-century track record. For direct CPI indexation with minimal risk: TIPS (Treasury Inflation-Protected Securities) provide mechanical inflation protection. For long-term value preservation: real estate tends to reprice upward in inflationary environments, though with significant liquidity constraints. For short-term correlation with the inflation driver itself: commodity exposure captures energy price upside, but carries high volatility. Diversification across these asset classes is generally more robust than concentrating in any one.
What is the difference between headline inflation and core inflation?
Headline inflation captures the full CPI basket including food and energy prices - it's what you feel at the petrol station and grocery store. Core inflation excludes food and energy because those categories are highly volatile and often driven by global supply shocks rather than domestic monetary conditions. Central banks like the Fed and ECB set interest rate policy based primarily on core inflation, because it better reflects the underlying structural price trend they can actually influence. In 2026, the gap between headline (elevated due to energy) and core is a key policy complication - the energy shock is visible in headline figures, but monetary policy responds to core.
How do central banks control inflation?
Central banks primarily manage inflation through interest rate policy - raising rates makes borrowing more expensive, reduces consumer spending and business investment, and slows demand growth. Open market operations (buying or selling government bonds) provide a secondary tool. Forward guidance - communicating clearly about future rate intentions - influences inflation expectations directly, because expectations themselves drive wage negotiations and pricing decisions. The critical insight from 2021-2022: keeping inflation expectations anchored is as important as the rate moves themselves. The key 2026 limitation: rate hikes can't restore oil supply or reopen a shipping chokepoint - which is why all major central banks are currently on hold rather than tightening.
