
A golden cross is one of the most-watched signals in technical analysis - a bullish chart pattern that forms when a short-term moving average crosses above a long-term moving average. If you've spent any time in crypto or equity markets, you've almost certainly heard traders react when one occurs. But understanding what is a golden cross, how to use it, and - critically - when it fails, separates informed traders from those chasing headlines.
This guide covers the mechanics, the strategies, the limitations, and the data behind the signal.
⚡ Key Takeaways
- A golden cross forms when the 50-day moving average (MA) crosses above the 200-day MA, signaling a potential shift from bearish to bullish momentum.
- It is a lagging indicator - the crossover only confirms price action that has already occurred, not future price direction.
- In crypto markets, shorter MA periods (e.g., 20-hour / 50-hour) are often used to account for higher volatility.
- The golden cross works best when confirmed by complementary indicators such as RSI, MACD, or volume analysis.
- False signals occur in roughly 1 in 3 cases - risk management is non-negotiable regardless of the signal's reputation.
What Is a Golden Cross? Definition and Core Mechanics
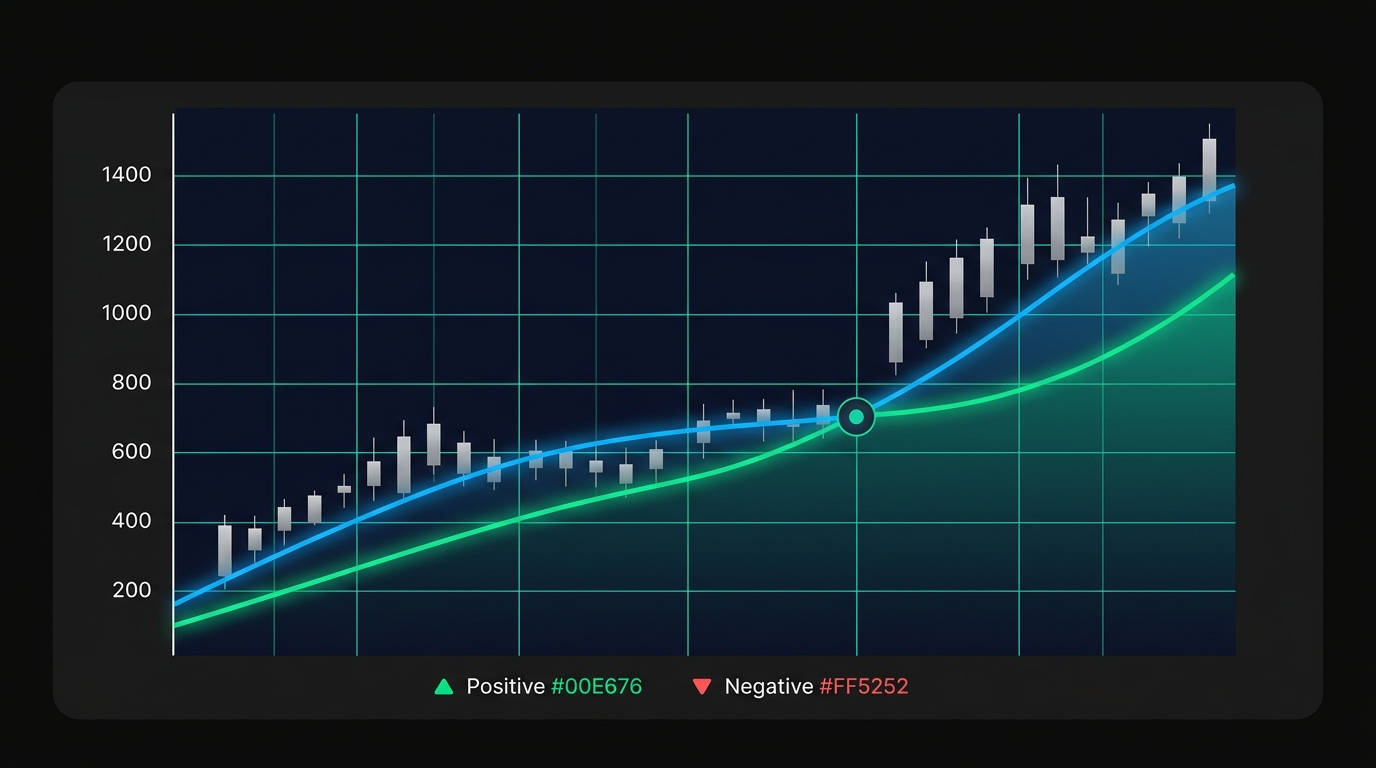
A golden cross occurs when a shorter-term moving average - most commonly the 50-day MA - crosses above a longer-term moving average, typically the 200-day MA. The pattern is recognized across virtually every asset class: stocks, crypto, forex, commodities. When it appears on a chart, it tells traders that short-term buying momentum has become strong enough to outpace the longer-term price trend.
A moving average (MA) is simply the average closing price of an asset over a defined number of days, recalculated with each new candle. The 50-day MA reflects the last 50 days of price data - it moves faster, reacts sooner, and follows recent trends more closely. The 200-day MA incorporates nearly a full year of price history - it moves slower, smooths out noise, and represents long-term market consensus. When the faster line rises through the slower one, the golden cross is confirmed.
One thing I want to be direct about upfront: the golden cross is a lagging indicator. It doesn't predict a rally before it starts - it confirms that enough buying pressure has already accumulated to flip the short-term trend above the long-term baseline. That distinction matters enormously for how you use it.
The Three Stages of a Golden Cross
The golden cross doesn't happen instantaneously. It develops through three distinct phases, and understanding each one helps you identify where you are in the setup:
- Stage 1 - The Downtrend: The 50-day MA sits below the 200-day MA. Price has been declining or consolidating. Sellers are in control of the near-term narrative, and the chart shows that recent momentum has underperformed the longer historical average.
- Stage 2 - The Crossover: The 50-day MA rises through and above the 200-day MA. This is the actual golden cross event - the moment traders watch for. High trading volume at the point of crossover strengthens the signal considerably. A cross that happens on thin volume is far less reliable than one accompanied by a surge in buying activity.
- Stage 3 - The Confirmed Uptrend: The 50-day MA holds above the 200-day MA, and both lines begin trending upward together. In this phase, both MAs transition from resistance levels to dynamic support - meaning pullbacks to the 50-day or 200-day lines are often buying opportunities rather than breakdown signals.
Understanding that volume confirms the crossover is a detail that often gets glossed over. A low-volume golden cross in a sideways market can be noise. A high-volume cross following a sustained downtrend is a materially different signal.
Golden Cross in Crypto vs. Traditional Markets
The golden cross works across asset classes, but crypto requires specific calibration.
In traditional equity markets, the 50-day and 200-day MA pairing is essentially universal. Stocks are open for roughly 6.5 hours per trading day, and volatility - while meaningful - moves within recognizable bounds. The standard timeframes reflect decades of institutional habit, and that collective attention reinforces the signal's weight.
Bitcoin trades 24/7 across global exchanges, and intraday volatility can be substantially higher than what stock traders encounter. This means the standard 50/200-day cross on a crypto daily chart may still be valid - many institutional traders use exactly this setup for BTC and ETH - but shorter-period configurations are also common.
Some crypto traders specifically look for golden crosses using 20-hour and 50-hour MAs to capture shorter momentum cycles. The principle remains identical - short-term momentum outperforming long-term baseline - but the speed of the signal adjusts for crypto's faster price cycles.
The practical implication: a golden cross on Bitcoin's daily chart carries more weight than the same pattern on an altcoin's 1-hour chart. Context and timeframe are everything.
How Do Traders Use the Golden Cross?
Knowing that a golden cross appeared is only the starting point. How traders act on it varies considerably depending on strategy, timeframe, and risk tolerance.
The golden cross trading strategy framework typically revolves around three primary applications: trend confirmation, entry signaling, and stop-loss referencing. None of these applications requires the golden cross to work in isolation - the pattern is most useful as one piece of a multi-indicator framework.
- Trend Confirmation: Traders who are already in a position use the golden cross to validate that the prevailing uptrend has enough momentum to continue. It reinforces conviction rather than triggering a new entry.
- Market Entry Trigger: Some traders enter a long position at or near the crossover. Others prefer to wait for the first significant pullback following the cross - entering at a lower price while the MA structure remains bullish.
- Stop-Loss Reference: The 50-day MA becomes a natural stop-loss benchmark post-crossover. A close below the 50-day MA after a golden cross suggests the bullish momentum has broken down, warranting an exit.
One application that doesn't get enough coverage: automated trading systems can be programmed to detect golden cross formations and trigger orders automatically. This removes emotional decision-making from the equation and can be configured with additional filters (volume threshold, RSI range) to reduce false positives.
Combining the Golden Cross with Other Indicators
The golden cross alone generates false signals in roughly 1 in 3 occurrences. Layering confirmation indicators significantly improves reliability.
The "whipsaw" risk deserves specific attention. In choppy markets - where price oscillates without sustained directional movement - the 50-day and 200-day MAs can cross back and forth repeatedly over days or weeks. Each crossing technically qualifies as a golden cross or death cross, but none carries meaningful predictive weight. ADX below 20 during a crossover is a reliable early warning that you may be dealing with a whipsaw setup rather than a genuine trend.
Using RSI alongside the golden cross is particularly practical. A golden cross confirmed when RSI is in the 50-65 range typically offers a better risk/reward profile than one where RSI is already at 75+. The latter suggests most of the initial move has been priced in, and a mean-reversion pullback may precede any continuation.
Avoiding false signals requires deliberate confirmation protocol. Don't act on a golden cross in isolation - validate it.
What Are the Limitations of the Golden Cross?
The golden cross earns its reputation as a significant technical signal, but it's neither infallible nor predictive in the strict sense. Understanding its weaknesses is just as important as understanding its strengths.
1. It's a lagging indicator - by design. By the time the 50-day MA crosses the 200-day MA, price has often already moved 10-20% from the actual trend reversal point. Traders who wait for the cross to act have already missed the early stage of the move.
2. False signal rate is significant. Studies across multiple asset classes suggest false signals occur in approximately 35% of golden cross formations - cases where the crossover appears but fails to produce a sustained uptrend. In choppy or sideways markets, this rate is even higher.
3. Sideways markets are the enemy. When an asset trades in a range without clear directional momentum, the 50-day and 200-day MAs can oscillate around each other repeatedly. The resulting series of golden crosses and death crosses is essentially noise - neither signal is telling you anything meaningful about future price direction.
4. Broader context matters. A golden cross forming on an asset with deteriorating fundamentals, in a rising-rate macro environment, or against a broader market downtrend carries substantially less weight than the same pattern in favorable conditions. Technical patterns don't exist in a vacuum.
⚠ Golden Cross Limitations at a Glance
- Confirms past price action → not future direction
- ~35% false signal rate → across studies and asset classes
- Unreliable in sideways markets → MAs oscillate without signal value
- Lagging entry points → much of the initial move may already be priced in
The death cross - the bearish counterpart where the 50-day MA crosses below the 200-day MA - illustrates these limitations from the opposite direction. Understanding when the golden cross's logic inverts is part of applying it responsibly.
These limitations don't make the golden cross useless. They make it a tool that rewards informed use over reflexive reaction.

Golden Cross Trading Strategies in Practice
Understanding the golden cross's limits doesn't mean avoiding it - it means trading it smarter. The pattern is most effective when integrated into a defined strategy with clear entry criteria, stop-loss rules, and exit planning.
Popular Trading Strategies Using the Golden Cross
Different trading styles use the golden cross signal in fundamentally different ways. Here's how the four major approaches incorporate it:
Swing trading with the golden cross typically involves entering a position when the cross forms on the daily chart, targeting a 2:1 reward-to-risk ratio. Trend following strategies treat the golden cross as their primary filter: only take long positions in assets where the 50-day MA is above the 200-day MA. Day traders work with much shorter MA periods (5-period and 15-period on 1-hour or 4-hour charts) and use the pattern as an intraday trigger. Position trading and long-term crypto investors often look at the weekly chart - the 50-week and 200-week MA crossover on Bitcoin has historically aligned with the early stages of multi-month bull cycles.
Risk Management When Trading the Golden Cross
Even the most reliable technical setup fails sometimes. That's not a flaw - it's the nature of probabilistic trading. Disciplined risk management is what separates traders who survive long-term from those who don't.
📊 5 Risk Management Rules for Golden Cross Traders
- Stop-loss below the 50-day MA: If price closes below the 50-day MA after entry, the bullish thesis is invalidated. Exit the position.
- Size positions relative to stop distance: Risk no more than 1-2% of account equity per trade.
- Require at least one confirmation: Never enter on the golden cross alone - RSI range, MACD, or volume confirmation meaningfully reduces false signal risk.
- Have an exit plan before entering: Determine profit target based on prior resistance or Fibonacci levels before the trade opens.
- Reduce leverage in uncertain environments: Scaling down position size when the broader market is in a choppy phase is a valid and rational strategy.
Crypto trading involves substantial risk of loss. Leveraged positions amplify both gains and losses - position sizing and stop-loss discipline aren't optional safeguards; they're the foundation of any sustainable trading approach.

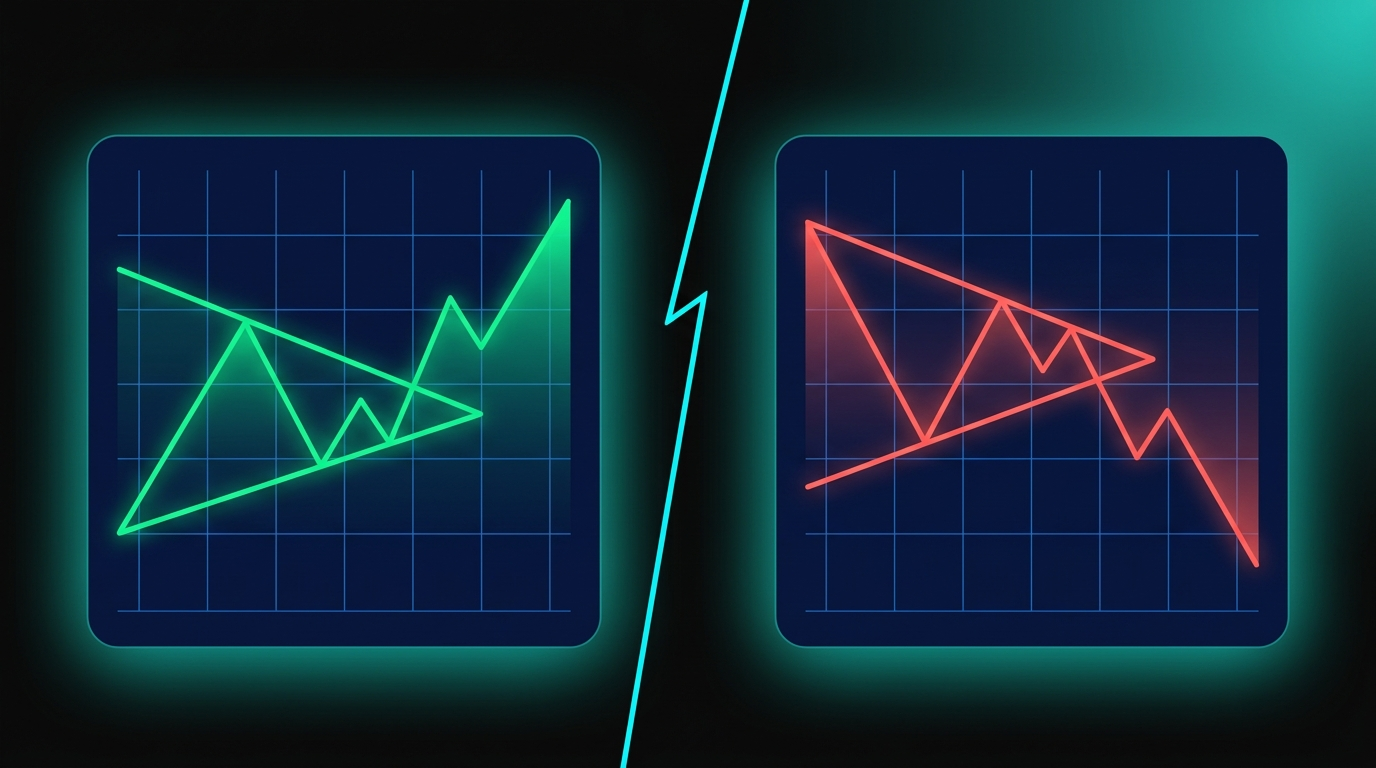
Golden Cross vs. Death Cross - Key Differences
If the golden cross is the bullish signal, the death cross is its bearish mirror image.
A death cross forms when the 50-day MA crosses below the 200-day MA - the inverse of the golden cross setup. Where the golden cross suggests short-term momentum has overtaken long-term baseline, the death cross signals that recent selling pressure has dragged short-term performance below the long-term average. Traders interpreting a death cross typically close long positions, reduce exposure, or look for short opportunities.
The S&P 500's behavior during the COVID-19 market event illustrates both signals clearly. A death cross formed in March 2020 as the market crashed on lockdown fears. By July 2020, the recovery rally had pushed the 50-day MA back above the 200-day MA - a golden cross that preceded an extended bull run lasting into early 2022. Both signals lagged the actual price turning points by weeks, reinforcing the lagging indicator characteristic.
The whipsaw risk applies to both crosses equally. An asset churning sideways without directional momentum can generate alternating golden and death crosses within a few weeks - each one technically valid but none of them carrying meaningful signal weight. When you see repeated crossovers in either direction within a short window, that's a strong indicator to step back and wait for cleaner market structure before acting.
Is the Golden Cross a Reliable Indicator? - What the Data Shows
Reputation and actual performance aren't always the same thing. The golden cross has a strong reputation - but what does the historical data actually show?
Research on S&P 500 performance following golden cross signals suggests the market has gained an average of approximately 3.5% in the six months after the pattern forms. That sounds promising. The important caveat: false signals occur in roughly 35% of cases - crossovers that appear on the chart but fail to produce a sustained uptrend. One in three is too high a false signal rate to act on the pattern without confirmation.
📊 Golden Cross by the Numbers (Historical Context)
- ~3.5% average market gain in the 6 months following a golden cross on S&P 500 (historical data)
- ~35% estimated false signal rate across major asset studies
- Reliability increases significantly on daily and weekly charts vs. hourly timeframes
One insight that professional technical analysts reference but beginners often miss: the golden cross can become a self-fulfilling prophecy in heavily-watched markets. When a major index or asset - Bitcoin, the S&P 500, gold - forms a golden cross, institutional traders, algorithmic systems, and retail participants all respond to the same signal simultaneously. That collective buying pressure can sustain or even amplify a trend that might otherwise have stalled.
Technical analyst Tom McClellan's distinction between Type 1 and Type 2 golden crosses adds useful nuance:
- Type 1 Crossing: Price is already extended far above the actual crossover price level when the cross forms. This often marks a temporary reversal point - much of the move has already happened.
- Type 2 Crossing: Price retraces back to or near the actual crossover price point after the cross forms. This frequently indicates a resumption of the prior trend - a more tradeable setup for disciplined entries.
Watching how the price behaves relative to the crossover point provides considerably more information than the binary "cross / no cross" reading that most traders use. For deeper context on how these dynamics play out on Bitcoin specifically, the XRP price prediction analysis on the Zipmex blog covers how MA-based signals currently factor into major crypto asset outlooks.
Conclusion - Should You Use the Golden Cross in Your Trading?
The golden cross is a powerful but imperfect tool. It's not a crystal ball, and traders who treat it as one will eventually learn that lesson at the cost of a losing trade. Used correctly - as a confirmation signal within a multi-indicator framework, with defined risk management and a clear exit strategy - it's one of the more reliable pattern-based signals in technical analysis.
No indicator removes uncertainty from trading. The golden cross shifts probabilities - it doesn't eliminate risk. Platforms built on transparency and on-chain verifiability reflect the direction the broader trading ecosystem is moving: toward tools and infrastructure where mechanics are auditable, outcomes are verifiable, and users maintain control. The same ethos applies to how you use technical signals - understand them deeply, verify them independently, and never hand over your judgment to any single indicator.
Crypto trading and leveraged futures involve substantial risk of loss and are not appropriate for all traders. Past performance of any technical indicator does not guarantee future results. Always trade within your risk tolerance.
Last updated: April 2026.
Frequently Asked Questions
What is a golden cross in trading?
A golden cross is a bullish technical chart pattern that forms when a short-term moving average - typically the 50-day MA - crosses above a long-term moving average, usually the 200-day MA. The cross signals that recent price momentum has become strong enough to outperform the longer-term baseline, which many traders interpret as a potential shift from bearish to bullish trend. It's one of the most widely watched patterns in technical analysis across stocks, crypto, forex, and commodities. The pattern is more reliable on higher timeframes and when confirmed by volume and secondary indicators like RSI or MACD.
Is the golden cross a lagging indicator?
Yes - the golden cross is a lagging indicator by definition. It can only be confirmed once the price action required to create it has already occurred. By the time the 50-day MA crosses above the 200-day MA, the underlying asset has often already moved significantly from the actual trend reversal point. This is a structural limitation inherent to all moving average-based signals. The advantage is that the lag also provides confirmation - traders aren't acting on a signal until the trend shift has demonstrated enough sustained buying to register in the MA data. Reliability comes at the cost of optimal entry timing.
What is the difference between a golden cross and a death cross?
A golden cross forms when the 50-day MA crosses above the 200-day MA - a bullish signal. A death cross is the inverse: the 50-day MA crosses below the 200-day MA, signaling bearish momentum. Traders use the golden cross to time potential long entries and the death cross to signal exits or short opportunities. In practice, alternating golden and death crosses in a short timeframe often indicate a choppy, trendless market - a condition where neither signal carries strong predictive weight and confirmation is especially critical.
How do I avoid false signals with the golden cross?
Three practices reduce false signal risk significantly. First, use higher timeframes - daily or weekly charts produce more reliable golden crosses than hourly charts. Second, require volume confirmation: the crossover should occur on above-average volume (at least 20% above the 30-day average). Third, layer at least one momentum indicator - RSI in the 50-70 range, MACD crossing its signal line positively, or ADX above 25 confirming trend strength. Monitoring whether price is near the crossover level rather than already extended far above it also reduces the risk of entering at the end of an overextended move.
Does the golden cross work in crypto trading?
The golden cross works in crypto but requires contextual adaptation. The core principle - short-term momentum outperforming long-term baseline - applies across all liquid markets. In crypto, higher volatility increases false signal frequency, and 24/7 trading means MAs respond to continuous price action rather than session-based data. Market sentiment can also shift dramatically on news events or whale activity, invalidating technical setups abruptly. Using the golden cross on higher timeframes (daily, weekly) and combining it with volume analysis and indicators like RSI reduces false signal risk. It's a useful tool in crypto - not a standalone system.
What is the best timeframe for a golden cross signal?
The daily chart is the most widely used and generally most reliable timeframe for golden cross signals. It balances responsiveness with noise reduction. Weekly golden crosses are even more powerful signals when they occur - they filter out considerably more noise and historically align with major trend shifts - but they're rare and lag price by even more. For shorter-term traders, 4-hour chart golden crosses using adapted MA periods represent a practical middle ground. The general principle: the longer the timeframe, the fewer false signals, but the later the entry relative to the actual trend reversal.
How do institutional traders use the golden cross?
Institutional traders - hedge funds, asset managers, algorithmic trading firms - monitor golden cross formations on major indices and assets as macro-level sentiment indicators rather than direct entry triggers. When a major index like the S&P 500 or a large-cap asset like Bitcoin forms a golden cross, institutional systems often reassess portfolio allocations and risk exposure levels. Some algorithmic strategies automatically adjust long/short position ratios based on MA crossover status. Institutions also watch the golden cross for its self-fulfilling prophecy effect - widely tracked signals in highly liquid markets can generate buying pressure simply through the attention they attract.
