
If prices are climbing but your gut says something is wrong - the rising wedge pattern is probably telling you why. This bearish chart formation is one of technical analysis's most deceptive signals: it looks bullish, but it nearly always ends in a breakdown.
⚡ Quick Answer
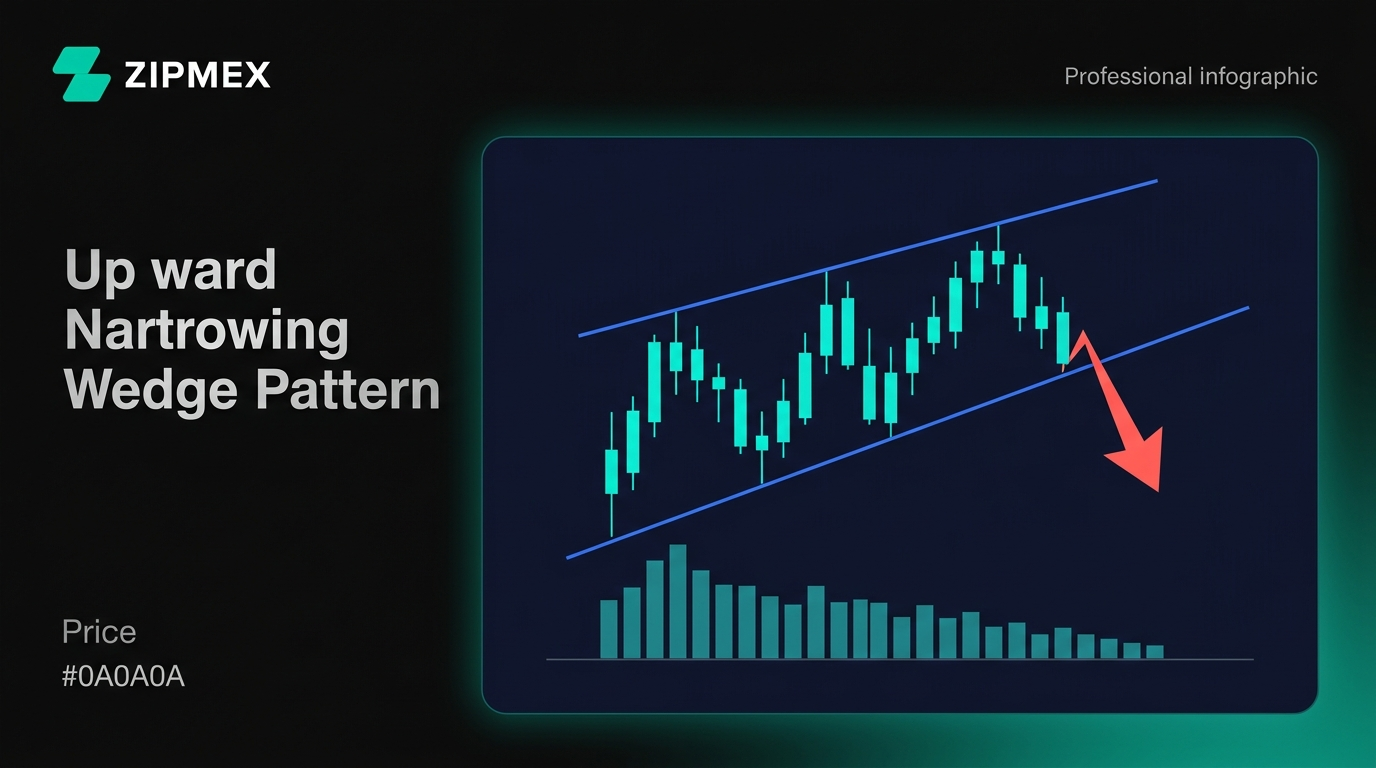
The rising wedge pattern is a bearish chart formation where price climbs inside a narrowing, upward-sloping channel. Despite appearing bullish, it signals weakening buying pressure and typically results in a breakdown below support - making it a key reversal signal for crypto traders in 2026.
This guide covers exactly what the rising wedge is, how to identify it on any crypto chart, how to trade it with defined entries, stop-losses, and price targets - plus a real Bitcoin example.
What Is the Rising Wedge Pattern?
The rising wedge pattern is a technical chart formation where price makes a series of higher highs and higher lows, but does so within a narrowing, upward-sloping channel. As the pattern develops, the two bounding trendlines converge - the lower support line rises at a steeper angle than the upper resistance line - until the price runs out of room and typically breaks downward.
It appears across all timeframes and all crypto markets, from Bitcoin on the weekly chart to altcoins on the 15-minute chart. Understanding the candlestick patterns inside the wedge helps traders read the exhaustion signals earlier.
Key Characteristics of the Rising Wedge Pattern
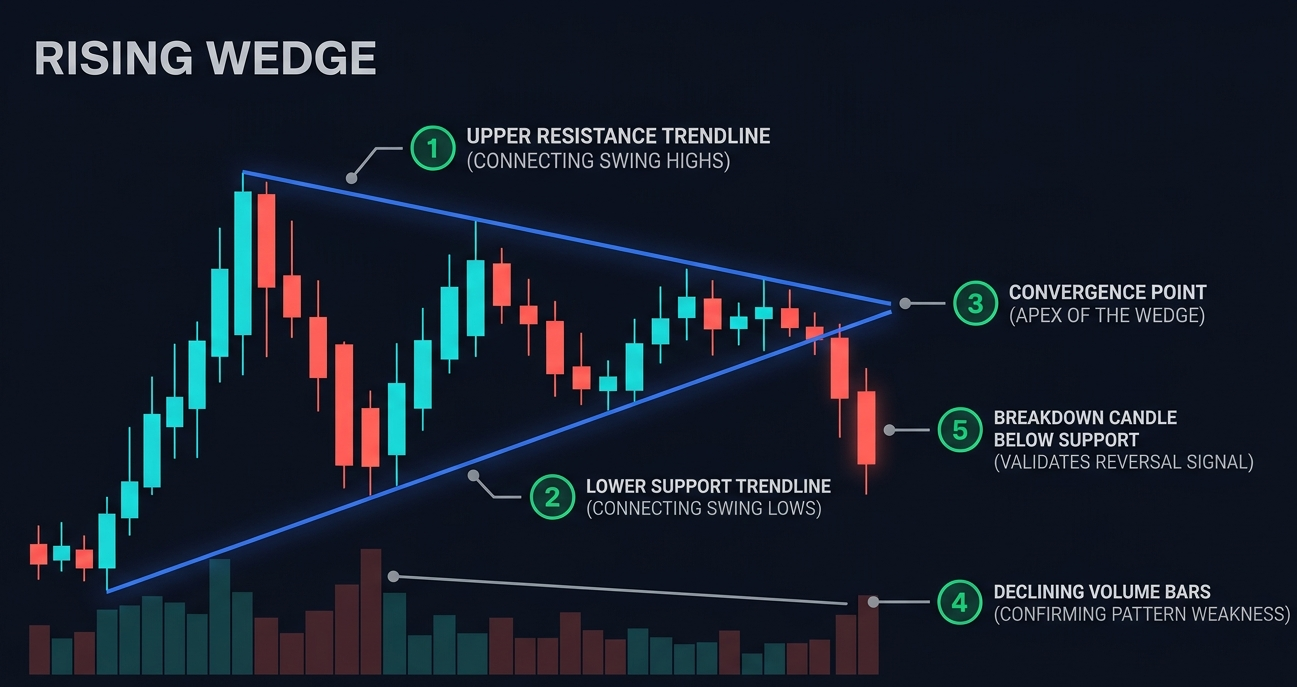
Four features define a valid rising wedge:
Converging trendlines: Both the upper resistance line (connecting higher highs) and lower support line (connecting higher lows) slope upward, but the support line rises more steeply. This convergence creates the wedge shape.
At least 2 touches per trendline: Each line must touch price at least twice (ideally three times) to be valid. More touches = stronger signal.
Declining volume: As price climbs inside the wedge, trading volume should decrease progressively. Rising price on falling volume signals that buying pressure is quietly draining away.
Typical duration: Most rising wedges form over 3-8 weeks on daily charts. Shorter-duration wedges appear on lower timeframes but carry more noise.
📉 Why the Rising Wedge Is a Bearish Pattern
- Steeper support: Buyers are forced to step in at higher and higher prices just to keep the pattern alive - a sign of exhaustion, not strength.
- Falling volume: The rally lacks participation. Each push higher is made by fewer buyers.
- Bull trap mechanics: Inexperienced traders see the rising price and buy - then get caught when the breakdown hits.
- Breakdown confirmation: When price closes below support, trapped longs panic-sell, accelerating the drop.
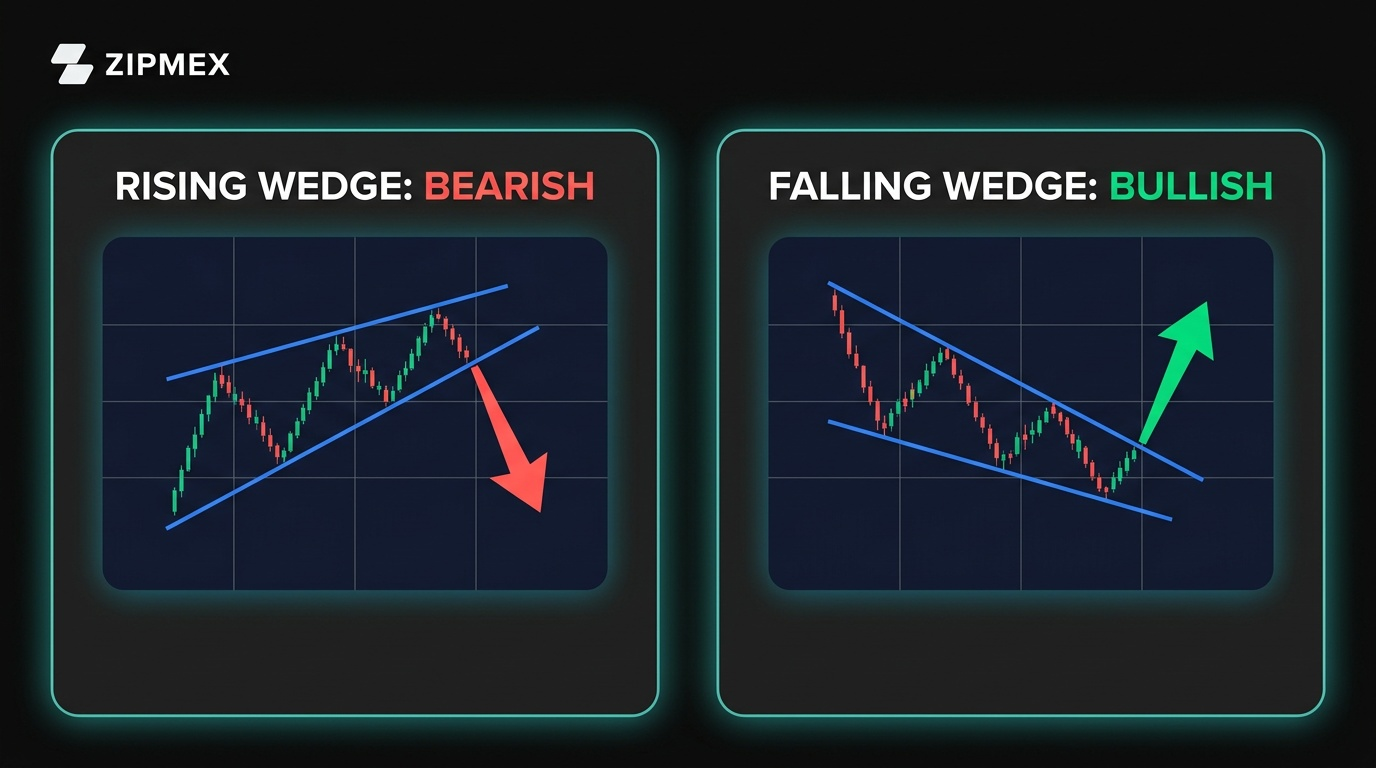
Rising Wedge vs. Falling Wedge
The rising wedge and its counterpart the falling wedge are often confused, but they carry opposite signals. The rising wedge is bearish: price climbs in a narrowing channel and then breaks down. The falling wedge is bullish: price declines in a narrowing channel and then breaks up. The one-sentence rule is simple - a rising wedge breaks down, a falling wedge breaks up.
Is the Rising Wedge Bearish or Bullish?
The rising wedge is predominantly a bearish pattern - both as a reversal signal at the end of an uptrend and as a continuation signal within a larger downtrend. This makes it one of the most counterintuitive formations in technical analysis chart patterns, because the price is literally going up the entire time the pattern is forming.
In a bullish market context, the rising wedge acts as a reversal signal: the uptrend is losing steam and a correction is approaching. In a bearish market context, the rising wedge acts as a continuation signal: the brief pullback rally is ending, and the broader downtrend is about to resume.
Regardless of context, one rule holds: the rising wedge resolves bearishly in the overwhelming majority of cases. Studies via StockCharts ChartSchool confirm it is definitively a bearish-biased pattern with no bullish resolution scenario in classic technical analysis.
How to Identify the Rising Wedge Pattern in Crypto
Learning to spot the rising wedge on a live crypto chart is a skill you develop by looking for converging trendlines combined with fading volume. Here's the precise identification checklist to use before the ascending triangle or other patterns confuse your read.
Step-by-Step Identification
Step 1 - Confirm an existing uptrend. The rising wedge typically forms after a sustained price rise. If there's no prior uptrend, you may be looking at something else.
Step 2 - Draw the upper resistance line. Connect at least two successive higher highs with a straight trendline sloping upward.
Step 3 - Draw the lower support line. Connect at least two successive higher lows with a straight trendline sloping upward.
Step 4 - Verify convergence. The support line must slope more steeply than the resistance line. If both lines are nearly parallel, it's a channel, not a wedge.
Step 5 - Check volume. Volume bars should be declining as the pattern progresses. Rising volume inside the wedge weakens the signal.
Step 6 - Wait for confirmation. The pattern is confirmed only when price closes below the support trendline - not before. Premature entries on suspected wedges are a common and costly mistake.
Volume Confirmation and RSI Divergence
Volume is the secondary filter that separates a genuine rising wedge from a healthy continuation pattern. As the wedge forms, volume should contract - indicating that fewer market participants are supporting the upward move.
The RSI (Relative Strength Index) provides an additional confirmation layer. Look for bearish RSI divergence inside the wedge: price is making higher highs while RSI is simultaneously making lower highs. This divergence reveals that momentum is eroding even as price appears strong. When both declining volume and bearish RSI divergence are present inside the wedge, the signal quality increases substantially.
How to Trade the Rising Wedge Pattern
Trading the rising wedge pattern requires patience, defined rules, and confirmation. Jumping in before the breakout is confirmed is the single most common mistake. Here's a complete framework for entries, stop-losses, and price targets.
Entry, Stop-Loss, and Price Target
Entry: The textbook entry is a short position entered after a confirmed candle close below the lower support trendline. More conservative traders wait for price to break below support, pull back to retest that level from underneath (now acting as resistance), and fail - then enter short on the rejection. This retest entry reduces the risk of false breakouts.
Stop-Loss: Place your stop-loss just above the most recent swing high inside the wedge, or just above the point where the upper resistance trendline was at the time of the breakdown. If price reclaims that level, the pattern has failed.
Price Target: Measure the height of the wedge at its widest point (from the support line to the resistance line at the beginning of the pattern). Project that distance downward from the breakout point. This gives a minimum price target. In volatile crypto markets, prices frequently overshoot this target.
Risk-Reward: Always calculate your risk-reward ratio before entering. A minimum 1:2 ratio (risking 1 to make 2) is the standard floor; the January-May 2021 BTC example below showed a documented ratio of 1:2.77.
🎯 Key Takeaways: Trading the Rising Wedge
- Never enter before a confirmed candle close below support - false breakouts are common.
- Stop-loss goes above the last swing high inside the wedge.
- Price target = wedge height projected downward from the breakout point.
- Combine with declining volume and bearish RSI divergence for higher-probability setups.
- In crypto, altcoin rising wedges often result in sharper drops (30%+) vs. Bitcoin (10-20%).
Bitcoin Rising Wedge Example (2021)
One of the clearest documented rising wedge examples on a major crypto asset occurred on Bitcoin's 12-hour chart between January 16 and May 23, 2021. Price formed a textbook rising wedge with converging trendlines and progressively lower volume as the pattern matured. When the support broke decisively in mid-May 2021, the breakdown was sharp and high-volume.
In a documented TradingMetrics case study of this move, a short entry at $53,349 with a stop at $60,348 and a target at $34,000 produced a risk-reward ratio of 1:2.77. The pattern confirmed exactly what the rising wedge structure predicted: an exhausted bull rally followed by a violent correction.
This is consistent with broader data: Altrady's crypto analysis notes that Bitcoin rising wedges near local tops typically produce corrections of 10-20%, while altcoins such as SOL, ADA, and similar assets tend to see sharper breakdowns of 30% or more due to higher volatility.
⚠ Risk Warning
Rising wedge patterns produce false breakouts. Price can close below support and quickly reclaim it, trapping short sellers. Never trade the rising wedge in isolation - always require volume confirmation and at least one additional indicator (RSI divergence or MACD crossover). No chart pattern guarantees a specific outcome.
Your signal won't wait for KYC
Connect wallet, open a perp in 30 seconds on ZEXO. No email, no ID, no account.
Trade on ZEXO →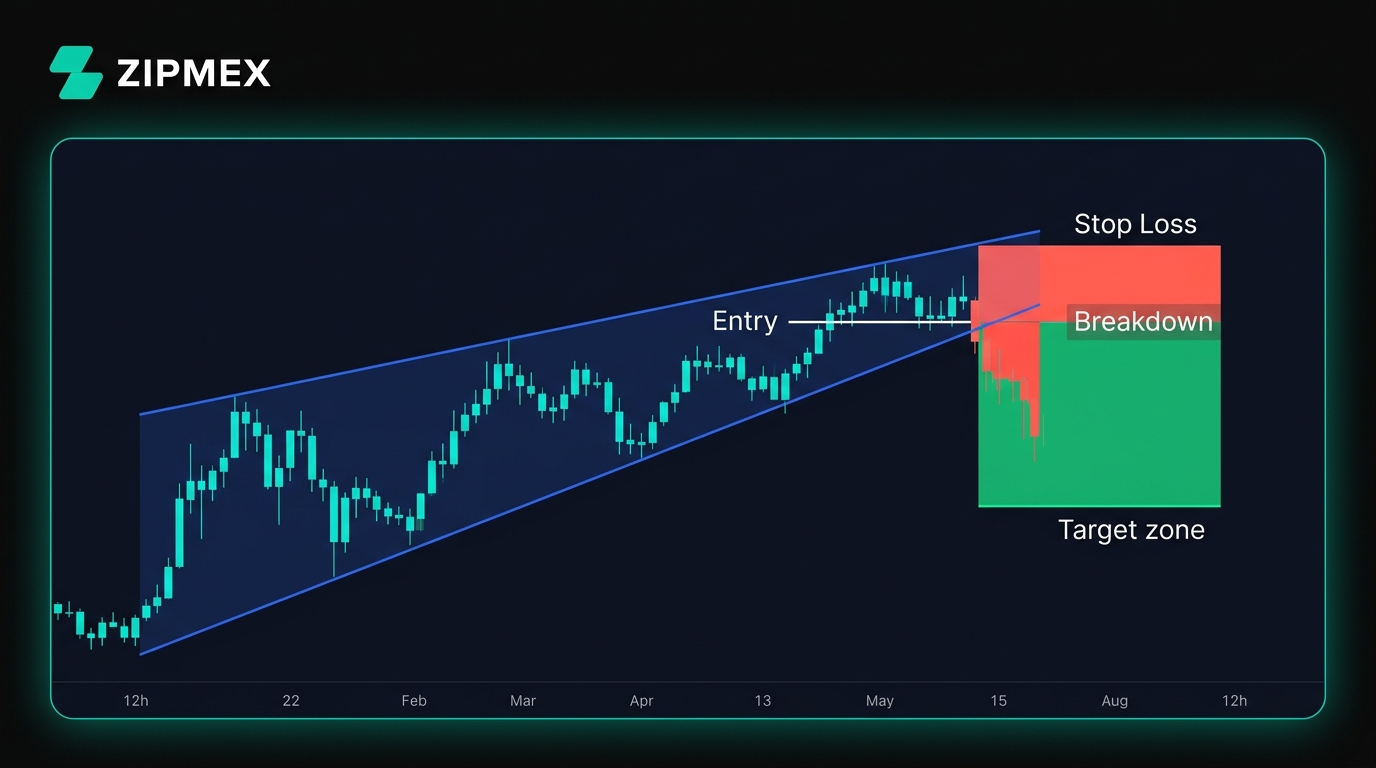
Rising Wedge Pattern in Crypto Trading 2026
The rising wedge remains one of the most frequently occurring patterns in crypto markets in 2026, largely because crypto's high volatility and retail-driven rallies regularly produce the exact conditions that form wedges: rapid price acceleration followed by buyer exhaustion. The pattern appears in Bitcoin, Ethereum, and across the altcoin spectrum.
A few things make the rising wedge especially relevant in current crypto market conditions. Retail-dominated rallies - particularly after major news catalysts - tend to produce steep, narrowing climbs that resolve into classic wedge breakdowns. The CoinTracker analysis from February 2026 confirms this pattern remains widely used by both manual traders and algorithmic systems to detect exhaustion in rising markets.
For traders watching altcoins such as SOL, ADA, and similar high-beta assets: rising wedges on these charts tend to produce more dramatic breakdowns than on Bitcoin. The pattern logic is the same, but the volatility magnifies the move.
Whether you're learning to read crypto charts for the first time or refining a multi-indicator setup, the rising wedge is a pattern worth mastering because it consistently appears at the very moments when the market's bullish momentum is most deceptively intact.
Frequently Asked Questions
What is the rising wedge pattern?
The rising wedge pattern is a bearish technical chart formation where price makes higher highs and higher lows within a narrowing, upward-sloping channel. Despite appearing bullish on the surface, it signals weakening buying pressure and typically resolves with a breakdown below the lower support trendline.
Is the rising wedge bullish or bearish?
The rising wedge is a bearish pattern. When it forms at the end of an uptrend, it signals a bearish reversal. When it forms during a downtrend (as a relief rally), it signals bearish continuation. Both scenarios end the same way: a breakdown below support.
How reliable is the rising wedge pattern?
The rising wedge has a strong bearish directional bias, but no pattern is 100% reliable. False breakouts occur - price may briefly close below support before recovering. Traders increase reliability by requiring volume confirmation on the breakdown and checking for bearish RSI divergence inside the wedge. Longer timeframes (daily, weekly) produce more reliable signals than shorter ones.
How do I trade the rising wedge pattern?
Enter a short position after a confirmed candle close below the lower support trendline. Set your stop-loss just above the last swing high inside the wedge. Calculate your price target by measuring the wedge's height at its widest point and projecting that distance downward from the breakout point. Always aim for a minimum 1:2 risk-reward ratio.
What's the difference between a rising wedge and a bull flag?
A rising wedge and a bull flag both slope upward, but they carry opposite implications. The bull flag is a bullish continuation pattern: it starts with a high-volume "flagpole" move, consolidates briefly with slightly declining prices, and then breaks upward. The rising wedge is bearish: it shows declining volume throughout its formation and breaks downward. The key differentiator is volume - bull flags have high volume on the initial move; rising wedges show declining volume throughout.
How long does a rising wedge pattern take to form?
On daily charts, most rising wedges form over 3-8 weeks. On higher timeframes (weekly), they can take months. On lower timeframes (1-hour, 4-hour), they can form in days. Longer timeframes produce more reliable and significant breakdown moves.
Does the rising wedge appear in altcoins?
Yes, and altcoin rising wedges tend to produce sharper breakdowns than Bitcoin due to higher volatility. SOL, ADA, and similar high-beta assets often see drops of 30% or more after a rising wedge breakdown, compared to Bitcoin's typical 10-20% correction.
Conclusion
The rising wedge pattern is one of technical analysis's most powerful - and most deceptive - bearish signals. It appears during rallies, looks like bullish strength on the surface, and then breaks down when the buyers run out of firepower. The key to using it well is discipline: wait for confirmation, verify with volume and RSI divergence, define your stop and target before entering, and never trade it in isolation.
Pair it with complementary patterns like the falling wedge for a complete picture of wedge dynamics, and build your broader technical analysis foundation with an understanding of the ascending triangle and other chart patterns that crypto markets cycle through regularly.
Stop depositing. Start trading.
ZEXO perps execute straight from your wallet. No deposits, no withdrawals, no waiting.
Open ZEXO →⚠ Disclaimer: The information provided in this article is not intended to provide investment or financial advice. Investment decisions should be based on the individual's financial needs, objectives, and risk profile. We encourage readers to understand the assets and risks before making any investment entirely. Cryptocurrency investments are subject to high market risk. Past performance does not guarantee future results.
