
My GRT price prediction research started the same way most crypto rabbit holes do - someone asking whether a token that once traded near $3 is worth buying at $0.024. That question deserves a serious answer, not a number pulled from thin air. In this guide, I break down what drives GRT's value, what the price history actually tells us, and what realistic scenarios look like for 2026 through 2030.
⚡ Key Takeaways
- GRT currently trades near $0.024-$0.026, roughly 99% below its February 2021 all-time high of ~$2.84, according to CoinGecko
- The Graph is real Web3 infrastructure - it indexes blockchain data for DeFi, NFTs, DAOs, and AI tools via open subgraph APIs
- Technical indicators (RSI, MACD, Moving Averages) show GRT in a prolonged base-building phase as of early 2026
- Realistic 2026 base-case targets depend heavily on BTC market cycle timing and broader altcoin sentiment - see our BTC dominance guide for context
- GRT carries substantial investment risk - high circulating supply (~10.7B tokens), significant ATH distance, and altcoin correlation all work against short-term recovery
What Is The Graph (GRT)? Protocol Overview and Token Utility
If you've spent any time in DeFi or NFT analytics, you've used The Graph - you just may not have known it. Half the dashboards and wallets in Web3 pull their on-chain data through this protocol. The comparison that sticks is accurate: The Graph is the Google of blockchains.
Traditional blockchain data retrieval was a mess. Before The Graph, development teams had to build and maintain proprietary indexing servers - expensive, slow, and centralized. The Graph replaced that with an open, decentralized protocol that indexes smart contract data and makes it queryable via GraphQL APIs. Instead of scanning raw chain data, an application sends a clean query and gets a structured, fast response.
Yaniv Tal, Brandon Ramirez, and Jannis Pohlmann founded the project in 2018, with the mainnet launching in December 2020. Their thesis was simple: Web3 can't scale if every team reinvents the data layer. The protocol now supports DeFi platforms, NFT marketplaces, DAOs, gaming systems, and - increasingly - AI tools that need fast, reliable blockchain data retrieval.
GRT is the economic engine of the whole system. The token pays for queries, secures staking, incentivizes participant behavior, and governs protocol upgrades. Every core network function denominates in GRT, which means token demand ties directly to how much the network gets used.
How Subgraphs and the Indexing Mechanism Work
Think of subgraphs like a search engine's crawler - but purpose-built for blockchain data. A developer publishes a subgraph that defines exactly which smart contracts to watch and how to structure the output. Indexers then process that subgraph, continuously pulling and organizing on-chain data as new blocks arrive. When an application needs information, it sends a GraphQL query and the Indexer returns a structured response - fast, accurate, and consistent.
The flow breaks down cleanly into five steps:
- Developer publishes subgraph - defines which smart contract events to index and how
- Indexer processes the subgraph - allocates stake and begins indexing on-chain data
- Application sends GraphQL query - via the protocol's decentralized query endpoint
- Indexer returns structured response - typically in milliseconds, not block times
- Query fee paid in GRT - routed to the Indexer, with portions going to Curators and Delegators
This design is what separates The Graph from centralized alternatives. No single entity controls the index. Outcomes are on-chain verifiable. And because anyone can run an Indexer or publish a subgraph, the system remains permissionless - the kind of infrastructure primitive that serious Web3 projects actually need.

GRT Price History: Key Milestones and Market Cycles
Understanding GRT's technology matters, but price history is where investor reality lives. GRT's trajectory has been dramatic in both directions - and reading those cycles correctly shapes any honest forward forecast.
GRT PRICE HISTORY TIMELINE
October 2020
Public token sale. GRT enters market trading at $1.50-$1.60 - an unusually high starting valuation reflecting genuine excitement about Web3 data infrastructure.
February 12, 2021 - ALL-TIME HIGH
GRT hits $2.84 as DeFi and NFT mania drives global demand for Web3 infrastructure tokens. Market cap briefly enters top-20 territory.
2022
Crypto-wide bear market crushes GRT over 98% from ATH. The broader macro selloff, rising interest rates, and DeFi contagion events accelerate the decline.
2023-2024
Slow, partial recovery. GRT fails to recapture previous highs even during brief Bitcoin-driven rallies. Extended base-building phase begins.
Early 2026
GRT trades near $0.024-$0.026 - approximately 99% below its ATH. Post-halving altcoin season window opens potential recovery catalyst.
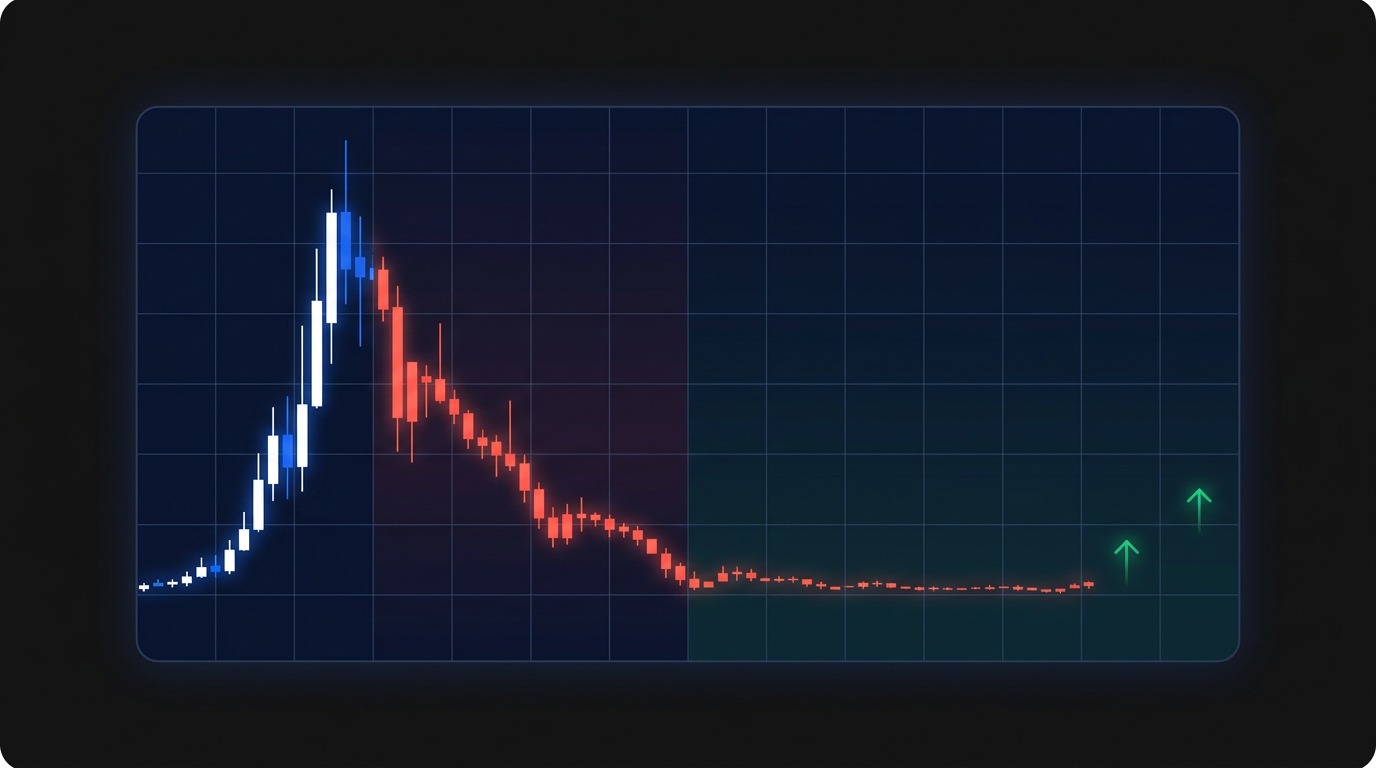
GRT launched in late 2020 following a public token sale in October. Initial trading showed prices in the $1.50-$1.60 range - an unusually high starting valuation that reflected genuine market excitement about Web3 infrastructure plays. 2021 was the defining year. DeFi exploded. NFTs went mainstream. Every serious crypto investor was looking for infrastructure exposure, and The Graph was the obvious data-layer candidate. GRT hit its all-time high near $2.84 on February 12, 2021, frequently trading above $2 during peak months.
Then came the correction. The 2022 bear market hit GRT particularly hard, as it typically does with mid-cap altcoins. From ATH to the cycle lows, GRT shed over 98% of its value. The 2023-2024 recovery was slow and partial. As of early 2026, GRT sits near $0.024 - down roughly 99% from its peak.
That ATH-to-current ratio is both the core risk argument and the core bull argument. It depends entirely on whether you believe the fundamentals have improved while the price has not, or whether the price simply reflects a rational reassessment of the token's long-term role.
GRT Technical Analysis: RSI, MACD, Moving Averages, and Support Levels
Technical analysis doesn't predict the future - it maps current market structure and probability. For GRT, the picture as of early 2026 reflects an extended base-building phase following the 2022-2023 capitulation.
The RSI reading near 35-45 puts GRT in historically interesting territory. Tokens don't stay this far below their ATH indefinitely - they either recover or fade to irrelevance. MACD tells a similar story: bearish momentum is slowing but hasn't reversed. A clean MACD crossover on the weekly chart would be the first real technical signal for traders watching GRT for re-entry.
Support sits in the $0.020-$0.024 zone - where GRT has found buyers during prior dips in this cycle. The critical resistance levels to watch are $0.044 (the recent monthly high) and the $0.08-$0.12 zone, which would represent the first meaningful recovery toward prior support turned resistance.
GRT Price Prediction 2026 to 2030: Year-by-Year Forecast
This is the section most readers come for, so I'll be direct: every GRT price prediction carries significant uncertainty. What I can offer is a structured, scenario-based framework built around real market cycle dynamics and fundamental catalysts - not arbitrary numbers.
Understanding Bitcoin halving cycles is essential context here. Historically, halving events precede broader altcoin expansions by 12-18 months - which places 2026 squarely inside the potential post-halving altseason window. The three-scenario model below reflects how crypto markets actually move.
These ranges are scenario-based projections. Crypto markets are highly volatile and past performance does not indicate future results. This is not financial advice.
GRT Price Prediction 2026 and 2027
2026 sits inside what could be the post-halving altcoin season window. The 2021 bull run demonstrated that GRT can move 10-20x in a single up-cycle when market conditions align. The base case for 2026 targets $0.05-$0.12 - a genuine recovery from current levels without requiring anything close to ATH recovery. The catalyst scenario: BTC stabilizes, altcoin liquidity returns, and GRT's developer adoption metrics attract renewed attention.
The bear case - staying near or below $0.025 - assumes BTC fails to sustain post-halving momentum, macro conditions deteriorate, and GRT continues to fade relative to newer infrastructure tokens. To understand whether we're entering an altcoin season, monitoring BTC dominance trends is the single most useful leading indicator.
For 2027, the base case extends recovery to $0.08-$0.18. By this point, either the bull cycle is maturing and GRT has recaptured relevance, or the bear case has played out. The 2017-2018-2019-2020 cycle history in crypto suggests these multi-year base periods happen - and they don't last forever.
GRT Price Prediction 2028, 2029, and 2030
The longer the horizon, the wider the range - and the more the forecast depends on structural rather than cyclical factors.
The most underappreciated bull thesis for GRT in the 2028-2030 window is AI. AI systems increasingly need structured, queryable data from blockchain networks - for smart contract auditing, DeFi analytics, on-chain intelligence, and decentralized agent interactions. The Graph's subgraph architecture is a natural data layer for AI applications that need reliable, permissionless blockchain data. This is a genuine emerging demand driver that isn't reflected in most published forecasts.
The 2028-2030 period likely encompasses another full BTC halving cycle. If historical patterns hold, GRT could trade significantly above current levels even in a base case. For context on how these longer-horizon crypto price predictions tend to perform, the historical record suggests wide ranges are appropriate - and honesty about uncertainty is more valuable than false precision.
Is GRT a Good Investment? Key Factors to Evaluate
Evaluating GRT as an investment requires separating the technology thesis from the price thesis. Both need to hold for GRT to reward holders. Plenty of technically excellent projects have produced terrible investment returns.
The bull case rests on genuine utility. GRT powers real infrastructure. Thousands of Web3 applications query The Graph daily. Revenue flows are on-chain verifiable - query fees, staking rewards, and curator earnings all stem from actual platform usage rather than token inflation schemes. That's a meaningful difference from the majority of altcoins.
GRT Tokenomics and Supply Analysis
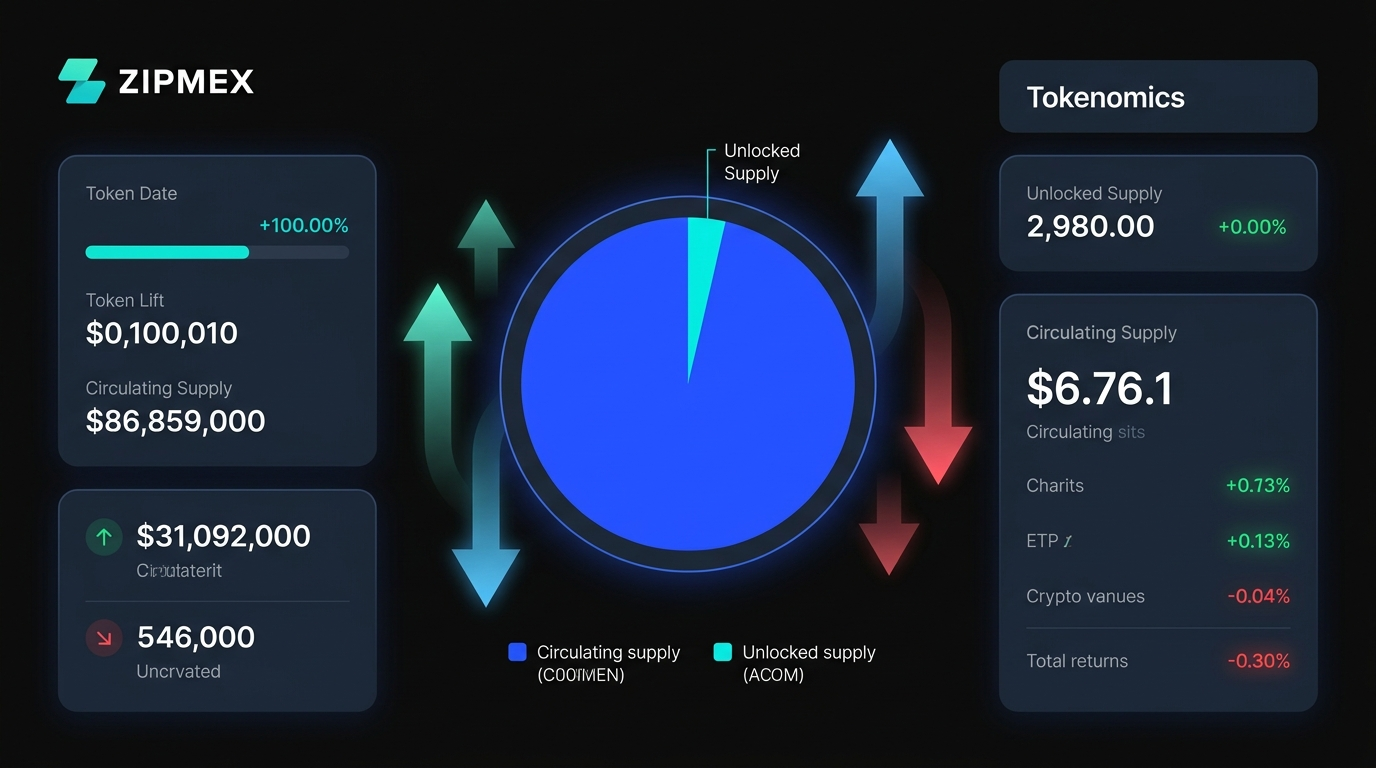
The supply picture for GRT is unusual in crypto: the token is nearly fully diluted. Circulating supply sits at ~10.7B out of a total supply of ~10.8B - roughly 99% of all GRT is already in circulation.
High circulating supply creates two dynamics worth understanding. First, price appreciation requires significant dollar inflows - moving a $270M market cap token to $1 implies roughly a $10.7B market cap, a top-30 crypto valuation. That's achievable in a bull market but requires sustained demand. Second, minimal remaining dilution is actually a bull argument: there are no large future unlock events hanging over the price.
GRT Investment Risks and What Could Go Wrong
Every serious investment analysis includes the downside case. For GRT, there are five risk vectors worth monitoring - not reasons to avoid the asset, but factors to weigh against your own risk tolerance.
1. Broad Crypto Market Risk
GRT typically amplifies BTC moves - both up and down. In the 2022 bear market, GRT fell harder than Bitcoin. Diversification across asset classes helps reduce this correlation exposure.
2. Competition from Alternative Data Protocols
The Graph isn't the only decentralized data layer. Protocols compete for developer mindshare in adjacent spaces. Monitor subgraph count and query volume growth as leading indicators of competitive position.
3. Regulatory Risk
Infrastructure tokens haven't been the primary regulatory target, but that could change. Exchange delisting pressure, DeFi-specific regulation, or jurisdictional restrictions on staking could all reduce GRT's accessible liquidity.
4. Smart Contract and Protocol Risk
Any on-chain protocol carries vulnerability risk. A critical exploit in The Graph's contract layer - while audited - could damage protocol credibility rapidly.
5. Narrative Fatigue
If Web3 adoption stalls - whether from user experience limitations or shifting developer attention - GRT's long-term demand thesis weakens. The protocol needs sustained developer adoption growth to justify higher valuations.
⚠ Risk Disclaimer
- Crypto investing → involves substantial risk of loss. GRT, like all digital assets, is highly volatile
- Price predictions → are speculative in nature and should not be treated as financial advice
- Past performance → does not guarantee future results
- Position sizing → only allocate capital you can afford to lose entirely
- Professional advice → consider consulting a qualified financial professional before making any investment decisions
How to Buy and Store GRT: Step-by-Step Guide
Buying GRT doesn't require anything exotic - it's listed on major exchanges and straightforward to self-custody. Here's the clean version:
- Choose a regulated exchange - GRT trades on high-liquidity centralized exchanges including Kraken, Binance, and MEXC. Look for platforms with regulatory standing in your jurisdiction, deep GRT order books, and transparent fee structures.
- Complete KYC verification - All regulated exchanges require identity verification. Submit your ID documentation and wait for approval - typically 10-30 minutes on major platforms.
- Fund your account - Deposit fiat via bank transfer, debit card, or stablecoins (USDT/USDC). Stablecoin deposits typically process faster and avoid additional FX conversion fees.
- Execute your GRT purchase - Use a limit order to control your entry price rather than a market order, particularly for larger buys where slippage matters.
- Withdraw to self-custody - Transfer tokens to a MetaMask or compatible ERC-20 wallet for hot storage, or to a hardware wallet (Ledger, Trezor) for cold storage. Not your keys, not your coins - exchange counterparty risk is real.
Bonus: Delegating GRT for passive yield. You can delegate your tokens to Indexers directly through The Graph's protocol interface using MetaMask. Delegating earns a share of Indexer rewards without running a node. Yields vary based on network activity and an unbonding period of approximately 28 days applies when withdrawing.
GRT Alternatives: Other Web3 Infrastructure Tokens to Know
GRT isn't the only bet in the Web3 data and infrastructure space. If the indexing-and-querying thesis resonates but you want to understand the broader landscape, these three protocols are worth knowing.
The key distinction: Chainlink and Filecoin occupy adjacent infrastructure layers (oracles and storage), while Ocean Protocol more directly competes for the data access market. Platforms built on self-custody and on-chain verifiability - the same principles underlying The Graph - reflect where serious Web3 development is heading. Trustless, transparent, verifiable data infrastructure is not a niche category; it's a prerequisite for the next generation of DeFi and AI applications.
Conclusion: GRT Price Prediction Summary and Final Outlook
The GRT price prediction story is genuinely complex, and anyone giving you a single confident number is oversimplifying it.
The honest summary: The Graph has real technology, real usage, and a credible long-term thesis - especially as AI systems increasingly need structured, permissionless blockchain data. The tokenomics are cleaner than most (near-full dilution, no looming unlock events). And the distance from ATH, while sobering, creates asymmetric upside scenarios for investors with multi-year time horizons.
The headwinds are equally real. A ~99% drawdown from ATH requires extraordinary buying pressure to reverse. A high circulating supply means dollar inflows need to be substantial to move the price significantly. And GRT, like all mid-cap altcoins, remains tightly correlated with BTC - in bear markets, it typically falls harder.
◆ LONG-TERM HODLER
GRT's infrastructure role in Web3 and AI data layers provides a credible 3-5 year thesis. Small position sizing appropriate - treat as a speculative infrastructure bet, not a core holding.
◆ SHORT-TERM TRADER
Watch for MACD bullish crossover on the weekly chart and RSI recovery above 50 before considering entries. High volatility creates both opportunity and rapid loss risk. Use limit orders.
◆ CONSERVATIVE INVESTOR
GRT's current price profile - deep ATH discount, high circulating supply, altcoin correlation - places it firmly in high-risk speculative territory. This is not a capital-preservation asset.
Crypto trading and investing involve substantial risk of loss. GRT price predictions are speculative in nature and should not be treated as financial advice. Past performance does not guarantee future results. Always conduct your own research and consult a qualified financial professional before making any investment decisions.
Last updated: April 2026.
Frequently Asked Questions
What is the GRT price prediction for 2026?
The GRT price prediction for 2026 spans a wide range depending on market conditions. In a base case - where BTC sustains post-halving momentum and altcoin liquidity returns - GRT could realistically target $0.05-$0.12, representing a 2-5x recovery from current levels near $0.024. A bull case could push GRT toward $0.20-$0.40 if Web3 adoption and AI infrastructure demand accelerate. The bear case keeps GRT near or below current prices if macro conditions worsen. These are probabilistic scenarios based on historical cycle analysis, not guarantees. Substantial risk of loss applies to any GRT position.
What is the GRT price prediction for 2030?
The GRT price prediction for 2030 reflects the widest uncertainty range of any forecast horizon. A base case - steady Web3 infrastructure adoption and two more BTC halving cycles - suggests $0.20-$0.50. A bull case, where GRT becomes a core data layer for AI-driven blockchain applications, could justify $1.00-$3.00, approaching ATH territory. The bear case remains a prolonged decline if better-funded competitors displace The Graph's protocol. The 2030 outlook is fundamentally a bet on the Web3 and AI data infrastructure category, not just on GRT as a token.
What is GRT token used for?
GRT is the native utility token of The Graph protocol, serving four core functions. Consumers pay GRT to access indexed blockchain data via the protocol's query market. Indexers stake GRT to participate in query processing and earn rewards. Delegators stake GRT to support Indexers and earn a share of their rewards without running nodes. GRT holders also participate in protocol governance. Every economic activity in the network - from query fees to curation signals - denominates in GRT, making it a genuine utility token rather than a governance-only instrument.
Is GRT a good long-term investment?
GRT has genuine characteristics supporting a long-term thesis: real utility as Web3 data infrastructure, on-chain verifiable revenue flows, near-full supply dilution (~99% circulating), and emerging AI data layer demand. Against that, it carries substantial risk - ~99% drawdown from ATH, high circulating supply requiring massive inflows to appreciate significantly, mid-market liquidity, and altcoin correlation amplifying bear market losses. Whether GRT is appropriate for any specific investor depends on risk tolerance, time horizon, and portfolio construction. This analysis is not financial advice.
How does the BTC halving cycle affect GRT price?
Bitcoin halving events historically precede broader crypto bull markets by 12-18 months. The mechanism: reduced BTC supply issuance tightens sell pressure, BTC price typically rises, capital flows into altcoins in what's termed "altcoin season," and high-beta tokens like GRT amplify BTC gains. GRT's 2021 ATH came approximately three months after BTC's peak during the post-2020-halving bull run. If that pattern repeats following the 2024 halving, 2026 could represent GRT's next meaningful upside window - though historical patterns are not guaranteed to repeat.
What technical indicators do traders use for GRT price analysis?
Traders analyzing GRT typically use a combination of trend indicators and momentum oscillators: RSI (Relative Strength Index) identifies overbought and oversold conditions; MACD tracks momentum shifts with crossovers signaling potential trend reversals; 50-day and 200-day Moving Averages define long-term trend structure - a golden cross (50-day crossing above 200-day) is a bullish structural signal; Bollinger Bands identify volatility compression phases that often precede significant price moves; and Volume confirms whether price moves have genuine market participation or are low-conviction noise.
How do I store GRT safely?
GRT is an ERC-20 standard token on Ethereum, compatible with any EVM wallet. For active users who want to interact with The Graph protocol for staking or delegation, MetaMask is the standard choice - it integrates directly with The Graph's dApp interface. For long-term cold storage, a hardware wallet (Ledger or Trezor) is correct - private keys stay offline, eliminating remote attack vectors. Never store seed phrases digitally. For substantial holdings, a multi-signature wallet setup adds an additional protection layer. Always withdraw from exchanges to self-custody for any meaningful long-term GRT position.
