
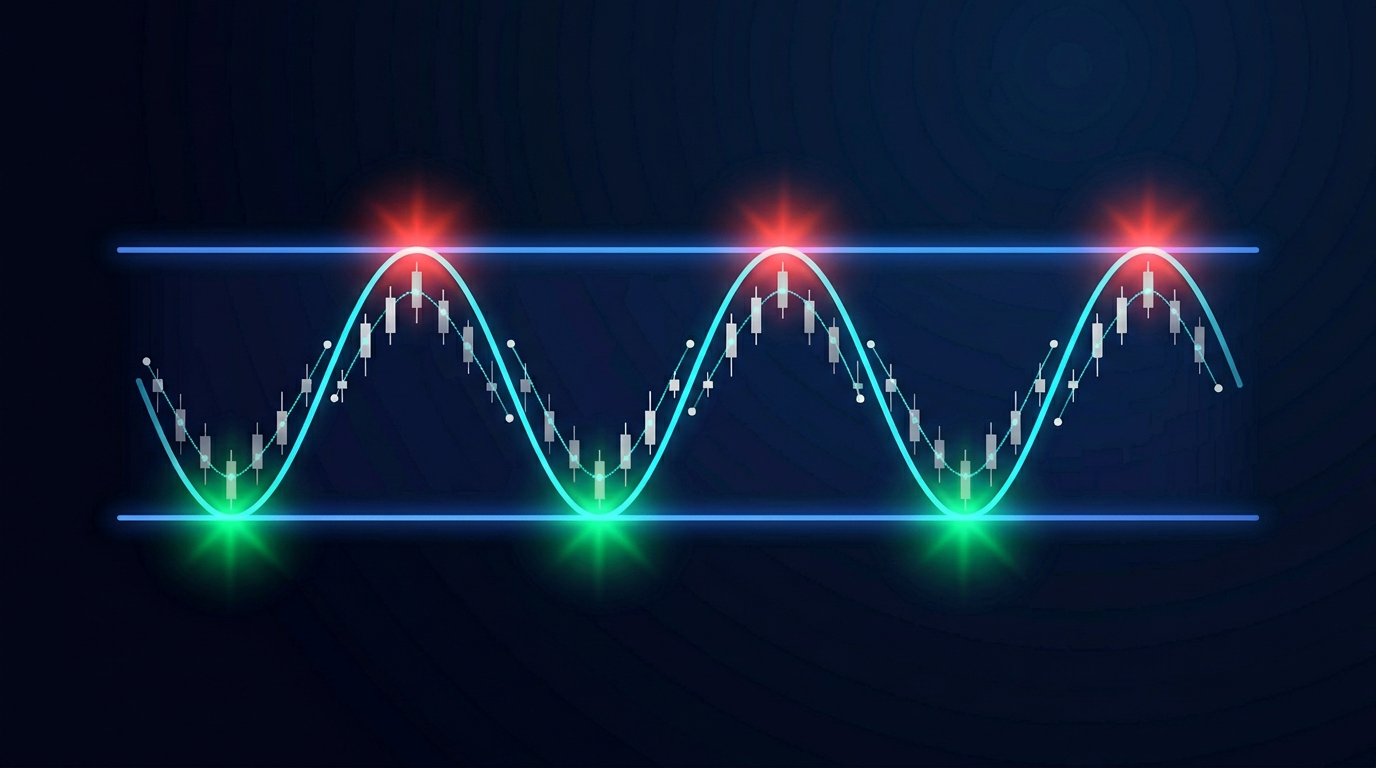
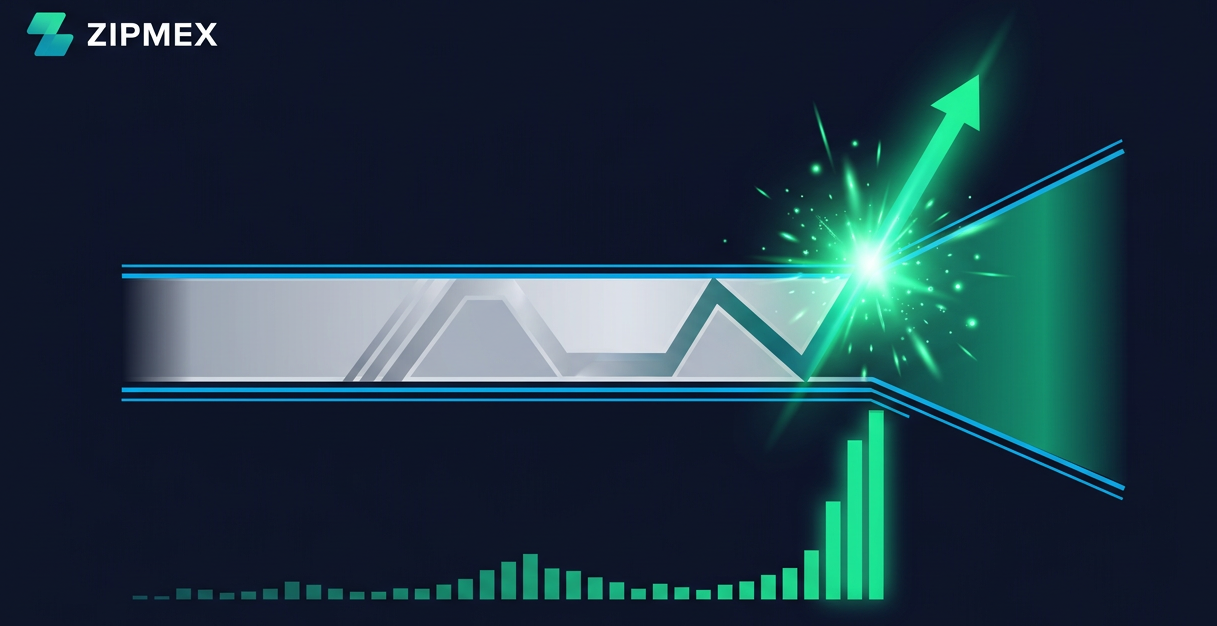
A sideways market is a condition where asset prices move horizontally within a defined range - bouncing between a support floor and a resistance ceiling - without establishing any clear upward or downward trend. Also called a ranging market or consolidation phase, it's one of the most misunderstood environments in trading.
Most participants treat sideways markets as dead zones. They're not. They're structured equilibrium phases with real tactical opportunities - if you know how to read them and what tools to deploy.
⚡ Key Takeaways
- A sideways market (also: ranging market) is defined by horizontal price oscillation between support and resistance - no higher highs, no lower lows
- RSI, Bollinger Bands, and ADX are the primary indicators for identifying ranging conditions
- Range trading and mean reversion are the two dominant sideways market strategies - trend-following approaches consistently fail
- Sideways phases are temporary; they always resolve into a new trend, typically with a volume-confirmed breakout
What Is a Sideways Market? Definition and Core Concepts
A sideways market, often called a ranging market, describes any period where prices oscillate between a consistent support level and a consistent resistance level without breaking in either direction. There are no higher highs forming (which would signal an uptrend) and no lower lows (which would signal a downtrend). Prices simply chop back and forth within a horizontal band.
This isn't a sign of market failure. A sideways market reflects genuine equilibrium - a moment in the market cycle where buyers and sellers are equally matched, and neither side has enough conviction to push price into a sustained move.
3 Core Characteristics of a Sideways Market:
- Limited directional movement - Price repeatedly returns to the same general area rather than extending progressively in one direction
- Repeated reversals between support and resistance - Each test of the upper or lower boundary produces a bounce rather than a breakout
- Balanced supply and demand - Neither buyers nor sellers dominate; the market is processing information rather than reacting decisively to it
Price consolidation of this kind plays an essential role in markets. After a strong move, participants need time to reassess value, absorb positions, and recalibrate expectations. The U.S. equity market experienced a prolonged sideways phase between 1966 and 1982 - a reminder that ranging conditions can persist far longer than most traders expect.
How Sideways Markets Form
Three distinct mechanisms produce ranging markets, and understanding which one is at play helps calibrate strategy.
The first is post-trend exhaustion. After a significant directional move - whether a bull rally or a sharp decline - participants become reluctant to extend positions at current prices. Early buyers may be taking profits; late entrants may be waiting for a clearer signal. This creates a natural standoff.
The second is macro uncertainty. When economic data, earnings outlooks, or policy direction are genuinely mixed, markets tend to wait. Without a dominant narrative, price drifts within a range as participants look for the next clear catalyst.
The third, and most underappreciated, is institutional accumulation or distribution. Large players - funds, banks, institutional desks - don't move positions in a single block. They buy or sell gradually over weeks or months, operating near a stable price level to avoid slippage. The resulting price behavior looks directionless on a chart, but the range itself is the product of deliberate, large-scale activity. These are often the most significant consolidation phases to watch because the breakout that follows can be powerful.
These formation mechanics manifest in distinctive patterns that traders learn to recognize on charts.
Key Characteristics of a Sideways Market
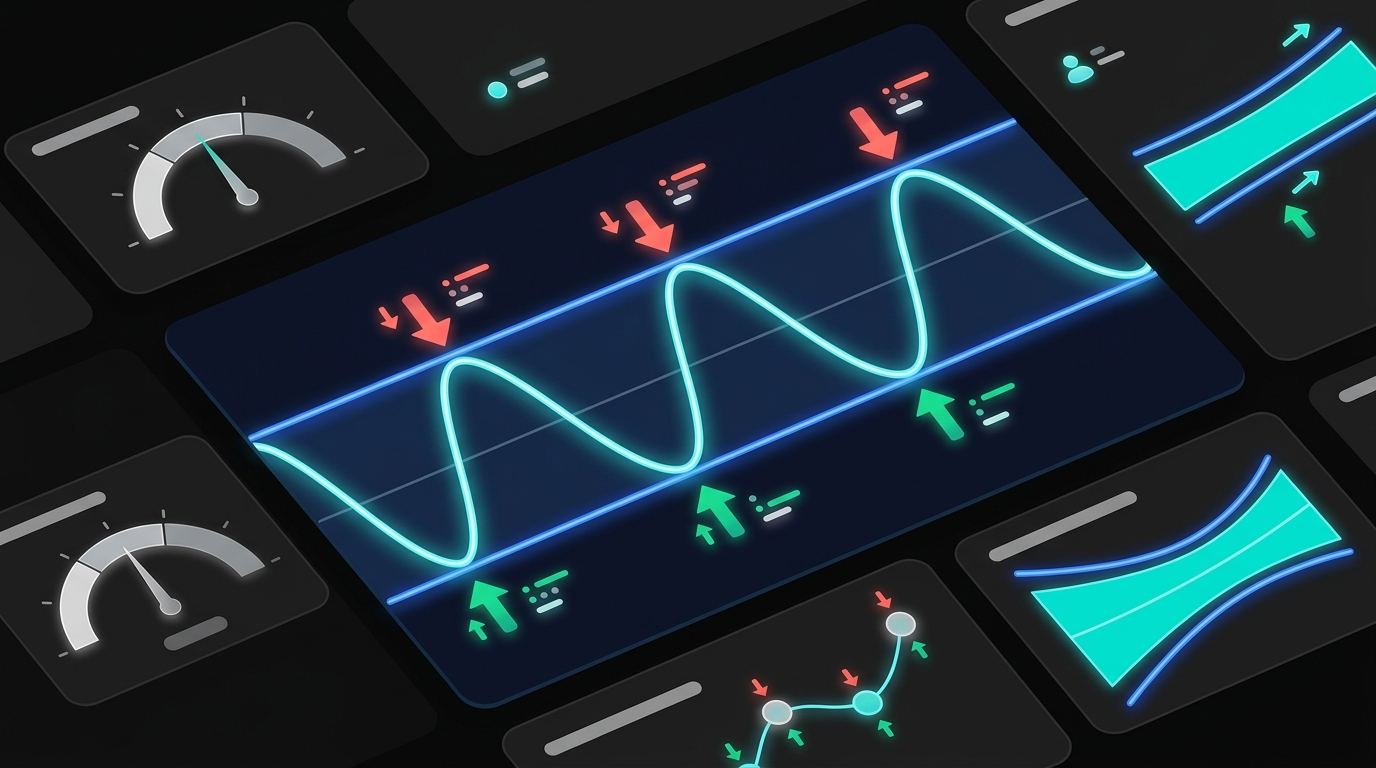
Three observable signals confirm a ranging environment, and the indicator-level confirmation is what separates traders who navigate sideways markets well from those who constantly misread the phase they're in.
Horizontal price movement is the primary visual cue - price tests the same highs and lows repeatedly without extending beyond them. Clearly defined support and resistance bound the range, creating predictable reaction zones. Weakened trend strength indicators confirm what the eye sees: momentum is genuinely absent.
When all four signals align - flat price action, RSI stuck in neutral territory, compressed Bollinger Bands, and ADX under 25 - you have strong confirmation of a sideways market, not just a guess.
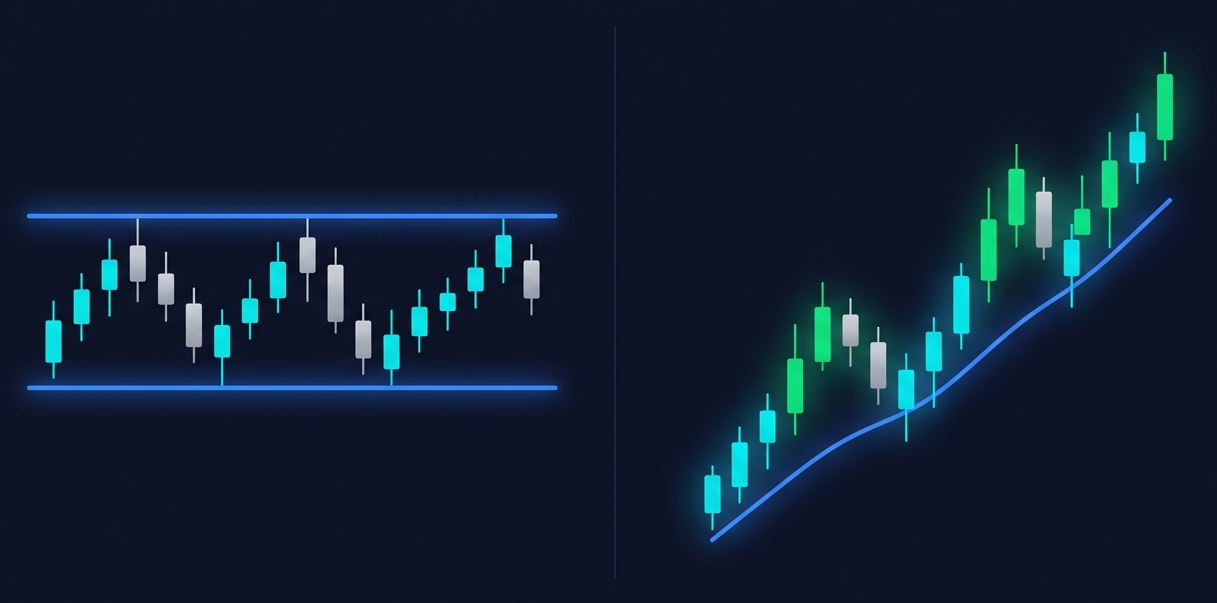
Sideways Market vs. Trending Market: Key Differences
The single most costly mistake in trading is applying the wrong strategy for the market environment. Trend-following and ranging markets don't just require different tactics - they punish each other's logic aggressively.
In a trending market, price forms a sequence of higher highs and higher lows (uptrend) or lower highs and lower lows (downtrend). Momentum builds and sustains. Moving averages slope clearly in one direction. The risk of false signals is lower because price tends to continue rather than reverse.
In a sideways market, none of that structure exists. Price forms roughly equal highs and equal lows. Moving averages flatten out. Volatility stays contained within the range boundaries rather than expanding directionally. Every apparent breakout is suspect.
Knowing which environment you're in before picking a strategy isn't optional - it's the foundation of everything else.
How to Identify a Sideways Market: Practical Recognition Guide
Correctly labeling the market phase before selecting a strategy is arguably the most important skill in trading. Misidentification is expensive. Traders who apply trend-following logic in a ranging environment get whipsawed repeatedly. Traders who range-trade a genuine trend leave most of the move on the table.
Here's the 3-step framework to confirm sideways conditions before committing to a position:
One critical caveat: misidentification risk is highest near the edges of the range. Price testing support or resistance can look like the start of a trend. Don't make phase calls from extreme range positions - let the oscillators confirm neutral momentum before assuming the range will hold.
Chart Patterns Associated with Sideways Markets
The most common chart structure in a sideways market is the horizontal rectangle - two roughly parallel lines forming a channel, with price bouncing between them. When you see 3+ touches of a support level and 3+ touches of a resistance level on a clean chart, you're looking at a well-defined trading range.
A second pattern worth recognizing is the flat consolidation following a sharp move. After a major trend leg, price often pauses in a tight, low-volatility band before the next move. This is textbook institutional accumulation or distribution territory - the bigger the move that preceded it, the more significant the consolidation.
The Bollinger Squeeze is the third, and perhaps most actionable, pattern. When Bollinger Bands contract dramatically - the upper and lower bands nearly touching - it signals that volatility has compressed to an extreme. This isn't a ranging signal per se; it's a pre-breakout warning. The squeeze tells you the market is coiling before a move, but it doesn't tell you direction. Wait for the bands to begin expanding before committing.
Volume adds an important dimension to all of these patterns. In genuine ranging markets, volume typically declines near the center of the range and spikes near the support and resistance extremes. Volume-heavy reversals at these levels validate the range; volume-light touches suggest weaker conviction and a higher false-signal risk.
Best Strategies for Sideways Markets
The most common sideways market strategy mistake isn't picking the wrong indicator - it's picking a strategy built for a trending environment and expecting it to work in a ranging one. Momentum strategies, breakout systems, and trend-following frameworks lose money in sideways markets not because they're poorly designed, but because the market phase they require simply doesn't exist.
Sideways market strategy starts with a mental reset: smaller targets, higher confirmation requirements, and patience over aggression.
Range Trading: Buying Support, Selling Resistance
Range trading is the most direct sideways market strategy. The logic is simple: prices that repeatedly reverse from the same support level and the same resistance level will likely do so again - until they don't.
The critical failure mode in range trading is anticipating reversals too early. Price can spike through support or resistance before reversing - these false breakouts will stop you out if your stop is too tight. Confirmation before entry beats being early.
Mean Reversion and Oscillator-Based Approaches
Mean reversion is the theoretical foundation underlying range trading: in a balanced market, prices that extend too far from the range midpoint will tend to snap back toward equilibrium. This behavior is what makes oscillators so useful in sideways environments.
RSI is the primary tool here. RSI readings approaching 30 - especially with a bullish divergence - suggest the market has pushed too far toward the oversold extreme and is likely to revert toward the midrange. RSI approaching 70 suggests the opposite. In a well-established range, these extremes provide reliable mean-reversion signals.
Bollinger Bands offer a visual equivalent. When price touches or briefly pierces the lower band in a ranging environment, it signals a potential move back toward the 20-period moving average (the band's centerline). The setup becomes stronger when RSI simultaneously confirms oversold or overbought conditions - both indicators pointing to the same extreme is more reliable than either alone.
MACD deserves a specific note of caution: it's poorly suited to sideways markets. In a ranging environment, the MACD line and signal line crossover repeatedly and produce whipsaws. A flattening MACD histogram can confirm range conditions, but using MACD crossovers as entry signals in a sideways market generates significantly more losses than profits. Use RSI and the Stochastic Oscillator instead.
Popular Trading Strategies in Sideways Markets
Not all sideways market approaches are created equal, and the right choice depends on your time horizon, risk tolerance, and experience level.
The Iron Condor deserves attention. This options strategy involves selling a call spread above the resistance level and a put spread below the support level simultaneously - collecting premium on both sides. The trade profits when price stays within the range before expiration, with time decay working in your favor every day. In a prolonged sideways market with elevated implied volatility, Iron Condors can be highly effective. The risk is defined from the start, which makes them a disciplined choice for sophisticated traders who don't want directional exposure.
"Do Nothing" - capital preservation as an active choice - also belongs on this list. Some ranging markets are too narrow, too noisy, or too close to a potential breakout to justify the risk. Stepping back and waiting for a cleaner environment is a strategy, not inaction.
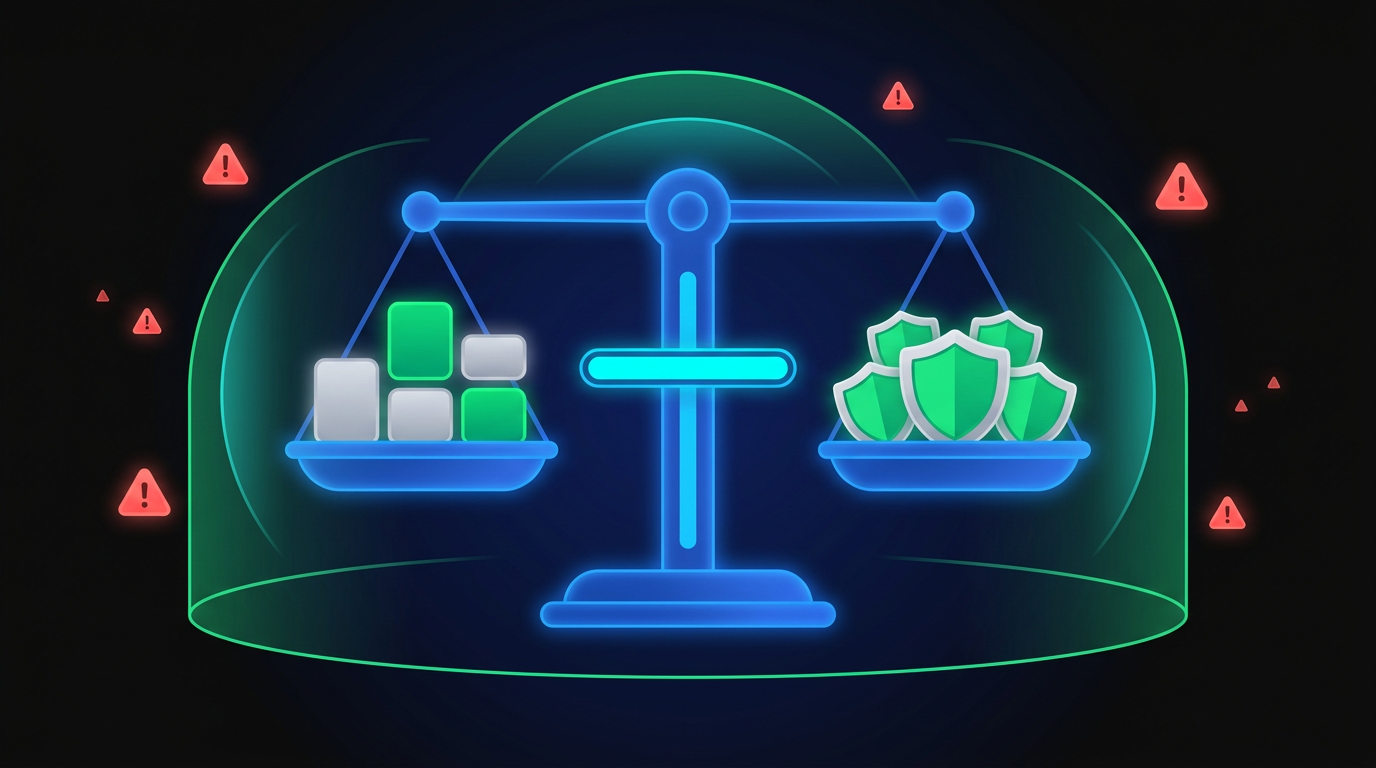
Risk Management in Sideways Markets
In sideways markets, the biggest losses often come not from bad strategy selection but from poor risk management execution. The ranging environment creates specific psychological and tactical challenges that most risk frameworks - designed for trending conditions - don't adequately address.
The primary goal in a sideways market should be capital preservation, not aggressive growth. Every decision should be evaluated through that lens first. Sound crypto risk management becomes even more critical when the market gives you fewer clear directional signals to work with.
Stop-Loss Placement, Position Sizing, and Overtrading Prevention
One additional factor: transaction costs become disproportionately significant in a narrow-range, high-frequency environment. In a trending market, a single trade might capture 5-10% of price movement. In a ranging market, the same trading frequency might yield 1-2% per trade. Spreads, fees, and funding rates that seemed negligible in a trend can quietly consume a third of your edge in a range. Account for them explicitly in your risk-reward calculations.
Common Mistakes to Avoid in Sideways Markets
Knowing the mistakes to avoid is valuable - but equally important is knowing when the sideways phase is coming to an end.
When Does a Sideways Market End? Breakout Recognition and Transition
The most profitable moment in a sideways market is often not while you're in it - it's the moment it ends. A clean exit from a well-established range, correctly identified and traded, can produce a return that dwarfs everything earned within the range itself.
The first visual signal is Bollinger Band expansion. After a prolonged Bollinger Squeeze - bands compressed, near-horizontal - the bands begin to widen. This expansion reflects rising volatility and often precedes a directional move. It doesn't tell you which direction, but it tells you that the equilibrium is breaking down.
Volume is the definitive confirmation signal. A genuine breakout from a ranging market almost always comes with a volume spike - noticeably above the average volume observed during the range. A price close beyond support or resistance on below-average volume is, statistically, a false breakout candidate. This is the single most reliable filter for distinguishing real breakouts from fakes.
📊 Breakout Confirmation Checklist
- Price close - Full candle close decisively beyond support or resistance (not just a wick)
- Volume spike - Volume on the breakout candle is significantly above the 20-period average
- Indicator confirmation - RSI confirms direction: above 50 and rising for upside breakout; below 50 and falling for downside
- Re-test of former boundary - Former resistance tested as support (or vice versa) confirms level has flipped roles
Once a breakout meets these criteria, the strategic pivot is immediate: shift from range-based logic to momentum/trend-following logic. The tools that were counterproductive during the range - MACD crossovers, moving average breakouts - now become relevant again.
Many sideways markets produce multiple false breakout attempts before the real move. Waiting for a confirmed close, plus volume confirmation, plus indicator alignment reduces the false-positive rate dramatically. It will cause you to miss the first few percent of a genuine move. That's an acceptable tradeoff for not getting stopped out four times on failed breakouts first.
Sideways Markets and the Long-Term Investor: Implications and Opportunities
Not everyone trading a sideways market is actively scalping support and resistance. For long-term investors, these phases require a completely different psychological and tactical posture.
The honest truth is that sideways markets test patience in a way that neither bull nor bear markets do. A portfolio can sit flat for months - sometimes years - and the temptation to do something, to reallocate, to chase trending assets, can be intense. That temptation is usually counterproductive.
The most productive use of a sideways market for a long-term investor is portfolio rebalancing. Without strong directional pressure pulling asset weightings in one direction, rebalancing trades can be executed more calmly and at more neutral valuations. An equity-heavy portfolio that drifted during a bull run can be trimmed and rebalanced into target allocations without the emotional weight of selling into a falling market or chasing into a rising one.
Diversification serves a specific function here: reducing opportunity cost. Capital sitting in a sideways asset is capital that isn't working as hard as capital in an asset that's trending. A portfolio with deliberate exposure across different asset classes, geographies, and market structures ensures that the sideways phase in one segment is at least partially offset by movement elsewhere.
The forward-looking perspective matters most. Sideways markets are, structurally, bridge phases within market cycles - they occur between major expansion and contraction periods. Long-term investors who maintain their core allocations and avoid panic-rebalancing during these phases consistently benefit when the next trend begins. The majority of long-term returns come from the relatively brief trending phases that follow consolidation periods. Missing them by over-managing during the range is the more common and costly error.
Conclusion
A sideways market isn't a market that's stopped working - it's a market that's working differently. The consolidation phase has a structure, a logic, and a set of tools specifically calibrated to navigate it. The traders and investors who understand this don't treat ranging conditions as a problem to wait out; they treat them as a different environment that requires a deliberate shift in approach.
If you're an active trader: prioritize range trading and mean reversion frameworks. Confirm all entries with RSI and Bollinger Band signals. Reduce position size below your trending-market default, widen your stops, and trade fewer setups with higher conviction. Track transaction costs explicitly - they matter more here than anywhere else.
If you're a long-term investor: resist the urge to over-manage. Use the period for rebalancing, diversification adjustments, and accumulation at stable prices. Maintain perspective - the next directional trend is being built in the consolidation phase you're watching.
If you're a beginner: develop recognition skills before risk. Paper-trade sideways market setups. Get comfortable identifying ranging environments with ADX, RSI, and Bollinger Bands before real capital is involved. The mistakes made in sideways markets - fighting the range, ignoring costs, over-trading - are expensive regardless of account size.
Every sideways market resolves. Support gives way or resistance breaks, volume confirms the move, and the next trend begins. Platforms built around on-chain transparency and self-custody give you the tools to monitor this transition in real time - without relying on anyone else's interpretation of the data. The discipline built in ranging conditions - patience, precision, rigorous risk management - carries directly into trending conditions and compounds over time.
The market spends more time ranging than most participants realize. The traders who learn to navigate sideways markets don't just survive the flat periods - they use them.
Crypto trading involves substantial risk of loss. Leveraged positions and derivatives carry elevated risk and may not be suitable for all investors. This article is for educational purposes only and does not constitute financial advice. Always conduct your own research before making any trading or investment decisions.
Last updated: April 2026.
Frequently Asked Questions
What is a sideways market?
A sideways market is a market condition where asset prices move horizontally within a defined range, oscillating between a support level and a resistance level without forming a clear upward or downward trend. Also called a ranging market or consolidation phase, it reflects a period of balance between buying and selling pressure. Rather than trending with higher highs and higher lows - or lower lows - price simply bounces back and forth. These phases are a normal part of market cycles and can last from days to years depending on the asset and macro environment.
What is the best strategy for a sideways market?
Range trading - buying near established support and selling near established resistance - is the most direct and widely used sideways market strategy. Mean reversion approaches using RSI extremes (below 30 for longs, above 70 for shorts) or Bollinger Band boundary touches as entry signals are closely related and highly complementary. For options traders, the Iron Condor is a purpose-built sideways strategy that collects premium by selling spreads outside the range boundaries. The right choice depends on your time horizon and experience level.
How do I identify a sideways market using technical indicators?
Use a three-step confirmation process. First, observe price action: look for 3-4 tests of a consistent high and low with no decisive closes beyond either level. Second, check trend indicators: ADX below 25 confirms weak trend strength; flat moving averages corroborate the signal. Third, validate with oscillators: RSI in the 40-60 neutral zone and Bollinger Bands visibly compressing both point to ranging conditions. When all three steps align, you can trade the range with reasonable confidence.
Why do trend-following strategies fail in sideways markets?
Trend-following strategies are built on the assumption that price will continue in the direction it's already moving. In a ranging market, that assumption is structurally wrong - the defining characteristic of a sideways market is that price reverses, not continues. Every apparent continuation gets reversed at the range boundary, and every trend signal - moving average crossover, breakout above a recent high, momentum surge - tends to produce a whipsaw rather than follow-through. The result is a sequence of small losses that compound into meaningful drawdown. The fix isn't finding a better trend indicator; it's identifying the market phase correctly first.
How does a sideways market end and what signals the breakout?
A sideways market ends when the equilibrium between buyers and sellers breaks decisively. The confirmed end signal is a full candle close beyond support or resistance, accompanied by meaningfully above-average volume. Bollinger Bands typically begin expanding before the breakout, signaling rising volatility. RSI confirms direction by crossing above or below 50. After a confirmed breakout, the former boundary often gets re-tested from the new side - former resistance becomes support, or vice versa - providing final confirmation that the ranging phase is complete. False breakouts are common; always require volume confirmation before acting.
What should long-term investors do during a sideways market?
Long-term investors have two primary productive actions during sideways markets: rebalancing and maintaining patience. Rebalancing - adjusting portfolio allocations back to target weightings - is best executed during periods without strong directional pressure, and a sideways market provides exactly that. Asset allocations that drifted during prior trends can be realigned at stable valuations. Maintaining positions and avoiding over-reaction to flat portfolio values is equally important, as sideways markets are bridge phases within broader market cycles; the major trend phases that follow are where long-term returns are generated.
Can you profit from a sideways market?
Yes - sideways markets offer real profit opportunities, but they require different approaches than trending environments. Range trading and mean reversion strategies are both purpose-built for ranging conditions. Options strategies like the Iron Condor profit directly from price remaining within the range, turning the flat market structure into a premium-collection opportunity. Active traders who adapt - using confirmation-based entries, appropriate position sizing, and disciplined stop placement - can generate consistent returns. The key is adaptation to the environment, not persistence with a preferred strategy designed for trending conditions.
