
TRX price prediction is one of the most searched topics in crypto right now - and for good reason. TRON has quietly built one of the most structurally sound use cases in the entire blockchain space, processing billions in stablecoin transfers daily while most of the market chases narrative-driven pumps. In this guide, I break down where TRX is likely headed in 2026, 2027, and through 2030, based on technical indicators, on-chain fundamentals, and historical market cycle patterns.
⚡ Key Takeaways
- TRX is currently trading near $0.31, ranked in the top 10 by market cap (~$29B)
- 2026 forecast range: $0.27-$0.51 (base case), with a breakout scenario targeting $1.20 if $0.50 resistance converts to support
- 2030 projection: $0.38-$4.00 across bear/base/bull models
- Key technical signal: RSI neutral (~65 on 14-day), bearish divergence on the 4H timeframe
- All predictions carry inherent uncertainty. Nothing here is financial advice - crypto trading involves substantial risk of loss.
What Is TRON (TRX)? Blockchain, Utility & Network Overview
TRON is a Layer-1 blockchain that has found a specific, defensible niche in global crypto infrastructure: it's the dominant settlement layer for USDT stablecoin transfers worldwide. The native token, TRX, powers every transaction on the network. With a circulating supply of approximately 94.7 billion TRX and a market cap hovering around $29 billion, it consistently holds a top-10 position in the broader crypto ecosystem.
Understanding what TRON actually does matters more for price prediction than it does for most altcoins. This isn't a speculative narrative play - TRX's value thesis is directly tied to measurable on-chain activity. If you're new to the concept, our guide to what crypto staking is covers the basics of how tokens generate utility and yield on-chain.
How the TRON Network Works: Consensus, Speed & Fees
TRON runs on Delegated Proof of Stake (DPoS) - a consensus model where 27 elected Super Representatives validate blocks. The result is fast and cheap: the network handles approximately 2,000 transactions per second with near-zero fees. Compare that to Ethereum, where a single USDT transfer can cost several dollars during congestion.
That fee differential is the single biggest reason stablecoin issuers and DeFi protocols route volume through TRON rails. Speed and cost matter at scale.
TRX Token Use Cases and Ecosystem Role
TRX serves several functions within the TRON ecosystem. First and most fundamentally, it pays transaction fees on the network. Second, users can stake (freeze) TRX to obtain Energy and Bandwidth resources, which reduces their personal transaction costs. Third, stakers gain voting rights to elect Super Representatives and participate in governance. Beyond the base layer, TRON supports an active DeFi ecosystem including JustLend for lending, SunSwap for decentralized exchange, and a growing slate of Web3 gaming and NFT applications.
Top TRX Use Cases:
- Transaction fee payment - every on-chain operation requires TRX or frozen-TRX resources
- Staking for Energy/Bandwidth - freeze TRX to reduce your own operational costs
- Governance voting - elect Super Representatives and influence protocol direction
- DeFi participation - liquidity provision on SunSwap, lending on JustLend
- Stablecoin rails - the infrastructure underpinning billions in daily USDT transfers
- Web3 gaming and NFTs - growing entertainment layer on TRON's low-fee foundation

TRX Price History: Key Milestones and Price Patterns
Context is everything in crypto price analysis. TRX has been through the full cycle - explosive launch, devastating crash, long dormancy, and a significant 2024 revival. Understanding that history is what separates a grounded forecast from pure speculation.
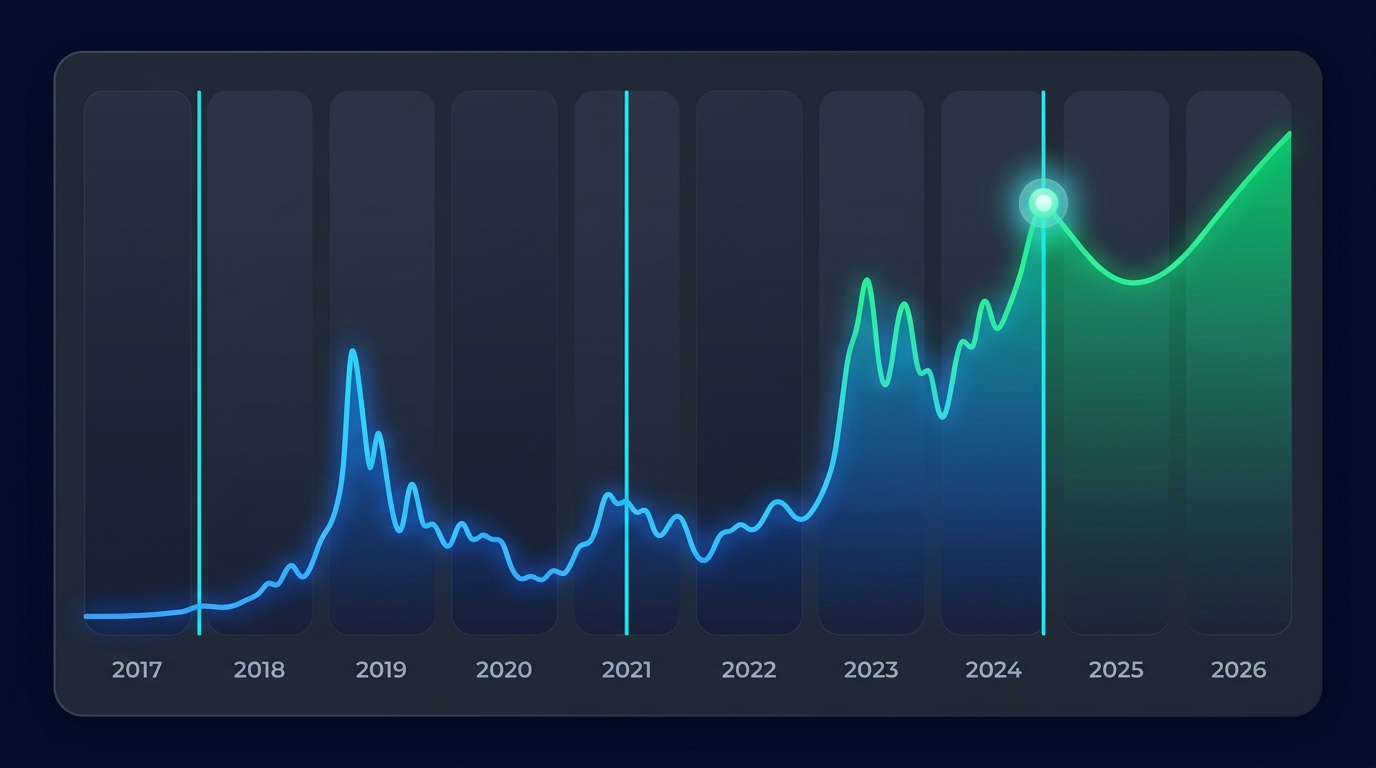
TRX launched via ICO in 2017, then hit an early ATH around $0.30 in January 2018 before the broader crypto bear market hammered it below $0.05. The token spent years range-bound under $0.05 - dismissed by many as dead. Then 2020 marked the beginning of a gradual recovery, and the 2024 bull cycle pushed TRX to a new all-time high of approximately $0.449 in December 2024.
TRX PRICE - KEY HISTORICAL MILESTONES
2017
ICO / Launch - TRX priced at approximately $0.002
January 2018
First ATH - ~$0.30 during the crypto bull cycle
December 2018
Post-crash low - TRX collapsed to ~$0.012 with the broader market
Late 2020
Recovery begins - DeFi boom drives TRX back to the $0.025-$0.04 range
April 2021
Bull cycle peak - TRX reaches ~$0.17 alongside broader altcoin season
December 2024 ← NEW ALL-TIME HIGH
~$0.449 - TRON's stablecoin dominance thesis gains institutional recognition
March 2026
Current range - ~$0.31, approximately 30% below ATH
TRX and Bitcoin Halving: Historical Correlation
One of the most reliable patterns in crypto is the Bitcoin halving cycle - and TRX, like most altcoins, shows a lagged but amplified response to it. The April 2024 Bitcoin halving triggered the cycle that drove TRX to its ATH in December of the same year. Historical patterns suggest altcoins experience their strongest repricing 6-18 months after a halving event, as Bitcoin dominance peaks and capital rotates into the broader market.
The 2026 forecast window sits squarely in that post-halving rotation zone. That doesn't mean TRX will repeat its 2024 performance, but it does mean macro timing is relatively favorable for altcoin positioning - a factor any honest TRX analysis should account for.
TRX Price Prediction 2026: Short-Term Forecast and Technical Targets
The 2026 TRX price prediction picture is genuinely bifurcated. Conservative models cluster around a range of $0.27-$0.38 for most of the year, while more aggressive technical models target $0.50-$0.51 by year-end. A breakout scenario - requiring TRX to reclaim and hold $0.50 as support - opens a path toward $1.00-$1.20 that some analysts have cited, though this assumes a sustained bull market environment.
The Fear & Greed Index is sitting in extreme fear territory (reading: 13), which historically has marked periods of accumulation before trend reversals. Sentiment alone doesn't drive price - but when combined with neutral RSI readings and constructive on-chain data, it adds weight to the base case.
Aggregated from multiple analyst model ranges including CoinCodex, Cryptopolitan, and Binance user consensus data. Not financial advice. Actual prices may vary significantly.
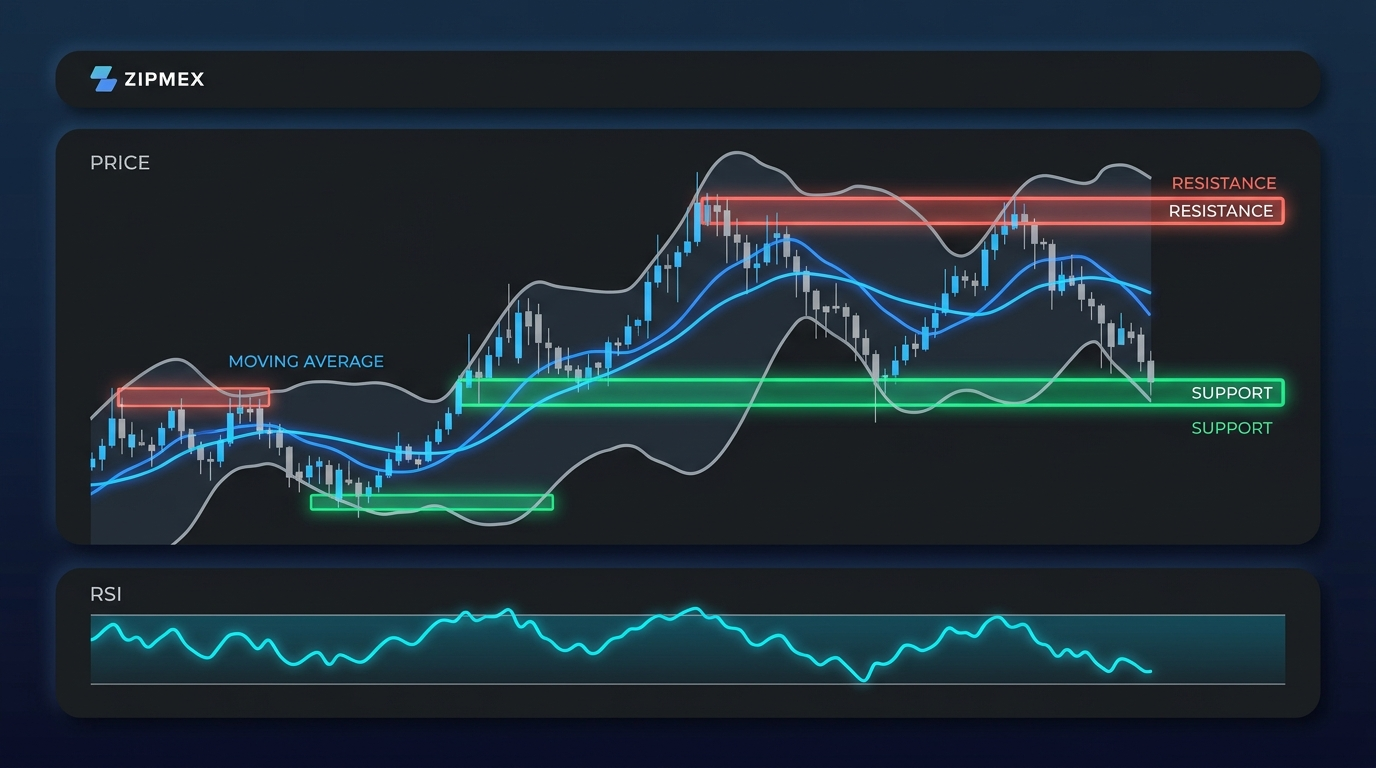
Technical Analysis of TRX: RSI, MACD, Moving Averages & Bollinger Bands
Five indicators dominate professional TRX technical analysis. Each tells a different part of the story - and reading them together gives a clearer picture than any single signal alone.
All values should be verified against live chart data at time of trade. Technical signals are dynamic and shift with each session.
RSI: At 65.23 on the daily, TRX sits in the neutral zone - not overbought, not oversold. The bearish divergence on the 4H is a weak warning signal: price has been making higher highs while RSI makes lower highs, which sometimes precedes short-term corrections. It's not a reversal signal on its own, but it warrants caution for short-term entries.
Moving Averages: The daily chart shows TRX trading above both its 50-day and 200-day SMAs - structurally bullish positioning. However, both averages are sloping downward on the daily, which means momentum is softening. The weekly 200-day SMA has been rising since September 2025, offering longer-term structural support.
MACD: Clean on the weekly - no divergence, which means the longer-term trend hasn't signaled exhaustion. Day traders using the 4H MACD should watch for histogram crossovers as entry confirmation triggers.
Bollinger Bands: Current compression on the daily suggests a volatility expansion is approaching. The direction of that expansion - upward breakout or downward flush - is what the $0.31-$0.32 resistance level will largely determine.
Fibonacci Retracement: Drawing from TRX's 2024 swing high (~$0.449) to recent lows, key Fibonacci levels sit at approximately: 0.382 retracement at ~$0.34, 0.500 level at ~$0.37, and 0.618 retracement at ~$0.40. These levels represent logical short-term resistance and profit-taking zones. A clean break above $0.40 with volume confirmation would shift the intermediate-term bias meaningfully bullish.
TRX Support, Resistance Levels & Key Price Zones for 2026
Price doesn't move in a vacuum - it moves between zones of supply and demand. For TRX in 2026, these are the levels that matter:
Immediate support: $0.28-$0.285 - this range has attracted consistent buyer interest. Multiple bounces from this zone confirm its significance. A clean break below $0.28 opens a retest of $0.26-$0.27.
Near-term resistance: $0.31-$0.32 - TRX has repeatedly stalled here. Buyers need to convert this into support before the bullish case gains conviction.
Major resistance: $0.44-$0.45 - the ATH zone from December 2024. Any approach to this level faces significant selling pressure from holders who bought near the top.
Critical breakout level: $0.50 - the psychological and technical line in the sand. If TRX reclaims $0.50 and holds it across multiple sessions, historical resistance at $0.80-$1.20 weakens substantially.
TRX Price Prediction 2027-2030: Long-Term Forecast Scenarios
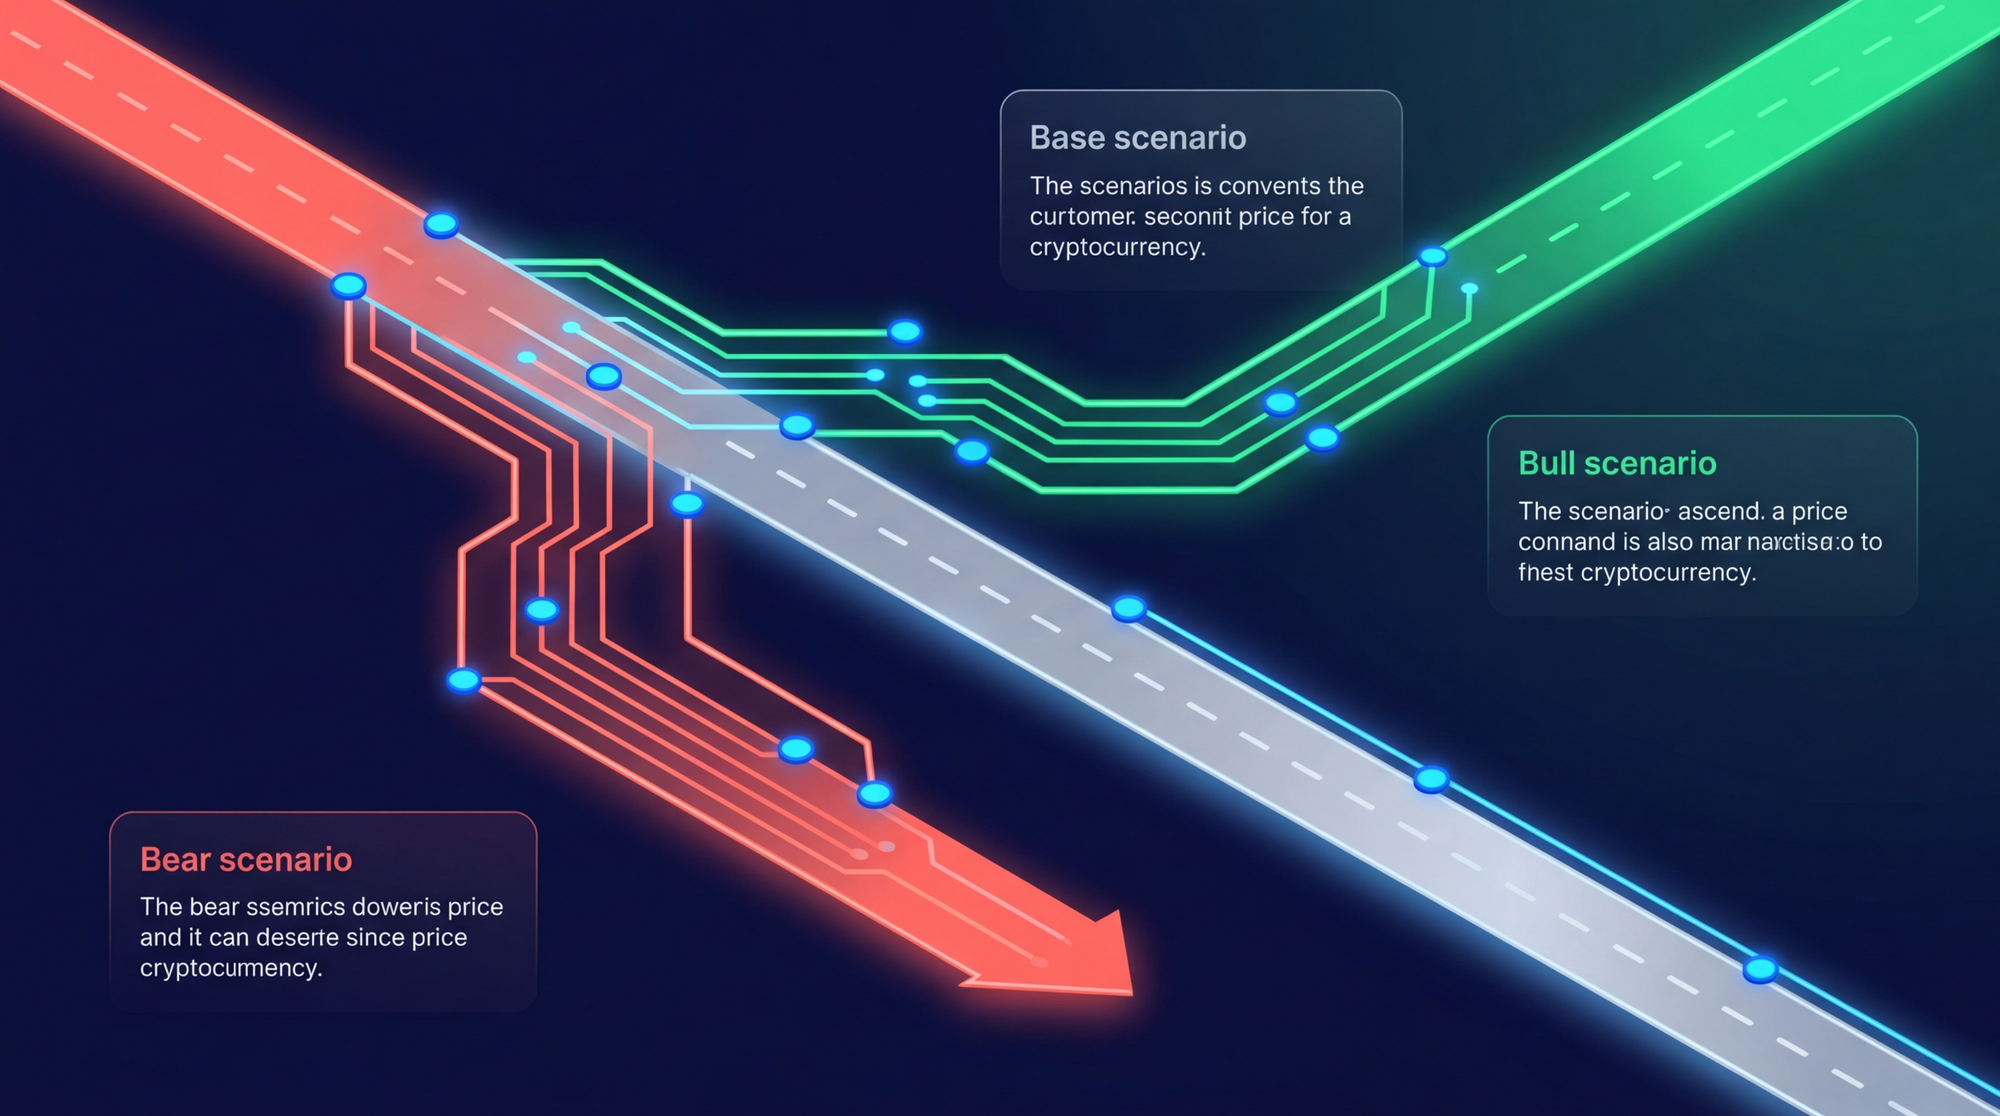
Long-term crypto forecasting carries far more uncertainty than short-term technical analysis. By 2027-2030, the variables that matter most - regulatory frameworks, stablecoin adoption curves, DeFi TVL growth, macro liquidity cycles - are difficult to model with confidence. What's possible is to define the scenarios clearly.
Sources: Aggregated from CoinCodex, Cryptopolitan, Binance user consensus, and Coinpedia analyst models. Long-term forecasts carry substantially higher uncertainty than short-term projections. Not financial advice.
The bear case assumes regulatory headwinds for stablecoins suppress TRON's primary use case and that broader altcoin markets remain range-bound. The base case assumes continued USDT volume growth and an orderly Bitcoin-driven macro cycle. The bull case - particularly the $4.00 target for 2030 - requires both a strong macro cycle AND significant expansion of TRON's role in global stablecoin infrastructure.
TRX Price Prediction 2040 and Beyond
Ultra-long-term forecasts deserve proportionally more skepticism. CoinCodex models project TRX reaching approximately $1.60 by 2040 and $2.46 by 2050 - conservative extrapolations of sustained but modest growth. On the extreme end, a small number of analysts have cited targets well above $10 by 2050, but these require extraordinary assumptions about global blockchain adoption that have essentially no historical precedent. The honest answer: a 2040 TRX forecast is scenario analysis, not prediction.
Key Fundamental Drivers Behind TRX Price: What Moves TRON?
Technical levels explain where TRX might trade. Fundamentals explain why it would. Five drivers dominate the TRX price equation - and understanding them separates informed positioning from guesswork.
📊 Five Key Drivers of TRX Price
- USDT Transfer Volume - TRON processes the majority of global USDT stablecoin transactions. As adoption grows, demand for TRX scales proportionally.
- DeFi TVL on TRON - Total value locked in protocols like JustLend and SunSwap reflects ecosystem health and fee revenue generation.
- BTC / Macro Cycle Correlation - TRX correlates meaningfully with broader crypto cycles. Bull markets lift major assets; bear markets compress them.
- Regulatory Developments - Stablecoin regulation is the swing factor. Regulatory clarity → bullish for USDT volume → bullish for TRX. Crackdown → direct hit to the primary use case.
- Justin Sun's Ecosystem Leadership - Positive partnerships drive short-term catalysts. Controversies historically trigger selloffs - this concentration risk is real.
TRON's Stablecoin Dominance: The Core Bullish Thesis
This is where the TRX bull case lives. TRON processes a larger share of global USDT transfers than any other blockchain - consistently outpacing Ethereum for stablecoin settlement despite Ethereum's larger overall ecosystem. Every single USDT transfer on TRON consumes TRX for fees, either directly or through frozen-TRX energy mechanisms.
As digital payment flows expand - remittances, DeFi settlements, emerging market dollar alternatives - TRON's infrastructure role becomes more entrenched. The on-chain data bears this out: TRON's TVL showed +4.97% resilience in a recent week where Ethereum fell 3.55% and Solana dropped 3.28%. That decoupling reflects structural demand that isn't purely speculative.
For real-time data, TRONSCAN and DeFiLlama track TRON's USDT share and TVL metrics. Before making any positioning decision, verify these numbers against current conditions.
Risks and Bearish Scenarios for TRX Price
⚠ TRX Risk Factors
- Stablecoin regulation risk → Could directly undermine TRON's primary use case if USDT issuance is restricted
- Competition from Ethereum L2s and Solana → Narrowing fee gap erodes TRON's cost advantage for stablecoin transfers
- Justin Sun concentration risk → Founder controversies have historically triggered immediate selloffs
- Broader crypto bear market → TRX is not immune to macro drawdowns regardless of fundamentals
- On-chain activity decline → Falling daily active addresses or transaction counts weakens the stablecoin thesis
How to Buy TRX: Getting Started with TRON Investment
TRX is one of the most accessible cryptocurrencies to purchase. It trades on virtually every major exchange with deep liquidity and tight spreads.
Step-by-Step: How to Buy TRX
- Choose a reputable exchange - Binance, Coinbase, Kraken, OKX, and KuCoin all list TRX with strong liquidity. Compare fees and check whether the exchange serves your jurisdiction before signing up.
- Create and verify your account - All regulated exchanges require KYC (Know Your Customer) verification. Have government ID and a selfie ready. Verification typically takes 10 minutes to 24 hours.
- Deposit funds - Bank transfer (ACH/SEPA) typically has the lowest fees. Credit/debit cards are faster but more expensive. Depositing USDT or another stablecoin and then buying TRX avoids fiat rails entirely.
- Search for TRX and place your order - A market order fills immediately at current price. A limit order lets you specify the exact price you're willing to pay - use this if you're targeting a specific support level.
- Decide: exchange wallet or self-custody - For small positions or active trading, the exchange wallet is fine. For larger holdings, transfer TRX to a self-custodial wallet (TronLink, Ledger with TRX support). Self-custody means you control your private keys - and therefore your funds.
Security basics: Enable two-factor authentication (2FA) immediately on any exchange account. For holdings above a few hundred dollars, a hardware wallet is worth the upfront cost.
TRX Investment Approach: Strategies, Risk Management & Portfolio Sizing
Knowing TRX's price target is only half the equation. How you structure your exposure - entry method, position size, exit discipline - determines whether forecast accuracy translates into profit. Understanding TRX's risk profile is the foundation; building a sensible approach on top of it is what separates disciplined traders from gamblers. For a broader framework on trading safely, see our guide to safe cryptocurrency trading.
Popular Trading Strategies for TRX: Day Trading, Swing, HODL & DCA
HODL suits investors with a 3-5 year conviction on TRON's stablecoin infrastructure thesis. If TRON maintains its USDT dominance and global digital payment adoption continues expanding, the compounding effect of network growth should eventually reprice TRX higher. Position sizing matters more than entry price at this horizon.
Dollar-Cost Averaging (DCA) removes timing pressure by buying fixed amounts at regular intervals. If TRX trades between $0.27 and $0.45 throughout 2026, a DCA approach builds an average cost somewhere in the middle of that range rather than requiring you to nail the bottom.
Swing Trading on TRX works well because the asset exhibits predictable range behavior. A practical framework: wait for RSI to fall below 35 on the daily chart, look for a bullish reversal candle near the $0.28-$0.285 support zone, then set an initial target at the 0.618 Fibonacci retracement (~$0.40) with a stop-loss below $0.265.
This is a framework illustration, not a specific trade recommendation. Crypto trading involves substantial risk of loss.
Day Trading TRX on the 4H chart using MACD crossovers as entry signals and the 50-day SMA as a dynamic support reference is viable for experienced traders. TRX's medium volatility (~3.63% daily) makes it less punishing than micro-caps while still offering sufficient movement for intraday opportunities.
TRX Staking: How to Earn Passive Income on TRON
Staking TRX turns a passive holding into an active yield position. The mechanism: freeze TRX in your wallet to receive Energy and Bandwidth resources. By delegating frozen TRX voting power to high-performing Super Representatives, you earn staking rewards. For a foundational explanation of how staking works across blockchains, see our staking guide.
Current TRX staking APY typically ranges from approximately 4-6% through native delegation, though rates fluctuate with network conditions. Verify current APY on TRONSCAN's SR list before committing funds.
How to Stake TRX - 4 Steps:
- Transfer TRX to TronLink wallet or a compatible self-custodial wallet
- Select "Freeze" in the wallet interface and choose your freeze amount
- Choose to delegate voting power to a Super Representative (research voting rewards and uptime)
- Collect rewards at regular intervals - most SR rewards are distributed daily
Risk Management Basics for TRX Investors
Position sizing is more important than entry price. Here are the core principles:
- Never allocate more than you can afford to lose in full - TRX can drop 40-60% in a bear cycle regardless of fundamentals
- Use stop-loss orders on active trades - a mental stop isn't a stop; set it in the system
- Diversify beyond crypto - uncorrelated asset classes reduce overall portfolio volatility
- Understand leverage risk - any leveraged TRX position amplifies both gains and losses proportionally
- Track your average cost basis - knowing your break-even prevents emotional decision-making during drawdowns
Crypto trading involves substantial risk of loss. Leveraged positions can result in losses exceeding your initial deposit. Ensure you fully understand the risks before trading.

TRX Alternatives: Other Layer-1 Blockchains to Consider
TRX deserves a place in any crypto research process - but understanding how it compares to adjacent Layer-1 options helps you allocate with precision rather than instinct.
TVL figures are approximate and change with market conditions. Verify on DeFiLlama at time of research.
TRON's clearest competitive advantage is the stablecoin transfer niche - no other chain moves as much USDT volume at TRON's cost level. Ethereum's advantage is ecosystem depth: more developers, more protocols, more institutional integrations. Solana offers the highest raw throughput but comes with a more volatile investment profile. The "best" Layer-1 depends on your thesis. Platforms built on self-custody and on-chain verifiability - including those in the derivatives and perpetual futures space - reflect a broader trend toward trustless, transparent infrastructure that TRON's architecture exemplifies at the settlement layer.
Conclusion: Is TRX a Good Investment in 2026 and Beyond?
The TRX price prediction landscape for 2026-2030 is defined by one central question: does TRON's stablecoin dominance prove durable enough to support a meaningful repricing over the next halving cycle? Based on current on-chain data and structural metrics, the foundation is stronger than most of the market appreciates.
✓ CONSERVATIVE APPROACH
TRX's medium volatility, staking yield (~4-6%), and structural USDT demand make it more defensible than most altcoins - provided $0.28 support holds and stablecoin regulation doesn't materialize as a direct threat. DCA entry, small allocation.
◎ MODERATE APPROACH
Base case 2026 targets ($0.38-$0.45) offer a credible risk-reward for swing traders who buy near support with defined stop-losses. Post-halving timing is favorable. Staged entry into the $0.28-$0.31 zone.
✕ HIGHER-RISK APPROACH
The breakout scenario - TRX above $0.50, targeting $1.00-$1.20 - requires both technical confirmation and supportive macro conditions. Wait for the breakout to confirm before sizing in. Don't anticipate it.
Always conduct your own research, verify current on-chain metrics at TRONSCAN and DeFiLlama, and size positions according to your actual risk tolerance - not your conviction in any forecast.
Crypto trading involves substantial risk of loss. This article is for informational purposes only and does not constitute financial or investment advice. Past performance is not indicative of future results.
Last updated: March 2026.
Frequently Asked Questions
What is TRX and what is it used for?
TRX is the native token of the TRON blockchain, a Layer-1 network founded by Justin Sun in 2017. Its primary function is paying transaction fees on the network. Users can also stake (freeze) TRX to obtain Energy and Bandwidth resources - reducing their own transaction costs - and vote in governance decisions. TRON's most significant real-world use case is stablecoin settlement: the network processes a dominant share of global USDT transfers, making TRX structurally tied to the growth of stablecoin adoption worldwide.
What is the TRX price prediction for 2026?
The 2026 TRX price prediction ranges across analyst models. Conservative estimates place TRX between $0.27 and $0.38 for most of the year. Moderate models target $0.38-$0.51 by year-end. A breakout scenario - requiring TRX to reclaim and hold the $0.50 level as support - opens a path toward $1.00-$1.20. The base case assumes TRON's stablecoin dominance continues and the broader post-halving crypto cycle remains constructive. All forecasts carry substantial uncertainty and should not be treated as financial advice.
What is the TRX price prediction for 2030?
The 2030 TRX price prediction ranges from approximately $0.38 (bear case) to $4.00 (extreme bull case), with most base case models sitting between $0.62 and $1.00. CoinCodex projects approximately $0.98 by end-2030. The extreme bull case requires both sustained stablecoin adoption growth and a supportive macro cycle. Use the scenario range to think through risk/reward rather than anchoring on any single figure.
Is TRON a good investment in 2026?
Whether TRON is a suitable investment depends entirely on your risk profile, investment horizon, and thesis. TRX's structural case - stablecoin settlement dominance, consistent on-chain activity, and a favorable post-halving timing window - is stronger than in previous cycles. That said, regulatory risk to stablecoins, competition from other chains, and Justin Sun's headline risk are genuine concerns. No cryptocurrency is a universally "good investment" - it depends on allocation size, entry price, and exit discipline. This article does not constitute investment advice.
How does TRON's stablecoin dominance affect TRX price?
TRON's stablecoin dominance creates structural demand for TRX through a direct mechanism: every USDT transfer on TRON requires TRX (or frozen-TRX Energy) to cover fees. As global stablecoin transfer volume grows - driven by remittances, DeFi settlements, and emerging market dollar demand - transactional demand for TRX scales proportionally. This provides a demand floor that most altcoins lack. The mechanism is fully verifiable on-chain via TRONSCAN, making it one of the more transparent fundamental drivers in the altcoin market.
Can I stake TRX and earn passive income?
Yes - TRX staking is native to the TRON protocol. By freezing TRX in a compatible wallet (TronLink, Ledger), you receive Energy and Bandwidth resources and earn voting rights. Delegating those votes to active Super Representatives generates staking rewards paid in TRX. Current TRX staking APY typically ranges from approximately 4-6% through native SR delegation, though rates fluctuate based on network conditions and staking participation rates. Verify current figures on TRONSCAN's SR list before committing funds - staking rewards are paid in TRX, so total return also depends on TRX's price performance.
What are TRX's key support and resistance levels in 2026?
TRX's critical price zones for 2026: immediate support at $0.28-$0.285 (multiple confirmed bounces), near-term resistance at $0.31-$0.32 (repeated stall zone), major resistance at $0.44-$0.45 (ATH zone from December 2024), and the pivotal $0.50 breakout level. Holding above $0.28 is the base requirement for any bullish 2026 scenario. Reclaiming $0.50 as support would represent a significant structural shift, opening the path toward $0.80-$1.20. A break below $0.265 would suggest the correction from the ATH has further to run.
