
Any serious iost price prediction has to start with a blunt assessment: IOST is a micro-cap altcoin trading at roughly $0.0011 as of April 2026, sitting deep below its all-time high, and carrying every risk that comes with that territory. That said, the underlying technology - a purpose-built Layer-1 blockchain with a genuinely differentiated consensus mechanism - gives it more substance than most coins at this price level. This guide breaks down yearly forecasts through 2030, a full technical analysis, tokenomics fundamentals, and a clear-eyed look at the risks before you commit a single dollar.
⚡ Key Takeaways
- Current price: ~$0.0011 (April 2026)
- Short-term outlook: Bearish-to-neutral - the 4H 50 DMA is sloping down; RSI is in the neutral 30-70 zone with a weak bearish divergence signal
- 5-year consensus: Market aggregators project modest appreciation to ~$0.0014 by 2031 (+27.6%), though bullish altcoin season scenarios could push significantly higher
- Key risk: IOST operates in an extremely competitive Layer-1 space against chains with substantially larger developer ecosystems
- Technology edge: Proof of Believability (PoB) consensus enables high throughput without the energy costs of PoW or the wealth-concentration issues of pure PoS
What Is IOST? Understanding the Internet of Services Token
IOST (Internet of Services Token) is the native cryptocurrency of the IOS blockchain - a next-generation infrastructure designed to support a service-oriented, decentralized ecosystem. The project launched via ICO in early 2018, raising $31.3 million worth of Ethereum, and initially issued IOST as an ERC-20 token on the Ethereum network. The mainnet went live in February 2019, at which point IOST migrated to its own independent chain with its own consensus layer.
The core thesis behind IOS is straightforward: existing blockchains struggle to support the volume and complexity of real-world service applications. IOST was engineered from the ground up to handle developer-deployed decentralized applications (dApps) at production scale, prioritizing throughput and cost efficiency over the constraints that hamper first-generation networks.
To understand what drives IOST's price, we need to dig into the mechanics that make its blockchain distinct.
How Proof of Believability Works
Proof of Believability (PoB) is IOST's answer to the scalability-security tradeoff that has plagued both Proof of Work and Proof of Stake systems. Rather than selecting validators purely by computational power or staked wealth, PoB assigns each node a "believability score" - a composite metric that weights both token contribution (similar to stake) and behavioral reputation (consistent, honest validation history over time).
Nodes with higher believability scores get proportionally more validation opportunities, and their recent transaction processing is sampled rather than fully re-verified by the network. This dramatically reduces computational overhead and enables throughput that comfortably exceeds first-generation chains, with the IOS network targeting up to 100,000 TPS in theoretical maximum.
For traders evaluating IOST as an investment, PoB represents genuine technical differentiation - not marketing language. The question is whether that technical edge translates into ecosystem adoption, which is where the fundamental analysis gets interesting.
IOST Token Use Cases and Ecosystem
Token utility is the bridge between blockchain technology and token price. A chain can have superior architecture; without demand for its native token, that architecture doesn't generate price appreciation. IOST has several concrete utility functions baked into its ecosystem:
- Transaction fees (gas): All IOS network operations - transfers, smart contract execution, dApp interactions - are paid in IOST
- Staking for network participation: Token holders stake IOST to earn validator rights and participate in the believability scoring system
- Developer deployment costs: Deploying dApps and smart contracts on the IOS chain requires IOST
- Governance: IOST holders can participate in protocol governance proposals
- DeFi and gaming applications: DeFi protocols built on IOS use IOST as collateral and fee currency; on-chain games use it for in-game transactions
The key implication for iost price prediction: as the IOS ecosystem expands - more dApps, more DeFi TVL, more active users - demand for IOST as the operational fuel of that ecosystem should increase. If you're new to how token utility works within DeFi systems, our DeFi explainer covers the fundamentals clearly. The current ecosystem is modest in scale compared to Ethereum or Solana, which is both the risk and the opportunity.

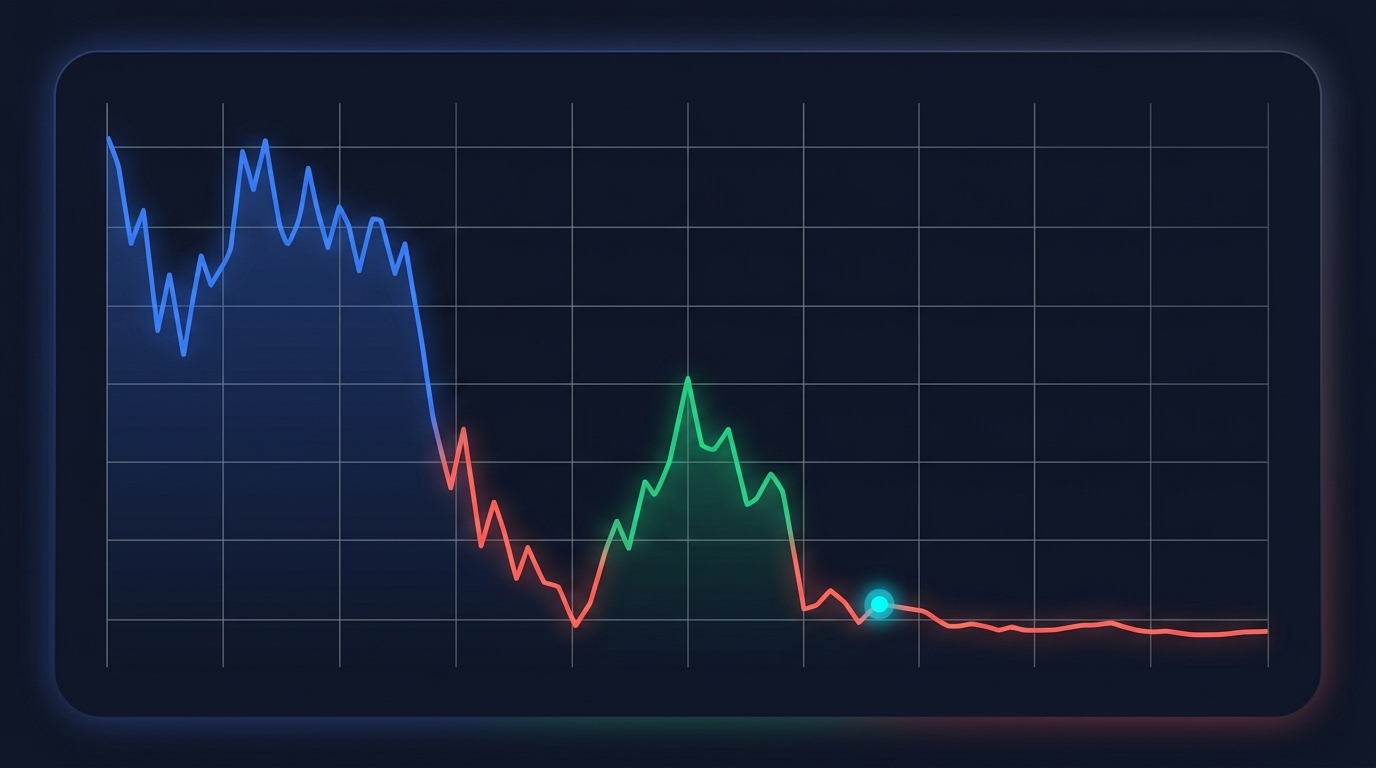
IOST Price History: Key Milestones and Market Cycles
As of April 2026, IOST trades at approximately $0.0011. That single data point tells a stark story when you set it against the project's history.
IOST PRICE MILESTONE TIMELINE
Early 2018
ICO launch (ERC-20 token) - price approximately $0.013 per token
January 2018 - ALL-TIME HIGH
IOST reaches ATH of approximately $0.117, driven by ICO-era crypto mania
February 2019
Mainnet launch - IOST migrates from ERC-20 to independent chain; price ~$0.006 (-95% vs ATH)
March 2020 - COVID Crash Low
Broad crypto market crash brings IOST to ~$0.0003 (-99.7% vs ATH)
April 2021
Bull market recovery peak - IOST reaches ~$0.017 (partial recovery, still -85% vs ATH)
December 2022
Post-FTX bear market bottom - IOST returns to ~$0.0005 (-99.6% vs ATH)
April 2026 - Current
IOST trades at ~$0.0011, approximately -99.1% below its all-time high
The pattern is clear and it mirrors virtually every mid-to-low cap altcoin: explosive ICO-era gains, catastrophic drawdowns during bear markets, partial recoveries during bull cycles, and persistent failure to reclaim all-time highs. IOST's price is almost entirely correlated with Bitcoin's market cycles - when BTC runs, IOST follows; when BTC corrects, IOST overcorrects.
This isn't a flaw unique to IOST. It's the defining characteristic of the altcoin category. CoinMarketCap data consistently shows that IOST's cycle moves have mirrored BTC direction with amplified magnitude - meaning a major BTC rally can push a mid-cap altcoin like IOST up 75-250%, while a 40% BTC drawdown can cut that altcoin 60-80%. Understanding this dynamic is essential context for the forward-looking forecast below. For broader context on how altcoin cycles relate to Bitcoin halvings, our EOS price prediction analysis covers similar cycle mechanics for comparable Layer-1 tokens.
IOST Price Prediction 2026-2030: Yearly Forecast Breakdown
These forecasts combine three analytical layers: technical indicator readings from current price action, on-chain fundamentals and token supply dynamics, and historical market cycle positioning. None of this constitutes financial advice - these are structured projections based on available data, not certainties. Crypto markets can invalidate any model in weeks.
⚠ Risk Disclaimer
- All price figures above are projections, not guarantees of any outcome
- Crypto trading involves substantial risk of loss - you may lose your entire investment
- Past price performance is not indicative of future results
- Nothing in this article constitutes financial advice
IOST Price Prediction 2026
The near-term picture for IOST is cautious. On the 4-hour chart, the 50-day moving average is sloping downward - a textbook bearish signal. The 200 DMA sits above the current price on all timeframes, acting as overhead resistance that IOST would need to clear before any meaningful breakout. The RSI sits in the neutral 30-70 zone with a weak bearish divergence reading in the last 14 candles - not screaming reversal, but not building bullish momentum either.
Market aggregator data for May 2026 shows a wide range - a projected high around $0.0028 against an average closer to $0.00067, reflecting the extreme uncertainty in short-term altcoin forecasting. Support around $0.0005-$0.0007 represents the downside floor if broader market conditions deteriorate.
IOST Price Prediction 2027-2028
The 2027-2028 window is the most analytically interesting in this forecast. Bitcoin's April 2024 halving historically produces its most powerful altcoin season effects 18-36 months later - which maps to late 2025 through 2027. If that cycle plays out as previous halvings suggest, IOST could see significant amplification.
On the weekly MACD, there's currently no histogram divergence - momentum is flat and neutral. Bollinger Bands are compressed, which typically precedes a volatility expansion in either direction. The direction of that expansion depends heavily on whether BTC sustains its macro trend.
↓ BEARISH SCENARIO
2027: $0.0006-$0.0010 | 2028: $0.0008-$0.0012
Crypto bear market persists or regulatory pressure suppresses altcoin demand. IOST fails to attract capital rotation.
→ BASE CASE SCENARIO
2027: $0.0015-$0.0025 | 2028: $0.0025-$0.0040
Moderate altcoin season with steady IOS ecosystem growth. IOST outperforms its 5-year consensus slightly.
↑ BULLISH SCENARIO
2027: $0.0040-$0.0060 | 2028: $0.0070-$0.0100
Full altcoin season materializes. IOST attracts capital rotation into high-throughput Layer-1 narrative. Significant dApp adoption on IOS chain drives organic token demand.
The Binance 5-year consensus model extrapolates IOST to approximately $0.0012 by 2028 based purely on trend projection - but that model doesn't capture cycle dynamics. The bullish scenario is plausible if, and only if, the broader altcoin market participates in a post-halving expansion.
IOST Price Prediction 2029-2030
Long-range crypto forecasting comes with a built-in honesty caveat: 4-5 year predictions carry error margins wide enough to drive a truck through. That said, structured scenario analysis still has value for positioning decisions.
Fibonacci Retracement levels from IOST's all-time high of approximately $0.117 give us potential recovery targets: the 0.382 level sits around $0.044, while the shallower 0.236 level is approximately $0.028. These aren't price targets - they're magnetic zones that prices tend to test during strong recovery cycles.
The Binance community consensus projects just $0.0014059 by 2031 - a 27.6% gain from today's price. That conservative figure reflects genuine market skepticism about IOST's ability to gain significant share in an increasingly competitive Layer-1 environment.
Technical Analysis Deep Dive: Indicators Driving IOST's Price
Technical analysis identifies patterns in IOST's price chart that help traders time entries and exits. None of the top-ranking competitor articles dedicate meaningful space to this - which is a miss, given that TA is precisely how active traders approach a coin like IOST. Here's what the charts are actually saying. For a practical application of these indicators in a real trading pattern, our falling wedge pattern guide walks through RSI divergence, MACD confirmation, and stop-loss placement in detail.
Moving Averages and Trend Analysis
Moving averages are the backbone of trend analysis. The 50 DMA reflects short-to-medium term momentum; the 200 DMA represents the long-term trend direction. When the 50 DMA crosses above the 200 DMA, traders call it a Golden Cross - a bullish signal. When it crosses below, that's a Death Cross - bearish.
Currently, IOST is in a Death Cross configuration across multiple timeframes. The 4H 50 DMA is sloping downward, confirming short-term bearish momentum. On the daily chart, the 50 DMA is sloping upward but sits above the current price - meaning it's acting as resistance rather than support. The 200 DMA is above price on the 4H, 1D, and weekly charts, all sloping down.
For a bullish reversal, IOST needs to: (1) push above the daily 50 DMA resistance, (2) hold that level as support, and (3) ultimately generate a Golden Cross on a higher timeframe. Until that sequence plays out, the path of least resistance is sideways-to-lower. Patient traders watch for the 200 DMA to flatten before positioning for a recovery.
RSI, MACD, and Momentum Indicators
Three momentum tools fill in what moving averages can't tell you.
RSI (Relative Strength Index) measures whether a price move is exhausted or has room to run. Above 70 = overbought (potential reversal lower). Below 30 = oversold (potential reversal higher). Currently, IOST's RSI sits in the neutral 30-70 band - no extreme signal. More notably, the last 14 candles show a weak bearish divergence (price made a higher high while RSI made a lower high), which is a soft warning signal for bulls.
MACD (Moving Average Convergence Divergence) tracks momentum by measuring the relationship between two EMAs. On IOST's weekly chart, the MACD histogram currently shows no divergence - momentum is genuinely flat. That's not a buy signal or a sell signal; it's a "wait and see" reading.
Bollinger Bands measure volatility. When the bands compress tightly around price - as they currently are on IOST's daily chart - a breakout is statistically likely. The compression alone doesn't tell you which direction. Watch for the bands to start expanding: a close above the upper band on strong volume signals a bullish breakout; a close below the lower band confirms continued downside.
IOST Fundamental Analysis: What Really Drives Long-Term Value
Technical analysis tells you where price might go. Fundamentals tell you whether it's justified when it gets there.
The tokenomics picture carries a structural positive: with 21 billion total tokens and roughly 17.5 billion already in circulation, IOST isn't facing a catastrophic supply overhang from future unlocks. The remaining emission schedule is modest, meaning inflation pressure on token price is manageable compared to altcoins with 50-70% of supply still locked.
Where the fundamental story gets complicated is ecosystem traction. The IOS blockchain has been operational since 2019 and has hosted DeFi protocols, gaming dApps, and NFT projects. Total value locked in IOS DeFi protocols is measured in the low millions of dollars - real activity, but not the scale that generates significant organic demand for the native token. For comparison, DefiLlama's cross-chain TVL data shows Ethereum and Solana dominating with hundreds of billions and tens of billions respectively.
Proof of Believability remains a genuine technical differentiator, particularly for high-throughput applications that find Ethereum prohibitively expensive. The question for long-term investors is whether IOS can capture a meaningful niche - or whether the window for a smaller Layer-1 to gain developer mindshare has largely closed.
How to Buy IOST: Getting Started for New Investors
For anyone reading an IOST price prediction and considering a position, here's the actual process:
- Choose a reputable exchange that lists IOST
- Create and verify your account (KYC)
- All regulated exchanges require identity verification (passport or national ID)
- Process typically takes 15 minutes to 24 hours depending on the platform
- Deposit funds
- Fiat: USD, EUR via bank transfer or card
- Crypto: deposit USDT, BTC, or ETH and trade for IOST
- Stablecoins are the most direct route - deposit USDT, buy IOST/USDT
- Place your buy order
- Market order: executes immediately at current price (~$0.0011)
- Limit order: sets your preferred entry price; fills when IOST reaches that level
- For micro-cap altcoins like IOST, limit orders are preferable - spreads can be wide
- Transfer to a self-custody wallet
- Leaving tokens on an exchange exposes you to platform risk
- IOST is supported by Ledger hardware wallets and the official iWallet (IOS ecosystem wallet)
- For any position above a few hundred dollars, moving to self-custody is the responsible approach
Crypto trading involves substantial risk of loss. Only commit capital you can afford to lose entirely.
IOST Investment Risks and Red Flags to Watch
Every investment has risks. IOST has more than most, and being direct about them is more useful than glossing over them.
Specific red flags to watch:
- Promises of returns on IOST in any Telegram group or social account - these are always manipulative or fraudulent
- Unofficial wallet addresses distributed via social media - always use the official IOST website and verified repositories
- Sudden volume spikes without news - a classic pump-and-dump pattern that IOST, like any low-liquidity altcoin, is susceptible to
- "IOST going to 10x this month" style claims - legitimate analysts don't make claims like this with any precision
The 80%+ drawdown from ATH history is a real data point. At any moment, a broader crypto market correction can take IOST back below $0.0005. Factor that into position sizing before entering.
IOST vs Competitors: How Does It Stack Up?
No Layer-1 blockchain exists in a vacuum. Understanding IOST's relative position against competing chains is essential context for evaluating the investment thesis. This comparison is notably absent from most IOST coverage - which leaves a critical gap for investors making allocation decisions.
The data tells a clear story. IOST's technical specs - particularly PoB-enabled throughput - are genuinely competitive with the best-in-class chains on paper. But technical specs and market position are different things. Where IOST has carved real ground is in the Asian developer market, particularly in gaming dApps and on-chain entertainment applications where its low transaction costs and high throughput are genuinely valuable. For further reading on how EOS navigated similar competitive dynamics, our EOS price prediction covers the Vaulta repositioning strategy as a useful comparative case.

IOST Investment Strategy: How to Approach IOST in 2026
Knowing where IOST might go is only useful if you have a clear plan for how you'll manage the position. Here are three structured approaches based on investor profile.
Popular Approaches: HODLing, DCA, and Active Trading
HODLing is the buy-and-hold approach. For IOST, it's only rational if you genuinely believe the IOS blockchain will achieve substantially higher ecosystem adoption over a multi-year horizon. Given the modest market cap and genuine technical differentiation, a long-term holder thesis is at least intellectually coherent - but requires patience measured in years, not months.
Dollar-cost averaging is the most defensible strategy for retail participants who want IOST exposure without trying to time the market. A practical DCA approach: $30-$50 of IOST purchased weekly or bi-weekly regardless of price. Over 6-12 months, this smooths your average cost across price fluctuations and removes the psychological pressure of calling the bottom. The XRP price prediction guide on this blog covers DCA mechanics for volatile altcoins in detail, and the same logic applies directly to IOST.
Active trading uses the technical signals covered earlier - RSI extremes for entries, MACD crossovers for momentum confirmation, and Bollinger Band breakouts for volatility plays. Swing trading - holding positions for days to weeks around clear technical setups - is more practical than day trading for most participants. IOST's historical cyclicality with BTC market moves makes it a reasonable swing candidate when the broader market shows clear directional momentum.
Risk Management Essentials for IOST Investors
Regardless of strategy, these rules apply:
- Position sizing: IOST is a high-risk, speculative altcoin. A 1-5% allocation within a broader crypto portfolio is a common range for this risk tier. Allocating 20-30% of crypto holdings to a single micro-cap is an approach that historically ends badly.
- Stop-loss placement: The nearest significant support level sits around $0.0005-$0.0007. A stop 20-25% below entry price is a rough rule of thumb for volatile altcoins.
- Portfolio diversification: IOST shouldn't be your only crypto position, let alone your only investment. Correlation risk is real - in a severe market downturn, almost all altcoins move together.
- The fundamental rule: Don't invest what you can't afford to lose completely. Not as a legal disclaimer - as a genuine strategy constraint.
IOST Price Prediction: Final Verdict and Conclusion
Any honest iost price prediction ends with the same conclusion: the outcome is highly uncertain, the base case is modest, and the bull case requires a specific combination of market conditions that may or may not materialize.
📊 Summary by Investor Type
LONG-TERM INVESTOR
A small allocation via DCA is defensible if you believe in blockchain adoption broadly and want micro-cap exposure. Keep position sizing disciplined - 1-5% of crypto portfolio maximum.
ACTIVE TRADER
Wait for clearer technical confirmation. The current Death Cross configuration and neutral RSI don't offer a high-conviction entry. Watch for a Golden Cross on the daily chart before committing.
BEGINNER
Understand the risks fully before entering. IOST has drawn down 99%+ from ATH twice. Start with a paper portfolio to test your thesis, then scale in with amounts you can genuinely afford to lose.
The Binance 5-year market consensus projects just 27.6% appreciation to approximately $0.0014 by 2031 - a gain that a money market fund would match without the volatility or project risk. That conservative projection doesn't negate the bull case entirely; altcoin cycle dynamics can produce multiples far in excess of trend-based models. But it's a reminder that the most likely outcome, according to aggregate market sentiment, is modest gains - not a breakout.
What the broader on-chain ecosystem trajectory signals is a gradual shift toward verifiable, trustless systems where outcomes can be confirmed directly - not claimed by intermediaries. Projects that demonstrate genuine utility, transparent mechanics, and real user demand tend to compound value across cycles. Whether IOST delivers on that standard depends on the decisions its development team makes in the next 18-24 months.
Crypto trading involves substantial risk of loss. Past price performance is not indicative of future results. Nothing in this article constitutes financial advice or a recommendation to buy, sell, or hold any asset.
Last updated: April 15, 2026.
Frequently Asked Questions
What is the IOST price prediction for 2026?
For 2026, the base case places IOST between $0.0005 and $0.0015 for most of the year, anchored near the current price of ~$0.0011. In a bullish scenario where Bitcoin's post-halving momentum drives an altcoin rally, IOST could push toward $0.0025-$0.0028. Short-term technical indicators - including a bearish 4H 50 DMA and neutral RSI with weak bearish divergence - suggest limited upside in the immediate term. Any significant move higher would require a clear reversal in the moving average picture and sustained broader crypto market momentum.
What is IOST expected to be worth in 2030?
IOST's 2030 price prediction spans three scenarios. The bear case (continued stagnation) keeps IOST between $0.0005 and $0.0012. The base case - steady ecosystem development and moderate altcoin cycle participation - puts 2030 in the $0.004-$0.010 range. A full bull case, requiring significant IOS dApp adoption and a strong altcoin season, could see IOST reach $0.015-$0.030. The Binance community consensus extrapolates just $0.0014 by 2031 based on trend continuation. Long-term predictions carry extreme uncertainty - treat any specific number as illustrative, not a target.
Is IOST a good investment in 2026?
Whether IOST suits your portfolio depends entirely on your risk profile. The honest answer: it's a high-risk, speculative micro-cap altcoin trading 99%+ below its all-time high, in a competitive Layer-1 market dominated by chains with larger ecosystems and deeper developer activity. That profile carries real potential for significant losses. On the other side, the Proof of Believability technology is legitimate, the tokenomics aren't adversarial, and micro-cap altcoins that survive multiple market cycles can produce outsized returns in bull conditions. Appropriate position sizing is the only rational framework here.
How does Bitcoin halving affect IOST price?
Bitcoin halvings reduce the rate of new BTC issuance, historically triggering bull markets 12-18 months post-event as reduced supply meets steady demand. For altcoins like IOST, the effect is amplified: capital that flows into Bitcoin during initial post-halving strength eventually rotates into higher-risk altcoins - a phenomenon known as altcoin season. The April 2024 Bitcoin halving is the most relevant cycle for IOST's 2025-2027 price trajectory. If previous halving patterns repeat, the strongest altcoin season effects would arrive roughly in late 2025 through 2027. IOST's performance in that window will largely depend on whether it can offer a compelling enough narrative to attract rotating capital.
What are the main risks of investing in IOST?
Five risks dominate the IOST investment thesis. Market volatility: IOST has experienced 80-99% drawdowns from peaks and can move 30-50% in either direction within weeks. Liquidity risk: thin order books compared to top-20 cryptos create significant slippage on larger orders. Competition risk: Ethereum, Solana, and dozens of other Layer-1 chains compete for the same developer mindshare IOS needs to grow. Regulatory risk: evolving global crypto regulation - particularly in key Asian markets - could restrict access or demand. Project development risk: if IOS development activity continues slowing without a clear catalyst, the ecosystem could stagnate. Managing all five requires honest position sizing and willingness to exit if conditions materially deteriorate.
What is dollar-cost averaging and should I use it for IOST?
Dollar-cost averaging (DCA) means buying a fixed dollar amount of an asset at regular intervals regardless of price - for example, $25 of IOST every week. The mechanism automatically purchases more tokens when prices are low and fewer when high, lowering your average cost basis over time without requiring precise market timing. For a volatile micro-cap like IOST, DCA is arguably the most defensible retail strategy. A practical approach: set up recurring buys of $20-$50 on Binance or MEXC on a weekly or bi-weekly schedule over 6-12 months. Always set a hard cap on your total allocation before starting.
Should I HODL IOST or actively trade it?
The right approach depends on your experience and time availability. HODLing works if you have a genuine multi-year thesis - specifically, if you believe IOS blockchain will capture meaningful ecosystem share over a 3-5 year horizon. It requires psychological fortitude to watch your position drop 50%+ in bear cycles without panic selling. Active trading can be profitable for experienced traders comfortable with micro-cap mechanics: thin order books, wide spreads, and rapid moves. RSI extremes and MACD crossovers provide usable signals in trending markets. For most investors, DCA accumulation with a long-term hold period represents the practical middle ground between these extremes.
