
The crypto market has lost more than $2 trillion in value since October 2025. Bitcoin is trading near $65,600 as of February 28, 2026, down roughly 48% from its all-time high of $126,272 reached on October 6, 2025. Ethereum has been hit even harder, falling over 60% to around $1,920. The Crypto Fear & Greed Index reads 11 - Extreme Fear, its lowest sustained reading since mid-2022. So why is crypto crashing, and is this another temporary dip or the start of a prolonged bear market?
⚡ Quick Answer
Crypto is crashing because six macro and structural forces converged in late 2025 and early 2026: Trump's 15% global tariff shock, a tech stock collapse, record liquidations exceeding $3.2 billion in a single day, Bitcoin ETFs flipping to net sellers after a $3.8 billion outflow streak, a critical technical breakdown below Bitcoin's 365-day moving average, and escalating geopolitical tensions pushing capital into cash. Bitcoin has fallen 48% from its $126,272 ATH to roughly $65,600, and the total crypto market cap has dropped from $4.4 trillion to about $2.3 trillion. Analysts at Bernstein expect Bitcoin to bottom in the $60,000 range in H1 2026 before recovering later in the year.
This article breaks down every factor driving the current decline, compares it to previous bitcoin crash history cycles, explores what signals point toward recovery, and explains what you should consider doing with your portfolio right now. Whether you are wondering why crypto is going down today or trying to understand the broader crypto crash 2026, we cover it all with verified data and expert analysis.

Why Is Crypto Going Down Today?
The crypto market on February 28, 2026 is under pressure from a combination of fresh tariff-related headlines and lingering structural weakness that has persisted since Bitcoin's October 2025 peak. According to CoinDesk, Bitcoin fell 2% in the most recent 24-hour session, dragging Ethereum, XRP, and Solana lower alongside it. The broader CoinDesk 20 Index also registered losses, confirming this is not an isolated move but a market-wide risk-off event.
The immediate trigger is continued uncertainty around U.S. trade policy. On February 21, President Trump announced an increase of the global tariff rate from 10% to 15%, which markets interpreted as inflationary and potentially harmful to global growth. Bitcoin briefly stabilized near $69,500 midweek on renewed ETF inflows of $506.5 million on February 25, but sellers quickly returned, erasing most of Wednesday's gains by Friday.
Understanding how BTC dominance shifts during these sell-offs helps explain why altcoins are falling even harder than Bitcoin itself. With dominance near 58-60% as of late February, capital is rotating away from smaller assets and concentrating in Bitcoin as a relative safe haven within crypto.
The Numbers Behind the Drop
The scale of the decline is easier to grasp across the full spectrum of major assets.
According to Fortune's analysis, both Bitcoin's and Ethereum's year-to-date performances in 2026 are the worst on record - worse than the starts of 2018, 2022, or any other year in their respective histories. What makes this particularly unusual is that stocks have not followed crypto lower. The S&P 500 is up roughly 0.4% year-to-date, and gold has rocketed approximately 17%, creating a sharp divergence that suggests the crypto crash reasons are partly structural and not merely a macro risk-off event.

Crypto Crash Explained: 6 Reasons the Market Is Falling
No single event caused this crash. Instead, six separate forces converged into what many analysts are now describing as a "perfect storm" for crypto. Each factor amplifies the others, creating a negative feedback loop that has persisted for nearly five months. Here is the crypto crash explained, factor by factor.
1. Trump's 15% Global Tariffs Triggered Fresh Selling
The most immediate catalyst behind today's crypto decline is trade policy. On February 23, 2026, President Trump announced a 15% global tariff rate increase, expanding on the tariff escalation that began in October 2025. Bitcoin fell more than 5% within hours of the announcement, briefly dropping below $65,000.
This is not the first time tariffs have crushed crypto. The original "10/10 crash" on October 10, 2025 - triggered by Trump's tariff threats against China - produced over $19 billion in leveraged position liquidations within 24 hours, the largest single-day liquidation event in crypto history. Bitcoin plummeted from approximately $122,000 to $105,000 in that single session.
"We believe that the sudden uptick in tariff rates is causing investors to sell crypto assets in anticipation of a more serious market decline."
- Jeff Mei, COO, BTSE (via BTSE Blog)
The mechanism is straightforward: tariffs raise inflation expectations, which reduce the likelihood of interest rate cuts, which keeps yields elevated, which pulls capital out of risk assets. Crypto, as the highest-beta risk asset class, gets sold first. According to Bitget's analysis, crypto showed a strong negative correlation (-69%) with gold at the time of the February tariff announcement - meaning investors were moving to USD and Treasuries, not simply rotating between asset classes.
2. Tech Stock Collapse Dragging Crypto Down
Crypto's correlation with U.S. technology equities has increased dramatically throughout 2025-2026. When the Nasdaq bleeds, Bitcoin bleeds with it, and the tech sector delivered significant pain in early 2026.
In late January, Microsoft reported quarterly earnings that disappointed investors, sending its stock down approximately 10% in a single session. That move cascaded through global equities and directly into crypto. As Al Jazeera reported, "a sell-off of global stocks amid geopolitical uncertainty and recent volatility in the price of gold and silver are part of the reason for the drastic fall in the price of Bitcoin."
The AI trade unwinding has added another layer of pressure. AI-related crypto miners pursuing high-performance computing strategies have been forced to liquidate Bitcoin holdings to support their balance sheets as financing conditions tightened, adding incremental spot supply at exactly the wrong moment.
3. Record Liquidations - $3.2 Billion in a Single Day
Leverage is what turns a correction into a crash. The first weekend of February 2026 - which traders have labelled "Black Sunday II" - produced $2.56 billion in single-day liquidations, according to Reuters citing CoinGlass data. But the record came days later: on February 5, Bitcoin's entity-adjusted realized loss hit $3.2 billion - an all-time record.
Understanding how liquidation heatmaps work reveals why cascading liquidations amplify crashes far beyond what organic selling pressure would produce. Once leveraged positions start closing automatically, price discovery turns mechanical - selling triggers more selling in a vicious cascade.
📅 Liquidation Timeline - February 2026
Feb 1-2 - "Black Sunday II"
$2.56B liquidated in a single day. BTC broke below $80,000. A single trader lost $222.65M on an Ether position on Hyperliquid.
Feb 5 - Record Realized Loss
$3.2B in entity-adjusted realized losses - an all-time record. BTC briefly broke below $61,000. A -6.05σ move on the rate-of-change Z-score.
Feb 1-6 - Full Crash Window
$3-4B total liquidations. BTC dropped approximately 30% in one week.
Feb 23-24 - Tariff Shock
$770M+ liquidated in 24 hours after Trump's 15% tariff announcement. BTC fell to approximately $62,965.
4. Institutional Sellers Flip the Script
This is the structural reversal that changed everything. Throughout 2025, institutional buying through spot Bitcoin ETFs created a persistent demand floor. In 2026, that floor collapsed.
U.S. spot Bitcoin ETFs experienced five consecutive weeks of net outflows totaling $3.8 billion through February 20, according to CoinDesk - the longest sustained outflow streak since the ETFs launched in January 2024. CoinShares separately reported that digital asset investment products recorded $1.7 billion in outflows over two consecutive weeks, with year-to-date flows turning negative.
"This steady selling in our view signals that traditional investors are losing interest, and overall pessimism about crypto is growing."
- Marion Laboure, Analyst, Deutsche Bank (via Bitget)
There was a brief reversal on February 25 when $506.5 million flowed back in, with BlackRock's IBIT leading at $297 million. However, by February 27, ETFs had flipped back to $27.55 million in net outflows, suggesting that the single positive day was a brief counter-trend bounce rather than a sustained reversal.
5. Bitcoin Breaks Below the 365-Day Moving Average
On a technical basis, the signal that alarmed long-term Bitcoin analysts most was the break below the 365-day moving average - a level that had held as support throughout the entire 2023-2025 bull market. According to CryptoQuant data cited by Bitget, Bitcoin broke below this average for the first time since March 2022, and has since declined 23% from the breakdown point.
The weekly RSI (Relative Strength Index) has simultaneously dipped below 30 for the first time since mid-2022 - a level that historically marks either capitulation bottoms or the beginning of sustained bear markets, depending on macro conditions. Bitcoin also lost the psychologically critical $69,000 level - the 2021 cycle ATH - which had been expected to serve as strong support.
Kraken's VP Matt Howells-Barby has identified the $54,000-$69,000 range as a well-defined support zone where the market is most likely to form a base. Bitcoin is currently in the upper portion of that range.
6. Geopolitical Risk Drives Capital to Cash
Beyond tariffs, a growing U.S. military presence in the Middle East has raised fears of armed conflict involving Iran that could disrupt global trade flows. This uncertainty is pushing capital into traditional safe havens - cash and short-term Treasuries - and out of speculative assets.
What makes the current geopolitical overlay particularly damaging for crypto is that gold, silver, and crypto have all fallen together at various points in February 2026. According to Fortune, gold has rocketed about 17% year-to-date while crypto has tanked - the widest divergence between the two asset classes in recent memory. This destroys the "digital gold" narrative that had supported Bitcoin's valuation in prior cycles.
📉 Bearish Factors Summary
- Tariffs: 15% global tariff creating persistent inflation fears and rate-cut delay expectations
- Tech correlation: Crypto trading as a leveraged Nasdaq bet, not as an independent asset
- Leverage flush: Over $10B+ in total liquidations since October 2025
- Institutional exit: $3.8B in ETF outflows over 5 weeks through Feb 20
- Technical breakdown: 365-day MA lost, weekly RSI below 30
- Geopolitics: U.S.-Iran tension and Middle East instability driving cash hoarding

Why Did Bitcoin Drop From $126,000 to $65,000?
The journey from Bitcoin's all-time high to its current price was not a single crash but a series of cascading breakdowns over nearly five months. Understanding this timeline helps explain why the current drawdown feels different from previous cycles.
Bitcoin hit $126,272 on October 6, 2025, fueled by sustained ETF inflows, corporate treasury buying from Strategy (formerly MicroStrategy), and a pro-crypto regulatory environment under the Trump administration. Just four days later, on October 10, the "10/10 crash" wiped out $19 billion in leveraged positions as Trump's tariff threats against China shocked markets.
From that point, as Reuters reported, Bitcoin never truly recovered. It spent November and December in a grinding decline, breaking below $80,000 by late November. January 2026 brought no relief - Bitcoin opened the year already under pressure and continued falling. The February liquidation cascade, described above, pushed it briefly below $61,000 before a partial recovery to the current $65,000-$66,000 range.
What makes this decline structurally significant is its duration. Previous bitcoin crashes typically featured a sharp initial drop followed by a period of consolidation. The 2025-2026 decline has been more of a slow bleed punctuated by violent liquidation events - a pattern that Danny Nelson, research analyst at Bitwise, describes as a clear "Crypto Winter." His reasoning: "You can tell by how investors react to good news. They don't."
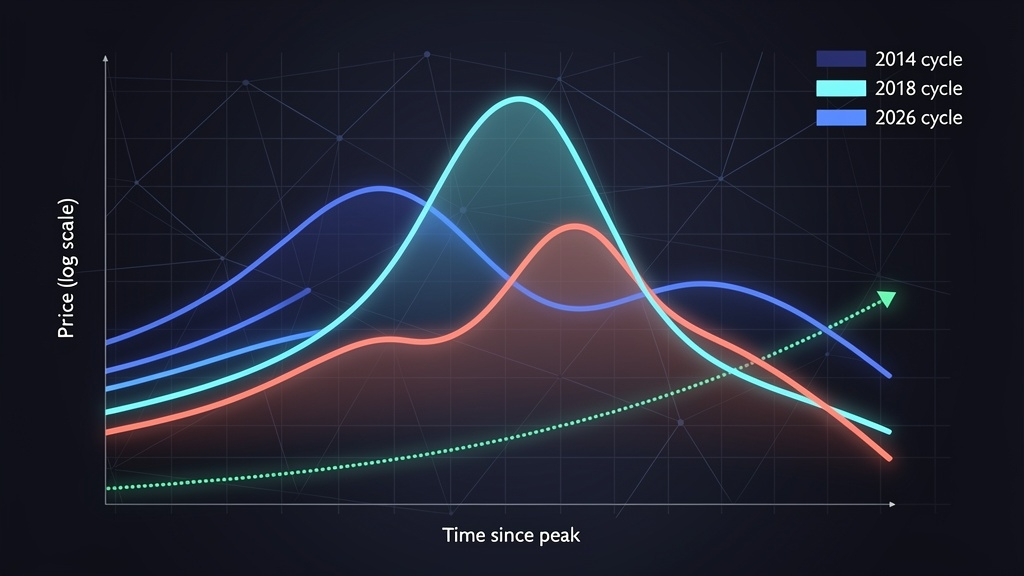
Bitcoin Crash History: How Does 2026 Compare?
The question of whether crypto is dead surfaces during every major downturn, and every time, the answer has eventually been no. But each crash has its own character, and understanding how 2026 compares to prior cycles provides essential context for what might come next.
Two important patterns emerge from this bitcoin crash history. First, the 2026 drawdown at -52% is currently less severe than the -78% to -85% drawdowns of previous bear markets, meaning further downside is historically possible. Stifel Financial, a 136-year-old investment bank, has warned that Bitcoin could fall as far as $38,000 based on a 15-year trendline connecting prior crash bottoms - which would represent a roughly 70% decline from ATH, consistent with prior cycles.
Second, every previous crash was followed by a full recovery and new all-time highs - though recovery timelines ranged from 2 to 3 years. As the researcher behind the account @PricedinBTC noted on X: "Bitcoin is down 47% from ATH. Historically, buying at -50% drawdown has a 90% win rate over 1 year with a median return of +95%. At -70%, the win rate is 100%."
Crypto Crash 2026: Is Crypto Dead?
The phrase "is crypto dead" resurfaces during every major downturn. Google Trends shows search interest for the term spiking to new highs in February 2026, just as it did in 2018 and 2022. And just as in those prior cycles, the evidence suggests that crypto infrastructure is actually stronger than ever - even as prices collapse.
Consider what has changed structurally since the last bear market. Spot Bitcoin ETFs now hold approximately $165 billion in assets under management, according to Bernstein. Corporate treasuries like Strategy continue to accumulate - Strategy has added approximately $3.8 billion in Bitcoin year-to-date in 2026 despite the downturn. A U.S. Strategic Bitcoin Reserve has been established using seized government holdings. These are institutional-grade developments that did not exist during previous crashes.
"Crypto's reality is getting stronger. These changes are going to last well beyond the current downturn."
- Danny Nelson, Research Analyst, Bitwise (via Fortune)
As Francesco Solfrini wrote on LinkedIn: "Crypto is dead for the 482nd time. So, is crypto dead? No. But the 'get rich by Tuesday' era is over. We have entered the phase of Structural Maturity."
The honest answer is that crypto as an asset class is not dead, but the easy-money phase of this cycle is almost certainly over. If you are learning crypto as a beginner, the good news is that bear markets are historically the best time to build knowledge and position yourself for the next cycle.
When Will Crypto Recover? Signs to Watch
Predicting the exact bottom is impossible, but analysts have identified specific signals that would suggest the worst is over. Here is what the data says about when crypto may recover.
According to Glassnode data cited by BeInCrypto, Bitcoin's Realized Profit/Loss Ratio (90-day smoothed) has fallen below 1.0 for the first time since 2022. Historically, periods below this threshold have lasted approximately six months before reclaiming it - which would point toward a recovery beginning around Q3 2026.
However, a shorter-term view based on monthly performance data offers a different perspective. February 2026 could mark Bitcoin's fifth consecutive negative month. According to Coinglass historical data cited by BeInCrypto, the longest monthly losing streak in Bitcoin history is six months - meaning a reversal could arrive as early as April 2026.
The analyst community is split on timing. Bernstein expects Bitcoin to bottom in the $60,000 range in H1 2026 and then establish a higher base, eventually setting the stage for what they describe as potentially the "most consequential cycle" for Bitcoin. Standard Chartered has cut its 2026 year-end target to $100,000 from a previous $150,000. Meanwhile, Fundstrat's Tom Lee has suggested that the crypto winter could end as soon as March.
📈 Recovery Signals to Watch
- Bitcoin reclaims $69,000: The former 2021 ATH level. Reclaiming and holding it would shift the short-term technical outlook from bearish to neutral
- ETF outflows reverse to sustained inflows: Two or more consecutive weeks of net inflows would signal institutional sentiment has bottomed
- Fear & Greed Index rises above 25: Moving from "Extreme Fear" (11) to "Fear" (25+) would suggest panic selling is exhausting itself
- Tariff clarity: A clear resolution or softening of the 15% rate would remove the macro overhang weighing on all risk assets
- Realized Profit/Loss Ratio returns above 1.0: This Glassnode metric historically signals the transition back to a constructive market environment
⚠ Risk Warning
Not all analysts are bullish. Stifel Financial has warned that Bitcoin could fall to $38,000 based on historical trendline analysis. Standard Chartered analyst Geoff Kendrick has warned BTC could drop to $50,000. On prediction market Kalshi, traders give 78% odds that Bitcoin will fall below $65,000 at some point in 2026 - a threshold that has already been breached. Treat all recovery predictions with appropriate skepticism.
What Should You Do During a Crypto Crash?
Bear markets test discipline more than knowledge. The historical data shows that the majority of long-term Bitcoin holders who bought during previous extreme fear periods eventually saw positive returns, but the psychological difficulty of holding through further declines should not be underestimated. Here are evidence-based approaches that experienced investors use during downturns, as explored in more detail in our guide on how to navigate crypto in 2026.
The first and most important principle is position sizing. If the current decline is causing you significant financial stress, your position is too large relative to your risk tolerance. No forecasted recovery justifies holding a position that damages your financial stability or mental health today.
For investors who are comfortable with their exposure, dollar-cost averaging (DCA) into established assets like Bitcoin and Ethereum during periods of extreme fear has historically produced strong returns. The data from @PricedinBTC mentioned earlier - a 90% win rate over one year for purchases at -50% drawdowns - supports this approach, though past performance does not guarantee future results.
Learning to spot overbought crypto markets is equally important for knowing when not to buy during relief rallies that may fail. And diversifying beyond crypto entirely - as covered in our guide to building a successful crypto strategy without luck - remains the most reliable risk management framework.
🎯 Key Takeaways
- The crypto crash 2026 is driven by six converging forces: tariffs, tech correlation, liquidation cascades, institutional outflows, technical breakdowns, and geopolitical risk
- Bitcoin is down 48% from its ATH of $126,272 - severe, but less than the 78-85% declines of prior bear markets, meaning further downside is possible
- The Fear & Greed Index at 11 is at levels that have historically preceded medium-term bottoms - but timing is uncertain
- Bernstein expects a bottom in the $60K range in H1 2026, while Stifel warns of a possible decline to $38,000
- Crypto infrastructure (ETFs, corporate treasuries, regulation) is stronger than in any prior crash - supporting the view that this is a cycle, not an ending
- Every prior Bitcoin crash (-85% in 2014, -84% in 2018, -78% in 2022) was followed by full recovery and new all-time highs within 2-3 years

Frequently Asked Questions
Why is crypto crashing right now?
Crypto is crashing due to six converging factors: Trump's 15% global tariff shock, tech stock weakness dragging crypto lower, record liquidations exceeding $3.2 billion in a single day, Bitcoin ETFs experiencing $3.8 billion in outflows over five weeks, Bitcoin breaking below its 365-day moving average for the first time since March 2022, and geopolitical tensions driving capital into cash. No single event caused the decline - it is the cumulative result of months of selling pressure since the October 2025 ATH.
Is crypto in a bear market in 2026?
Analysts are divided. Bernstein characterizes the current decline as a "short-term crypto bear cycle" that could reverse in H1 2026, with Bitcoin bottoming in the $60,000 range. VanEck describes it as "orderly deleveraging" rather than full capitulation. Coin Bureau's Nic Puckrin takes a more bearish view, calling it "a transition from distribution to reset" that will take months. By historical standards, a 48% decline from ATH with sustained negative sentiment is consistent with bear market conditions.
When will crypto recover?
Glassnode data suggests the current loss-dominated regime could persist for approximately six months (pointing to Q3 2026), while monthly performance data suggests a potential reversal as early as April. Bernstein expects the bottom to form in H1 2026. Key signals to watch include Bitcoin reclaiming $69,000, ETF outflows reversing, the Fear & Greed Index rising above 25, and clarity on U.S. tariff policy.
Is crypto dead?
No. While the phrase "is crypto dead" trends during every major downturn, crypto infrastructure is stronger than in any prior cycle. Spot Bitcoin ETFs hold $165 billion in AUM, corporate treasuries continue accumulating, and a U.S. Strategic Bitcoin Reserve now exists. Every prior crash (2014, 2018, 2022) was followed by full recovery and new all-time highs. The easy-money phase of this cycle appears over, but the asset class itself is not dying.
How low can Bitcoin go in 2026?
Analyst predictions range widely. Bernstein expects Bitcoin to bottom around $60,000. Standard Chartered analyst Geoff Kendrick has warned of a drop to $50,000. Stifel Financial forecasts a possible decline to $38,000 based on a 15-year trendline. On prediction market Kalshi, traders give 78% odds that Bitcoin falls below $65,000 at some point in 2026. The $54,000-$60,000 range is the consensus support zone identified by Kraken's analysis team.
Should I sell my crypto during the crash?
That depends entirely on your financial situation, time horizon, and risk tolerance. If your position is causing financial stress, reducing exposure may be appropriate. If you are a long-term investor, historical data shows that selling during extreme fear periods has typically been a poor strategy. Buying at -50% drawdowns has shown a 90% win rate over one year historically. However, past performance does not guarantee future results, and further downside is possible.
What should I buy during a crypto crash?
If you choose to buy, established assets like Bitcoin and Ethereum carry lower risk than altcoins during bear markets. BTC dominance at 58-60% reflects capital rotating away from smaller assets. Dollar-cost averaging (investing fixed amounts at regular intervals) reduces the risk of timing the bottom incorrectly. Never invest more than you can afford to lose.
Conclusion
The crypto crash of 2026 is not a mystery - it is the result of six identifiable forces converging at once: tariff-driven macro stress, tech stock correlation, leveraged liquidation cascades, institutional ETF outflows, technical breakdowns on the charts, and geopolitical uncertainty pushing capital toward safety. Bitcoin's 48% decline from $126,272 to approximately $65,600 is severe but remains less extreme than the 78-85% drawdowns of prior bear cycles, meaning both recovery and further downside remain on the table.
The crypto fear greed index at 11 reflects genuine despair, but historical data consistently shows that periods of maximum fear precede the best buying opportunities - for those with the patience and risk tolerance to act. Whether recovery begins in April, Q3, or later depends largely on macro developments that remain genuinely uncertain.
What is not uncertain is that crypto has survived worse. It survived Mt. Gox, the ICO collapse, the Terra-Luna implosion, and the FTX bankruptcy. Each time, the infrastructure emerged stronger. This cycle's institutional foundation - ETFs, corporate treasuries, regulatory frameworks - is more robust than anything crypto has had before. If you want to develop a disciplined approach for navigating these conditions, our guide to diversifying your crypto portfolio provides practical frameworks.
This article is updated regularly as market conditions evolve. Bookmark it for the latest crypto crash analysis.
Ready to Build Your Crypto Portfolio?
Bear markets reward the prepared. Start with small positions in established assets.
Start Trading on Zipmex →⚠ Disclaimer: The information provided in this article is not intended to provide investment or financial advice. Investment decisions should be based on the individual's financial needs, objectives, and risk profile. We encourage readers to understand the assets and risks before making any investment entirely. Cryptocurrency investments are subject to high market risk. Past performance does not guarantee future results.
