Fully diluted valuation (FDV) is a token's current price multiplied by its maximum supply, the most tokens that can ever exist. Market cap multiplies the same price by circulating supply, the tokens that can move freely on the market now. The price is the same in both, so the whole difference between them comes from supply. FDV shows what the market cap would be if every future token were already circulating at today's price. CoinGecko calls that figure theoretical, because releasing more supply can itself move the price.

The two formulas
- Market cap = current price × circulating supply. CoinGecko's methodology uses this formula. For smart-contract tokens, it gets circulating supply by subtracting locked tokens from total supply.
- FDV = current price × maximum supply. CoinDesk Learn defines fully diluted market cap this way. Where a token has no maximum supply, some data sites use total supply instead (see below).
The three supply figures
The two valuations differ only in which supply figure they use, so the definitions matter.
- Circulating supply: units that exist on the blockchain and can be freely sent between wallets (CoinDesk Learn).
- Total supply: every token that exists on the blockchain now. This includes tokens that are not publicly circulating, such as minted tokens still vesting or staking rewards not yet paid out. Burned tokens are excluded (CoinDesk Learn).
- Maximum supply: the total number of coins that can ever be minted (CoinDesk Learn). Bitcoin's is fixed at 21 million (bitcoin.org). Some major networks have no maximum at all.
The ratio and why price cancels out
Divide FDV by market cap and the price drops out:
FDV ÷ market cap = maximum supply ÷ circulating supply
So the FDV-to-market-cap ratio says nothing about valuation. It measures how much of the eventual supply is not yet circulating. Here is a hypothetical example (not a real token):
| Value | |
|---|---|
| Price | $2 |
| Circulating supply | 100 million |
| Maximum supply | 1 billion |
| Market cap | $200 million |
| FDV | $2 billion |
| Ratio | 10 |
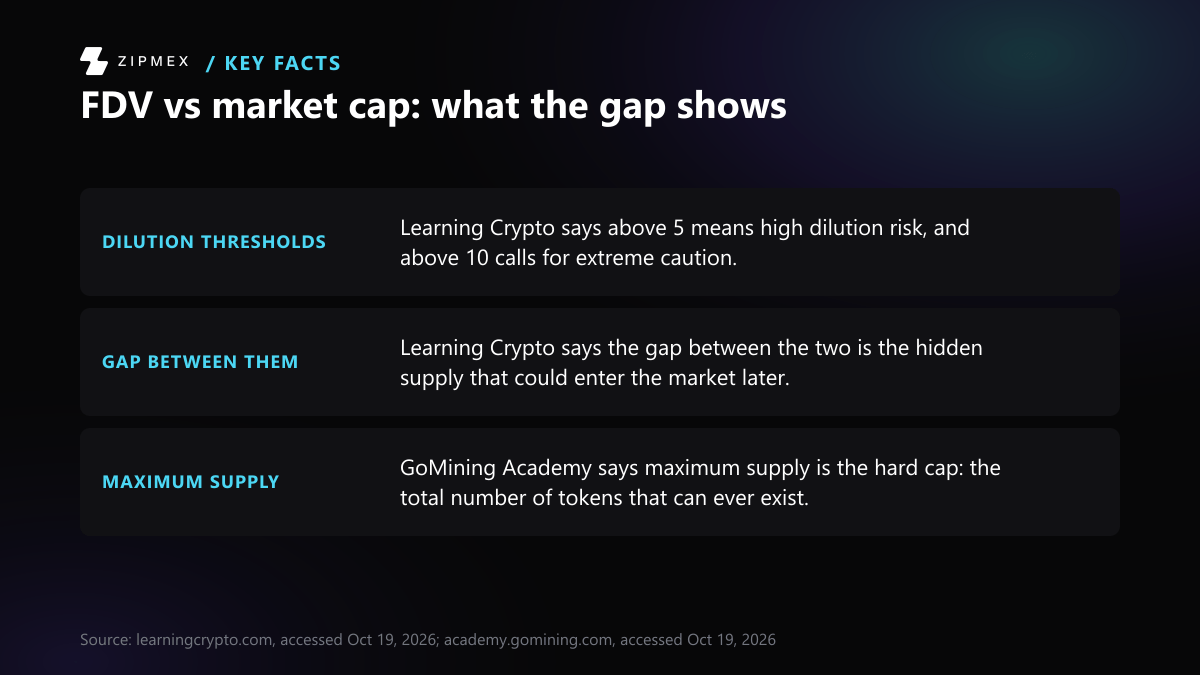
In this example, 90% of the eventual supply has yet to reach the market. Learning Crypto (Aug. 22, 2025) uses the ratio as a warning signal. It calls a ratio above 5 "high dilution risk as more tokens unlock" and says to "proceed with extreme caution" above 10. These cut-offs come from that one outlet. They are not an industry standard.
Bitcoin is the opposite case. Learning Crypto says Bitcoin's FDV is "barely 6% higher than its market cap", because nearly all coins have already been mined. It uses a $200,000 price for illustration, but because price cancels out, the gap would be the same at any price.
Which dilution band is your ratio in?
What does your token's FDV-to-market-cap ratio signal?
Is the FDV-to-market-cap ratio above 5?
- Yes → next question
- No → Ratio of 5 or less
Is the ratio above 10?
- Yes → Above 10
- No → Above 5, up to 10
The ratio is not above 5, so the high dilution risk flag does not apply.
Source: What Is FDV in Crypto? Fully Diluted Valuation Explained (learningcrypto.com), accessed Oct 19, 2026This band falls under the high dilution risk flag that Learning Crypto describes.
Source: What Is FDV in Crypto? Fully Diluted Valuation Explained (learningcrypto.com), accessed Oct 19, 2026Learning Crypto says a ratio this high calls for extreme caution, since much of the supply has yet to reach the market.
Source: What Is FDV in Crypto? Fully Diluted Valuation Explained (learningcrypto.com), accessed Oct 19, 2026The thresholds come from one source, and the tool only knows the answers you give.
Because FDV uses the maximum supply, and market cap uses circulating supply, FDV is almost always the larger number.
What dilution means
GoMining Academy (Mar. 14, 2026) puts it this way: "as more tokens enter circulation, each existing token represents a smaller share of the total value." That shrinking share is dilution. The gap between FDV and market cap shows how much of it is still to come.
Company shares use the same idea. Under U.S. accounting rules, companies report diluted earnings per share. That figure counts common stock equivalents, such as stock options and warrants, as if they had been exercised, using the treasury stock method. Anti-dilutive effects are excluded. A Form 10-K filed with the SEC (Tel Instrument Electronics, FY2015) describes the method. Token FDV is a rougher version. It assumes every future token exists, with no adjustment for exercise prices or proceeds.
Where FDV misleads
It ignores timing
Learning Crypto says FDV "doesn't show the schedule, just the destination." A large unlock next week is a different supply event from the same amount released over four years. CoinGecko makes the same point: depending on a token's emission schedule or lock-up period, full circulation "may take a significant time." To judge timing, read the project's own vesting and emission schedule.
It assumes a constant price
GoMining Academy notes that the formula "assumes the price stays exactly the same, no matter how many tokens are released." Treat FDV as an arithmetic projection, not a forecast.
Tokens with no maximum supply
- Ethereum: ethereum.org describes ETH supply as dynamic. Validators receive new ETH as rewards, and EIP-1559 burns part of transaction fees. When network activity is high, burning can exceed issuance and supply can shrink. With no cap, a "maximum supply" FDV cannot be calculated in the usual way.
- Solana: Solana's documentation sets initial inflation at 8% a year. The rate falls by 15% year over year until it reaches a long-term fixed 1.5% a year. Learning Crypto says platforms typically use total supply to calculate Solana's FDV, since there is no maximum.
In both cases the FDV you see depends on a convention chosen by the data provider.
Data sites disagree
GoMining Academy warns that data aggregators "may display FDV using total supply instead, which can lead to confusion." CoinGecko's glossary defines FDV as market cap "if the entirety of its supply is in circulation", without saying which supply figure it means. If two sites show different FDVs for the same token, first check which supply figure each one multiplies by.
The selling-pressure argument
An undated CoinMarketCap Academy article argues that a token with large outstanding emissions and an FDV well above its market cap "may likely be under constant selling pressure." It attributes this to early investors selling as vested tokens unlock. This is the author's view, not a measured result. Unlocks also differ in who receives them and on what terms.
A short checklist for reading FDV
- Find out which supply figure the FDV uses: maximum or total.
- Compare circulating supply with that figure to get the share still to be released.
- Check the project's own documentation for the unlock and emission schedule: how much, to whom, and when.
- For tokens with no cap, read FDV as a snapshot of current total supply, not a ceiling.
Limitations: the 5 and 10 ratio bands and the unlock-selling view each come from a single outlet, and no live token data is used here.